WHITE PAPER ON CRIME 2010
— Actual Situation and Treatment concerning Serious Offenders —
PART 1 Crime Trends in
Chapter 1 Penal Code Offenses
Section 1 Principal Data
 Fig. 1-1-1-1 Number of reported cases, persons cleared, and clearance rate for penal code offenses (1946-2009)
1 Reported cases and crime rate
Table 1-1-1-2 Number of reported cases, crime rate, number of cleared cases and persons cleared, and clearance rate for penal code offenses by type of offense (2009)
Fig. 1-1-1-3 Percent distribution of reported cases and persons cleared for penal code offenses by type of offense (2009)
Fig. 1-1-1-4 Number of reported cases for non-traffic penal code offenses excluding theft by type of offense (1990-2009)
2 Persons cleared
Fig. 1-1-1-5 Percent distribution of persons cleared for non-traffic penal code offenses by age group (1980-2009)
Fig. 1-1-1-6 Number of females cleared for non-traffic penal code offenses and rate per population (1946-2009)
Table 1-1-1-7 Number of persons cleared for non-traffic penal code offenses by type of offense and gender (2009)
Section 2 Non-traffic Penal Code Offenses
1 Theft
Fig. 1-1-2-1 Number of reported/cleared cases and clearance rate for theft (1980-2009)
Fig. 1-1-2-2 Number of reported cases for theft (by modus operandi) (1990-2009)
Fig. 1-1-2-3 Percent distribution of reported cases for theft by modus operandi (2009)
2 Non-traffic penal code offenses excluding theft
Fig. 1-1-2-4 Number of reported/cleared cases and clearance rate for non-traffic penal code offenses excluding theft (1980-2009)
Fig. 1-1-2-5 Number of reported/cleared cases and clearance rate for non-traffic penal code offenses (major offenses) (1990-2009)
Table 1-1-2-6 Number of reported cases for injury, assault, and intimidation by place of occurrence (2009)
Fig. 1-1-2-7 Number of reported/cleared cases and amount of damage resulting from billing fraud (extortion) (2005-2009)
Table 1-1-2-8 Number of reported cases for forcible indecency by place of occurrence (2009)
Table 1-1-2-9 Number of reported cases for damage to property by damaged property (2009)
Table 1-1-2-10 Number of persons newly received and finally disposed in public prosecutors offices for acceptance of bribe (2009)
Table 1-1-2-11 Number of public officials newly received and finally disposed in public prosecutors offices by type of offense (2009)
Fig. 1-1-2-12 Number of persons newly received by public prosecutors offices for Anti- Organized Crime Act violations and amount of money confiscated/collected in a court of first instance (2001-2009)
Chapter 2 Special Act Offenses
Section 1 Principal Data
Fig. 1-2-1-1 Number of persons newly received by public prosecutors offices for special act offenses (1949-2009)
Fig. 1-2-1-2 Percent distribution of persons newly received by public prosecutors offices for special act offenses excluding violations of road traffic related acts by type of offense (2009)
Section 2 Major Special Act Offenses
1 Public security
Fig. 1-2-2-1 Number of persons newly received by public prosecutors offices for special act offenses relating to public security (1990-2009)
2 Environment/public morals
Fig. 1-2-2-2 Number of persons newly received by public prosecutors offices for special act offenses relating to environment/public morals (1990-2009)
3 Child Welfare Act violations, etc.
Fig. 1-2-2-3 Number of persons newly received by public prosecutors offices for Child Welfare Act violations, etc. (1990-2009)
4 Stalker Control Act violations, etc.
Fig. 1-2-2-4 Number of persons newly received by public prosecutors offices for Stalker Control Act violations, etc. (2000-2009)
5 Public Offices Election Act violations
Table 1-2-2-5 Number of persons newly received by public prosecutors offices for Public Offices Election Act violations (2000-2009)
Chapter 3 Offenses of Various Types
Section 1 Traffic Offenses
1 Trends in traffic offenses
Fig. 1-3-1-1 Number of traffic accidents and persons killed/injured in traffic accidents (1946- 2009)
Fig. 1-3-1-2 Number of hit-and-run cases and clearance rate (1992-2009)
Fig. 1-3-1-3 Number of referred cases for violations of road traffic related acts (1990-2009)
Fig. 1-3-1-4 Percent distribution of notified/referred cases for violations of road traffic related acts by type of violation (2009)
2 Disposition in public prosecutors offices
Fig. 1-3-1-5 Percent distribution of persons finally disposed in public prosecutors offices for traffic cases by type of disposition (2009)
Fig. 1-3-1-6 Percent distribution of indicted cases for dangerous driving causing death or injury by type of violation (2009)
3 Disposition in courts
Fig. 1-3-1-7 Percent distribution of persons sentenced to imprisonment (with or without work) in a court of first instance for dangerous driving causing death or injury, etc. by term of imprisonment (2009)
Section 2 Financial and Economic Offenses
1 Tax related offenses
Fig. 1-3-2-1 Number of persons newly received by public prosecutors offices for violations of tax related acts (1990-2009)
Table 1-3-2-2 Number of accused cases for violations of tax related acts and amount of tax evasion per case (FY 2005-FY 2009)
Table 1-3-2-3 Number of persons prosecuted or not prosecuted for violations of tax related acts (2005-2009)
2 Economic offenses
Fig. 1-3-2-4 Number of persons newly received by public prosecutors offices for obstruction of execution, etc. (1990-2009)
Table 1-3-2-5 Number of persons prosecuted or not prosecuted for obstruction of execution, etc. (2005-2009)
Fig. 1-3-2-6 Number of persons newly received by public prosecutors offices for violations of the Commercial Code and the Companies Act, etc. (1990-2009)
Table 1-3-2-7 Number of persons prosecuted or not prosecuted for violations of the Commercial Code and the Companies Act, etc. (2005-2009)
3 Financial offenses
Fig. 1-3-2-8 Number of persons newly received by public prosecutors offices for Investment Act violations, etc. (1990-2009)
Table 1-3-2-9 Number of persons prosecuted or not prosecuted for Investment Act violations, etc. (2005-2009)
4 Intellectual property-related offenses
Fig. 1-3-2-10 Number of persons newly received by public prosecutors offices for Trademark Act violations, etc. (1990-2009)
Table 1-3-2-11 Number of persons prosecuted or not prosecuted for Trademark Act violations, etc. (2005-2009)
Section 3 High-Technology Offenses
1 Trends in high-technology offenses
Table 1-3-3-1 Number of cleared cases for offenses involving computers or electromagnetic records, etc. (2005-2009)
Table 1-3-3-2 Number of cleared cases for offenses using cyber networks (2005-2009)
Table 1-3-3-3 Number of reported cases of computer viruses (2000-2009)
2 Disposition in public prosecutors offices
Table 1-3-3-4 Number of persons finally disposed in public prosecutors offices for hightechnology offenses (2009)
Chapter 4 Comparison of Crime Trends with Other Countries
Section 1 Major Offenses
Table 1-4-1-1 Number of reported cases, crime rate, and clearance rate for major offenses in each of the subject countries (1999-2008)
Section 2 Homicide
Table 1-4-2-1 Number of reported cases, crime rate, and clearance rate for homicide in each of the subject countries (2004-2008)
Section 3 Theft
Table 1-4-3-1 Number of reported cases, crime rate, and clearance rate for theft in each of the subject countries (2004-2008)
Chapter 5 Offenses Committed by and against Japanese Nationals Outside of Japan
Section 1 Offenses Committed by Japanese Nationals Outside of Japan
Table 1-5-1-1 Number of cases committed by Japanese nationals outside of Japan (2009)
Section 2 Offenses Committed against Japanese Nationals Outside of Japan
Table 1-5-2-1 Number of cases committed against Japanese nationals outside of Japan (2009)
PART 2 Treatment of Offenders
Chapter 1 Overview
Fig. 2-1-1 Flow of criminal justice procedure (adults)
Chapter 2 Prosecution
Section 1 Reception of Suspected Cases
Fig. 2-2-1-1 Percent distribution of persons newly received by public prosecutors offices by type of offense (2009)
Section 2 Arrest and Detention of Suspects
Table 2-2-2-1 Number of persons arrested or detained in cases disposed by public prosecutors by type of offense (2009)
Fig. 2-2-2-2 Detention request rejection rate (1990-2009)
Section 3 Disposition in Public Prosecutors Offices
Fig. 2-2-3-1 Percent distribution of persons finally disposed in public prosecutors offices by disposition and number of persons indicted, etc. (2000-2009)
Fig. 2-2-3-2 Number of persons prosecuted/not prosecuted, etc. by type of offense (2000-2009)
Table 2-2-3-3 Number of persons not prosecuted by reason (2009)
Chapter 3 Trial
Section 1 Final Judgments
Table 2-3-1-1 Number of persons finally judged by type of judgment (1969, 1979, 1989, 1999- 2009)
Section 2 Court of First Instance
1 Final judgments
Table 2-3-2-1 Number of persons finally disposed in district/summary courts by type of offense and judgment (2009)
2 Sentencing
Table 2-3-2-2 Number of persons sentenced to the death penalty or life imprisonment with work in a court of first instance by type of offense (2000-2009)
Table 2-3-2-3 Number of persons sentenced to imprisonment with or without work for a definite term in a court of first instance (2009)
Table 2-3-2-4 Number of persons sentenced to fine in a court of first instance by type of offense (2009)
3 Pretrial arrangement proceeding
Table 2-3-2-5 Number of persons in cases brought to a pretrial arrangement proceeding or inter-trial arrangement proceeding in district courts by type of offense (2009)
4 Speedy trial procedure
Table 2-3-2-6 Number of persons involved in cases brought to a speedy trial procedure by type of offense (2009)
5 Detention and bail
Table 2-3-2-7 Status of detention of defendants finally disposed in a court of first instance (2009)
Section 3 Summary Trial Procedure
Table 2-3-3-1 Number of persons finally disposed through the summary trial procedure by type of offense and judgment (2009)
Section 4 Appeals
Table 2-3-4-1 Number of persons finally disposed in Koso appeal trials by type of offense and judgment (2009)
Chapter 4 Correction of Adult Offenders
Section 1 Imprisonment in Penal Institutions
1 Number of persons imprisoned in penal institutions
Fig. 2-4-1-1 Number of persons imprisoned in penal institutions and rate per population (1990-2009)
2 Occupancy rate in penal institutions
Fig. 2-4-1-2 Occupancy rate at penal institutions (1990-2009)
3 Number of new inmates
Fig. 2-4-1-3 Number of new inmates and rate per population by gender (1990-2009)
Table 2-4-1-4 Number of inmates by reason for admission/release (2009)
4 Characteristics of new inmates
Fig. 2-4-1-5 Percent distribution of new inmates by gender and age group (2009)
Fig. 2-4-1-6 Percent distribution of new inmates by type of offense (2009)
Fig. 2-4-1-7 Percent distribution of new inmates sentenced to imprisonment with work by term of imprisonment (2009)
Section 2 Administration, etc. of Penal Institutions
4 Maintenance of discipline and order
Table 2-4-2-1 Number of incidents that occurred at penal institutions (2009)
5 Appeal system
Table 2-4-2-2 Number of appeals filed by persons imprisoned (2005-2009)
Section 3 Treatment of Inmates, etc.
1 Overview of treatment
Fig. 2-4-3-1 Flow of treatment of inmates
Table 2-4-3-2 Number of inmates by classification and treatment index code
Chapter 5 Rehabilitation Services
Section 1 Parole
2 Number of parolees
Fig. 2-5-1-1 Number of released inmates and parole rate (1949-2009)
3 Rate of served terms of imprisonment
Fig. 2-5-1-2 Rate of served terms of imprisonment by parolees sentenced to imprisonment for a determinate term
4 Parole of life imprisonment inmates
Table 2-5-1-3 Number of life imprisonment inmates granted parole (2000-2009)
Section 2 Probation/Parole Supervision
1 Number of probationers/parolees, etc.
Fig. 2-5-2-1 Number of persons newly placed under probation/parole supervision and probation rate (1949-2009)
Fig. 2-5-2-2 Percent distribution of persons newly placed under probation/parole supervision by age group (2009)
Fig. 2-5-2-3 Percent distribution of persons newly placed under probation/parole supervision by supervision period (2009)
Fig. 2-5-2-4 Percent distribution of persons newly placed under probation/parole supervision by residential status (2009)
2 Treatment of probationers/parolees
Table 2-5-2-5 Designation of treatment categories of probationers/parolees (as of December 31, 2009)
4 Termination of probation/parole supervision
Fig. 2-5-2-6 Percent distribution of probationers/parolees whose probation/parole supervision terminated by reason (2009)
Fig. 2-5-2-7 Percent distribution of probationers/parolees by employment status at the commencement/termination of their probation/parole supervision (2009)
Section 3 Urgent Aftercare of Discharged Offenders
1 Urgent aid, etc. and aftercare of discharged offenders
Table 2-5-3-1 Status of implementation of urgent aid, etc. and urgent aftercare of discharged offenders by type of subject (2009)
2 Halfway houses
Fig. 2-5-3-2 Number of persons newly entrusted to halfway houses (1990-2009)
Section 5 Volunteer Probation Officers, Private Supporters/Support Organizations, and Crime Prevention Activities
1 Volunteer probation officers
Fig. 2-5-5-1 Number of volunteer probation officers, female rate, and their average age
Fig. 2-5-5-2 Percent distribution of volunteer probation officers by age group and occupation (as of January 1, 2010)
Chapter 6 International Cooperation in Criminal Justice
Section 2 Transnational Fugitives and Their Extradition
1 Transnational fugitives from Japan
Fig. 2-6-2-1 Number of transnational fugitives, etc. (2000-2009)
Table 2-6-2-2 Number of transnational fugitives, etc. by type of offense and nationality, etc.
2 Extradition of fugitive offenders, etc.
Table 2-6-2-3 Number of fugitive offenders extradited (2000-2009)
Section 3 Mutual Legal/Judicial Assistance in Criminal Matters
1 Assistance in investigations, etc.
Table 2-6-3-1 Number of requests made for legal assistance in investigations (2000-2009)
PART 3 Trends in Offenses by Specific Offenders and Their Treatment
Chapter 1 Foreign National Offenders
Section 2 Trends in Offenses
1 Penal code offenses
Fig. 3-1-2-1 Numbers of cases and persons cleared for non-traffic penal code offenses committed by foreign nationals (1980-2009)
Fig. 3-1-2-2 Percent distribution of cleared cases for non-traffic penal code offenses committed by visiting foreign nationals by type of offense (2009)
Fig. 3-1-2-3 Number of cleared cases for theft, etc. committed by visiting foreign nationals (2000-2009)
2 Special act offenses
Fig. 3-1-2-4 Numbers of cases and persons referred to public prosecutors for special act offenses committed by foreign nationals (1980-2009)
Fig. 3-1-2-5 Number of cases referred to public prosecutors for Immigration Control Act violations, etc. committed by visiting foreign nationals (2000-2009)
Section 3 Treatment
1 Disposition in public prosecutors offices
Fig. 3-1-3-1 Percent distribution by nationality, etc. of visiting foreign national suspects newly received by public prosecutors offices (2009)
Fig. 3-1-3-2 Number of visiting foreign national suspects finally disposed in public prosecutors offices (2000-2009)
Table 3-1-3-3 Number of foreign national suspects finally disposed in public prosecutors offices by type of offense (2009)
2 Disposition in courts
Fig. 3-1-3-4 Number of persons convicted (those sentenced to imprisonment with/without work) in cases requiring interpreters in a court of first instance (2000-2009)
3 Correction
Fig. 3-1-3-5 Number of new Class F inmates (1990-2009)
Chapter 2 Offenders Associated with Boryokudan (Organized Crime Groups)
Section 1 Trends with Boryokudan Members
Table 3-2-1-1 Number of Boryokudan members, etc. (2000-2009)
Section 2 Trends in Offenses
1 Persons cleared
Fig. 3-2-2-1 Number of Boryokudan members, etc. cleared (1980-2009)
Table 3-2-2-2 Number of Boryokudan members cleared by type of offense (2009)
2 Firearm offenses
Fig. 3-2-2-3 Number of violent confl ict incidents and the rate of firearm use (2000-2009)
Fig. 3-2-2-4 Number of firing incidents and persons killed (2000-2009)
Fig. 3-2-2-5 Number of cleared cases involving firearm use (2000-2009)
Fig. 3-2-2-6 Number of handguns seized (2000-2009)
Section 3 Treatment
1 Disposition in public prosecutors offices
Fig. 3-2-3-1 Prosecution rate of persons associated with Boryokudan by type of offense (2009)
2 Correction
Fig. 3-2-3-2 Number of new inmates associated with Boryokudan (1980-2009)
Fig. 3-2-3-3 Percent distribution of new inmates associated and not associated with Boryokudan by type of offense (2009)
Chapter 3 Drug Offenders
Section 1 Trends in Offenses
1 Stimulants Control Act violations
Fig. 3-3-1-1 Number of persons cleared for Stimulants Control Act violations (1951-2009)
Fig. 3-3-1-2 Number of persons cleared for Stimulants Control Act violations by age group (1980-2009)
Table 3-3-1-3 Number of persons cleared for Stimulants Control Act violations: number of for-profit offenders, number of Boryokudan members, etc. and number of foreign nationals (by nationality, etc.), by type of violation (2009)
2 Cannabis Control Act violations, etc.
Fig. 3-3-1-4 Number of persons cleared for Cannabis Control Act violations, etc. (1980-2009)
3 Poisonous and Deleterious Substances Control Act violations
Fig. 3-3-1-5 Number of persons referred for Poisonous and Deleterious Substances Control Act violations (1980-2009)
Section 2 Status of Regulations
1 Seizure of stimulants, etc.
Table 3-3-2-1 Amount of stimulants, etc. seized (2005-2009)
2 Implementation of the Act on Special Provisions for Narcotics
Fig. 3-3-2-2 Number of cleared cases for Act on Special Provisions for Narcotics violations and amount of money confiscated/collected in a court of first instance (2005- 2009)
Section 3 Treatment
1 Disposition in public prosecutors offices
Table 3-3-3-1 Prosecution rate for Stimulants Control Act violations, etc. (2009)
2 Disposition in courts
Fig. 3-3-3-2 Percent distribution of persons convicted for Stimulants Control Act violations in a court of first instance by term of imprisonment (1980-2009)
3 Correction
Fig. 3-3-3-3 Number of new inmates for Stimulants Control Act violations (1990-2009)
Fig. 3-3-3-4 Percent distribution of new inmates for Stimulants Control Act violations by age group (2009)
4 Probation/parole supervision
Fig. 3-3-3-5 Number of probationers/parolees for Stimulants Control Act violations newly placed under probation/parole supervision (1990-2009)
Chapter 4 Elderly Offenders
Section 1 Trends in Offenses
Fig. 3-4-1-1 Number of persons cleared for non-traffic penal code offenses by age group (1990-2009)
Fig. 3-4-1-2 Rate per population of persons cleared for non-traffic penal code offenses by age group (1990-2009)
Fig. 3-4-1-3 Percent distribution of elderly offenders cleared for non-traffic penal code offenses by gender and type of offense (2009)
Fig. 3-4-1-4 Number of elderly persons cleared by type of offense (1990-2009)
Section 2 Treatment
1 Disposition in public prosecutors offices
Fig. 3-4-2-1 Suspended prosecution rate for non-traffic penal code offenses by type of offense and age group (2009)
2 Correction
Fig. 3-4-2-2 Number of new elderly inmates by history of imprisonment (1990-2009)
Fig. 3-4-2-3 Percent distribution of new elderly inmates by gender and type of offense (2009)
3 Probation/parole supervision
Fig. 3-4-2-4 Number of elderly persons newly placed under probation/parole supervision and parole rate (2000-2009)
Chapter 5 Offenders with Mental Disorders
Section 1 Trends in Offenses
Table 3-5-1-1 Number of persons with mental disorders, etc. cleared for non-traffic penal code offenses by type of offense (2009)
Section 2 Status of Criminal Proceedings
2 Correction
Table 3-5-2-1 Number of new inmates in penal institutions and juveniles newly admitted to juvenile training schools diagnosed as having a mental disorder (2009)
Section 3 The Act on Medical Care and Treatment for Insane Persons, etc.
Fig. 3-5-3-1 Flow of procedures under the Act on Medical Care and Treatment for Insane Persons, etc.
1 Hearing
Fig. 3-5-3-2 Number of persons for whom public prosecutors applied for hearings / finally disposed at district court hearings (2005-2009)
Table 3-5-3-3 Number of persons for whom public prosecutors applied for hearings and number of persons finally disposed at district court hearings by type of designated act (2009)
Chapter 6 Repeat Offenders
Section 1 Clearance
1 Repeat offenders cleared for non-traffic penal code offenses
Fig. 3-6-1-1 Number of repeat offenders cleared for non-traffic penal code offenses and rate of repeat offenders (1989-2009)
2 Previously convicted adults cleared for non-traffic penal code offenses
Fig. 3-6-1-2 Number and rate of previously convicted adults cleared for non-traffic penal code offenses (1989-2009)
Section 2 Prosecution/Trial
1 Previously convicted persons among those prosecuted
Table 3-6-2-1 Number of previously convicted persons/rate of previously convicted persons/ status at the time of the offense among persons prosecuted by type of offense (2009)
2 Revocation of suspension of execution of the sentence
Table 3-6-2-2 Number of persons who were granted suspension of execution of the sentence/ who had their suspension of execution of the sentence revoked, etc. (1989-2009)
Section 3 Correction
1 Reimprisoned inmates
Fig. 3-6-3-1 Number and rate of first-time inmates / reimprisoned inmates (total/females) (1989-2009)
2 Reimprisonment of released inmates
Fig. 3-6-3-2 Cumulative percentage of reimprisonment of released inmates by reason for release
Fig. 3-6-3-3 Cumulative percentage of reimprisonment of released inmates by history of imprisonment
3 Employment status
Fig. 3-6-3-4 Percent distribution of new inmates by employment status and history of imprisonment (cumulative total of 2005-2009)
Section 4 Probation/Parole Supervision
1 Status of probationers/parolees
Fig. 3-6-4-1 Number of persons newly placed under probation/parole supervision by history of criminal disposition and rate of previously convicted persons (2000-2009)
2 Redisposition, etc. of probationers/parolees
Table 3-6-4-2 Redisposition rate, revocation rate, etc. of persons whose probation/parole supervision terminated
Table 3-6-4-3 Revocation of parole/suspension of execution of the sentence with probation
PART 4 Trends in Juvenile Delinquency and Treatment of Juvenile Delinquents
Chapter 1 Trends in Juvenile Delinquency
Section 1 Penal Code Offences Committed by Juveniles
1 Juveniles cleared
Fig. 4-1-1-1 Number of juveniles cleared for penal code offenses / non-traffic penal code offenses and rate per population
2 Trends by attribute
Fig. 4-1-1-2 Number of juveniles cleared for non-traffic penal code offenses and rate per population by age group (1966-2009)
Fig. 4-1-1-3 Delinquency rate of juveniles
Fig. 4-1-1-4 Number of juveniles cleared for non-traffic penal code offenses and rate per population by gender (1966-2009)
Fig. 4-1-1-5 Percent distribution of juveniles cleared for non-traffic penal code offenses by educational/employment status (2009)
3 Trends by type of offense
Table 4-1-1-6 Number of juveniles cleared for non-traffic penal code offenses by type of offense and gender, and juvenile rate (2009)
4 Complicity cases
Table 4-1-1-7 Complicity rate in cleared cases for non-traffic penal code offenses involving juveniles only by type of offense (2009)
Section 2 Special Act Offences Committed by Juveniles
1 Number of juveniles referred to public prosecutors
Fig. 4-1-2-1 Number of juveniles referred to public prosecutors for special act offenses (1956-2009)
2 Drug offenses
Fig. 4-1-2-2 Number of juveniles referred to public prosecutors for Stimulants Control Act violations, etc. (1975-2009)
3 Traffic offenses
Fig. 4-1-2-3 Percent distribution of notified/referred cases for violations of road traffic related acts committed by juveniles by type of violation (2009)
Fig. 4-1-2-4 Number of hot rodders and hot rodder groups (2000-2009)
Section 3 Pre-delinquents
Fig. 4-1-3-1 Number of pre-delinquents finally disposed in family courts by type of predelinquency and female rate (1969-2009)
Section 4 Delinquency at Home and at School
1 Domestic violence
Fig. 4-1-4-1 Number of reported cases for domestic violence committed by juveniles by educational/employment status (2000-2009)
Chapter 2 Treatment of Juvenile Delinquents
Section 1 Overview
Fig. 4-2-1-1 Flow of treatment procedure for juvenile delinquents
Section 2 Disposition of Juvenile Cases at Public Prosecutors Offices and Courts
1 Public prosecutors offices (until referral to a family court)
Fig. 4-2-2-1 Number of juvenile offenders newly received by public prosecutors offices and rate per population by age group (1975-2009)
2 Family courts
Fig. 4-2-2-2 Number of juveniles newly received by family courts for juvenile protection cases (1949-2009)
Fig. 4-2-2-3 Percent distribution of juveniles finally disposed in family courts for juvenile protection cases by type of disposition (2009)
Table 4-2-2-4 Number of juveniles finally disposed in family courts for cases which should be in principle referred to public prosecutors for prosecution by type of offense (2009)
Section 3 Classification in Juvenile Classification Homes
1 Admission and discharge
Fig. 4-2-3-1 Number of juveniles newly admitted to juvenile classification homes by gender (1949-2009)
Fig. 4-2-3-2 Percent distribution of juveniles detained in juvenile classification homes by age group and gender (1990-2009)
Fig. 4-2-3-3 Percent distribution of juveniles detained in juvenile classification homes by type of delinquency, gender, and age group (2009)
Fig. 4-2-3-4 Percent distribution of juveniles discharged from juvenile classification homes by reason for discharge (2009)
2 Classification activities
Fig. 4-2-3-5 Flow of institutional classification in juvenile classification homes
Table 4-2-3-6 Status of disposition in family courts by category of classification determination (2009)
Section 4 Treatment at Juvenile Training Schools
1 Juveniles newly admitted to juvenile training schools
Fig. 4-2-4-1 Number of juveniles newly admitted to juvenile training schools by gender (1949-2009)
Fig. 4-2-4-2 Number of juveniles newly admitted to juvenile training schools and rate per population by age group (1975-2009)
Fig. 4-2-4-3 Percent distribution of juveniles newly admitted to juvenile training schools by type of delinquency, gender, and age group (2009)
Fig. 4-2-4-4 Percent distribution of juveniles newly admitted to juvenile training schools by educational level and gender (2009)
Fig. 4-2-4-5 Percent distribution of juveniles newly admitted to juvenile training schools by educational/employment status and gender (2009)
Fig. 4-2-4-6 Percent distribution of juveniles newly admitted to juvenile training schools by association with delinquent groups and gender (2009)
Fig. 4-2-4-7 Percent distribution of juveniles newly admitted to juvenile training schools by guardian status and gender (2009)
2 Treatment provided at juvenile training schools
Table 4-2-4-8 Number of juveniles newly admitted to juvenile training schools by type of juvenile training school and treatment program (2009)
Table 4-2-4-9 Number of juveniles newly admitted to juvenile training schools by treatment course, etc. (2009)
Fig. 4-2-4-10 Percent distribution of juveniles discharged from juvenile training schools by qualification or license obtained (2009)
3 Discharged juveniles
Fig. 4-2-4-11 Percent distribution of juveniles discharged from juvenile training schools by guarantor after discharge and gender (2009)
Section 5 Probation/Parole Supervision for Juveniles
1 Juvenile probationers/parolees
Fig. 4-2-5-1 Number of juveniles newly placed under probation/parole supervision (1949-2009)
Fig. 4-2-5-2 Percent distribution of juveniles newly placed under probation/parole supervision by age group (2009)
Fig. 4-2-5-3 Percent distribution of juveniles newly placed under probation/parole supervision by type of delinquency and gender (2009)
Fig. 4-2-5-4 Percent distribution of juveniles newly placed under probation/parole supervision by residential status (1990-2009)
Fig. 4-2-5-5 Percent distribution of juvenile probationers/parolees by educational/ employment status at the time of commencement/termination of their probation/ parole supervision (2009)
2 Treatment of juvenile probationers/parolees
Table 4-2-5-6 Designation of treatment categories of juvenile probationers/parolees (as of December 31, 2009)
4 Termination of probation/parole supervision for juveniles
Fig. 4-2-5-7 Percent distribution of juvenile probationers/parolees whose probation/parole supervision terminated by reason for termination (2009)
Chapter 3 Criminal Proceedings of Juveniles
Section 2 Prosecution and Criminal Trials
1 Disposition in public prosecutors offices
Table 4-3-2-1 Number of juveniles disposed in public prosecutors offices for cases referred from family courts by type of offense and type of disposition (2009)
2 Sentencing in a court of first instance
Table 4-3-2-2 Sentencing of juveniles in a court of first instance by type of offense and judgment (2009)
Section 3 Juvenile Inmates
Fig. 4-3-3-1 Number of juvenile inmates (1966-2009)
Chapter 4 Trends with Repeat Delinquencies and Juveniles with a History of Delinquency
1 Repeat delinquencies by juveniles
Fig. 4-4-1 Number and rate of juveniles with a history of delinquency cleared for non-traffic penal code offenses (1980-2009)
2 History of protective measures with juveniles placed under protective measures
Fig. 4-4-2 Percent distribution of juveniles placed under protective measures by history of protective measures (total/females) (2009)
Table 4-4-3 Number, etc. of juveniles placed under protective measures with/without a history of protective measures by type of delinquency (2009)
3 Status with the readmission, etc. of juveniles discharged from juvenile training schools
Table 4-4-4 Readmission, etc. of juveniles discharged from juvenile training schools (2000-2009)
4 Redisposition, etc. of juvenile probationers/juvenile training school parolees
Table 4-4-5 Redisposition rate of juvenile probationers/juvenile training school parolees (2000-2009)
Fig. 4-4-6 Percent distribution of juvenile probationers/juvenile training school parolees by reason for termination and education/employment status at the time of termination (2009)
5 History of protective measures for new inmates
Fig. 4-4-7 New inmates (first-time inmates/reimprisoned inmates) by age group and history of protective measures (2009)
Chapter 5 Trends and Treatment of Foreign National Juvenile Delinquents
1 Trends in foreign national juvenile offenders
Fig. 4-5-1 Number of foreign national juvenile offenders referred to family courts (1993-2009)
2 Treatment of foreign national juvenile delinquents
Fig. 4-5-2 Percent distribution of foreign national juveniles detained in juvenile classification homes by nationality, etc. (2009)
Fig. 4-5-3 Percent distribution of foreign national juveniles newly admitted to juvenile training schools by nationality, etc. (2009)
PART 5 Crime Victims
Chapter 1 Official Statistics on Damage Caused by Offenses
Section 1 Number of Cases Involving Human Victims
Fig. 5-1-1-1 Number of reported cases for non-traffic penal code offenses involving human victims and victim rate by gender (2000-2009)
Fig. 5-1-1-2 Percent distribution of victims of reported cases for non-traffic penal code offenses involving human victims by age group (2009)
Section 2 Bodily Damage
Table 5-1-2-1 Number of victims of non-traffic penal code offenses involving fatal/bodily damage and its rate per population (2000-2009)
Section 3 Property Damage
Table 5-1-3-1 Number of reported cases and amount of damages resulting from property offenses by type of offense (2000-2009)
Section 4 Damage Caused by Sexual Offenses
Table 5-1-4-1 Number of reported cases and victim rate for rape and forcible indecency (2000-2009)
Section 5 Relationship between Victims and Suspects
Fig. 5-1-5-1 Percent distribution of cleared cases by relationship between victim and suspect and type of offense (2009)
Section 6 Child Victims
1 Damages for penal code offenses
Table 5-1-6-1 Number of child victims younger than 13 resulting from penal code offenses by type of offense (2000-2009)
2 Child abuse
Table 5-1-6-2 Number of cases and persons cleared for cases concerning child abuse by type of offense (2000-2009)
Table 5-1-6-3 Number of persons cleared in cases concerning child abuse by relationship between the victim and perpetrator and type of offense (2009)
Chapter 2 Consideration for Victims in Criminal Justice
Section 1 Involvement of Victims in Criminal Proceedings
1 Appeal system against non-prosecution
Table 5-2-1-1 Number of persons received and disposed by the Committees for Inquest of Prosecution (2005-2009)
Table 5-2-1-2 Subsequent dispositions in cases decided as appropriate for prosecution or inappropriate for non-prosecution by reason of initial disposition of nonprosecution (2005-2009)
2 Victim participation, etc. at trials
Table 5-2-1-3 Status of implementation of systems for victims at the stage of trial (2005-2009)
PART 6 Criminal Justice System Reforms
Fig. 6-1-1 Overview of criminal justice system reforms
Section 2 Saiban-in (Lay Judge) System
1 Overview of Saiban-in system
Fig. 6-2-1 Flow of Saiban-in selection procedure
2 Implementation status of Saiban-in system
Table 6-2-2 Number of persons newly received and finally disposed in a court of first instance in cases subject to Saiban-in trials by type of offense (2009)
Table 6-2-3 Number of persons newly received in a court of first instance in cases subject to Saiban-in trials and Saiban-in selection rate by district court (2009)
Table 6-2-4 Selection status of Saiban-ins in cases subject to Saiban-in trials (2009)
Fig. 6-2-5 Percent distribution of cases subject to Saiban-in trials by number of trials and trial period (2009)
Table 6-2-6 Sentencing in a court of first instance in cases subject to Saiban-in trials by type of offense (2009)
PART 7 Actual Situation and Treatment concerning Serious Offenders
Chapter 1 Trends with Serious Offenses
Section 1 Occurrence/Clearance
1 Status of occurrence, etc.
Fig. 7-1-1-1 Number of reported cases and clearance rate by type of offense (1946-2009)
2 Victims
Table 7-1-1-2 Number of victims killed/injured by type of offense (2009, annual avarage between 1999-2008)
Fig. 7-1-1-3 Percent distribution of victims by age group and type of offense (2009)
Fig. 7-1-1-4 Number of cleared cases for serious offenses by relationship between suspects and victims, relative rate, and acquaintance rate by type of offense
Fig. 7-1-1-5 Number of cleared cases by type of relationship to victim (1980-2009)
3 Form of offense, etc.
Fig. 7-1-1-6 Number of persons cleared for robbery by form of offense (1990-2009)
Table 7-1-1-7 Number of reported cases for rape by place of occurrence (2009)
4 Complicity rate
Table 7-1-1-8 Complicity rate of cases committed by adults/juveniles by type of offense (2009, cumulative total of 1999-2008)
5 Persons cleared
Fig. 7-1-1-9 Number of persons cleared by age group and type of offense (1980-2009)
6 Employment rate
Table 7-1-1-10 Employment rate at the time of offense (2009, cumulative total of 1999-2008)
7 Boryokudan members, etc.
Fig. 7-1-1-11 Number of Boryokudan members, etc. cleared by type of offense (1989-2009)
8 Repeat offenders/previously convicted persons
Table 7-1-1-12 Number of cleared repeat offenders and rate of repeat offenders by type of offense (2009, cumulative total of 1999-2008)
Fig. 7-1-1-13 Percent distribution of cleared adults by history of previous convictions and type of offense (2009, cumulative total of 1999-2008)
Section 2 Prosecution/Trial
Fig. 7-1-2-1 Number of persons indicted, etc. by type of offense (1989-2009)
Fig. 7-1-2-2 Number of prosecuted first-time offenders/previously convicted persons and rate of previously convicted persons by type of offense (1989-2009)
Fig. 7-1-2-3 Sentencing in a court of first instance by type of offense (1989-2009)
Section 3 Correction
2 Reimprisoned inmates
Fig. 7-1-3-1 Number and rate of new first-time inmates / reimprisoned inmates and rate of reimprisoned inmates by type of offense (1989-2009)
Fig. 7-1-3-2 Percent distribution of new inmates by history of imprisonment and type of offense (2009, cumulative total of 1999-2008)
3 Reimprisonment status of released inmates
Fig. 7-1-3-3 Cumulative percentage of reimprisonment within 10 years of released inmates by reason for release and type of offense (2000)
Section 4 Probation/Parole Supervision
1 Parole
Fig. 7-1-4-1 Parole rate by type of offense (1996-2009)
Fig. 7-1-4-2 Percent distribution of parolees by parole supervision period and type of offense (2009, cumulative total of 1999-2008)
2 Probation/parole supervision
Fig. 7-1-4-3 Number of persons newly placed under probation/parole supervision by type of offense (2000-2009)
Table 7-1-4-4 Revocation rate, redisposition rate, and revocation/redisposition rate of probationers/parolees whose probation/parole supervision terminated by type of offense
Table 7-1-4-5 Period between the starting date of probation/parole supervision and the date of redisposition or revocation by type of offense (cumulative total of 2000-2009)
Fig. 7-1-4-6 Revocation/redisposition rate of probationers/parolees whose probation/parole supervision terminated by employment status and type of offense (2009)
Section 5 Juveniles
1 Trends in serious offenses committed by juveniles
Fig. 7-1-5-1 Number of juveniles cleared for homicide/robbery by age group (1954-2009)
2 Juveniles with a history of delinquency
Table 7-1-5-2 Number and rate of cleared juveniles with a history of delinquency by type of offense (2009, cumulative total of 1999-2008)
3 Juvenile protection cases involving serious offenses
Fig. 7-1-5-3 Percent distribution of juveniles finally disposed in family courts for juvenile protection cases by type of disposition and type of offense (2009)
4 History of protective measures for new inmates
Fig. 7-1-5-4 Percent distribution of new inmates by history of protective measures and type of offense (2009)
Chapter 2 Actual Situation concerning Serious Offenses and Repeat Offenses
Table 7-2-1 Distribution of research subjects by type of index offense
Table 7-2-2 Term of imprisonment of research subjects by type of index offense
Section 1 Circumstances involved in the Committing of a Serious Offense
1 Details of offenses
Fig. 7-2-1-1-1 Percent distribution by relationship to main victim and type of index offense
Table 7-2-1-1-2 Number of persons who committed homicide/injury causing death by main motive and relationship to main victim
Table 7-2-1-1-3 Number of persons that committed arson by main motive and main target
Fig. 7-2-1-1-4 Percent distribution with or without prior planning by type of index offense
Fig. 7-2-1-1-5 Percent distribution of use or no use of a weapon by type of index offense
Fig. 7-2-1-1-6 Percent distribution with or without having drunk alcohol before the offense by type of index offense
Fig. 7-2-1-1-7 Number of persons that committed robbery with or without an accomplice by form of offense
2 Attributes of research subjects, etc.
Table 7-2-1-2-1 Number of persons by employment status at the time of the offense and type of index offense
Table 7-2-1-2-2 Number of persons by previous conviction status and type of index offense
Fig. 7-2-1-2-3 Percent distribution by number of previous convictions and type of main victim
Table 7-2-1-2-4 Number of persons by status of out-of-court settlement and type of index offense
Section 2 Treatment
1 Treatment at penal institutions
Fig. 7-2-2-1 Percent distribution by number of disciplinary punishments and type of index offense
2 Treatment in parole supervision
Fig. 7-2-2-2 Percent distribution of parolees by guarantor and type of index offense
Fig. 7-2-2-3 Assignment status of special condition for parole supervision for parolees by type of index offense
Fig. 7-2-2-4 Percent distribution of parolees by employment status and type of index offense
Section 3 Repeat Offense Status
1 Overview of repeat offenses
Fig. 7-2-3-1-1 Repeat offense rate by type of index offense
Table 7-2-3-1-2 Number of persons by type of repeat offense and type of index offense
2 Analysis of repeat offense status
Fig. 7-2-3-2-1 Repeat offense rate for homicide, injury causing death, and arson by relationship to main victim
Fig. 7-2-3-2-2 Repeat offense rate for homicide, injury causing death, and arson by main motive
Fig. 7-2-3-2-3 Repeat offense rate for robbery and rape by complicity status
Fig. 7-2-3-2-4 Repeat offense rate for robbery by type of index offense
Fig. 7-2-3-2-5 Repeat offense rate for robbery that do or do not fall under constructive robbery
Fig. 7-2-3-2-6 Repeat offense rate by number of previous convictions and type of index offense
Fig. 7-2-3-2-7 Repeat offense rate for robbery by number of previous convictions
Fig. 7-2-3-2-8 Repeat offense rate for rape by type of previous conviction
Fig. 7-2-3-2-9 Age at the time of first conviction/index offense of previously convicted persons by type of index offense
Fig. 7-2-3-2-10 Percent distribution for robbery of previously convicted persons by number of previous convictions, repeat offense status, and age group
Fig. 7-2-3-2-11 Repeat offense rate of first-time/reimprisoned inmates by type of index offense
Fig. 7-2-3-2-12 Repeat offense rate by history of protective measures and type of index offense
Fig. 7-2-3-2-13 Percent distribution of first-time/reimprisoned inmates by history of protective measures and type of index offense
Fig. 7-2-3-2-14 Repeat offense rate by employment status during parole supervision period and type of index offense
Fig. 7-2-3-2-15 Repeat offense rate by problem at the time of the index offense for homicide, robbery, and arson
Fig. 7-2-3-2-16 Repeat offense rate by type of index offense and whether the person received a disciplinary punishment within one year before release
Fig. 7-2-3-2-17 Repeat offense rate by reason for release and type of index offense
Fig. 7-2-3-2-18 Repeat offense rate for robbery by parole supervision period
Fig. 7-2-3-2-19 Percent distribution by repeat offense period and type of index offense
Fig. 7-2-3-2-20 Repeat offense period by reason for release and repeat offense status
Fig. 7-2-3-2-21 Number of persons for robbery who repeated an offense in less than one year after release by repeat offense period, reason for release, and imprisonment history
3 Status of repeat serious offenses and short-term repeat offenses
Table 7-2-3-3-1 Status of repeat serious offenses by type of index offense
Appendix
Appendix 1-1 Number of reported cases, crime rate, number of cleared cases, clearance rate, and number of persons cleared for penal code offenses (1946-2009)
Table 1-1 Number of reported cases, crime rate, number of cleared cases, clearance rate, and number of persons cleared for penal code offenses (1946-2009)
Appendix 1-2 Number of reported cases, cleared cases, and persons cleared for penal code offenses by type of offense (2000-2009)
Table 1-2 Number of reported cases, cleared cases, and persons cleared for penal code offenses by type of offense (2000-2009)
Appendix 1-3 Clearance rate for penal code offenses by type of offense (2000-2009)
Table 1-3 Clearance rate for penal code offenses by type of offense (2000-2009)
Appendix 1-4 Number of persons newly received by public prosecutors offices for special act offenses by type of offense (2000-2009)
Table 1-4 Number of persons newly received by public prosecutors offices for special act offenses by type of offense (2000-2009)
Appendix 1-5 Number of traffic accidents and persons killed or injured, and rate of death/injury, etc. (1946-2009)
Table 1-5 Number of traffic accidents and persons killed or injured, and rate of death/injury, etc. (1946-2009)
Appendix 1-6 Sentencing of imprisonment with work for financial and economic offenses in the court of first instance (2007-2009)
Table 1-6 Sentencing of imprisonment with work for financial and economic offenses in the court of first instance (2007-2009)
Appendix 1-7 Number of reported cases and crime rate for major offenses in each country (1980-2008)
Table 1-7 Number of reported cases and crime rate for major offenses in each country (1980-2008)
Appendix 1-8 Number of reported cases and crime rate for homicide and theft in each country (1988-2008)
Table 1-8 Number of reported cases and crime rate for homicide and theft in each country (1988-2008)
Appendix 1-9 Clearance rate for major offenses, homicide, and theft in each country (1988-2008)
Table 1-9 Clearance rate for major offenses, homicide, and theft in each country (1988-2008)
Appendix 2-1 Number of persons newly received by public prosecutors offices by type of offense (2005-2009)
Table 2-1 Number of persons newly received by public prosecutors offices by type of offense (2005-2009)
Appendix 2-2 Number of persons finally disposed in public prosecutors offices by type of offense and type of disposition (2000-2009)
Table 2-2 Number of persons finally disposed in public prosecutors offices by type of offense and type of disposition (2000-2009)
Appendix 2-3 Prosecution rate and suspended prosecution rate by type of offense (2005-2009)
Table 2-3 Prosecution rate and suspended prosecution rate by type of offense (2005-2009)
Appendix 2-4 Sentencing of death penalty and imprisonment with or without work in district courts by type of offense (2009)
Table 2-4 Sentencing of death penalty and imprisonment with or without work in district courts by type of offense (2009)
Appendix 2-5 Average daily number of persons imprisoned in penal institutions (1950-2009)
Table 2-5 Average daily number of persons imprisoned in penal institutions (1950-2009)
Appendix 2-6 Number of new inmates by type of offense and gender (2009)
Table 2-6 Number of new inmates by type of offense and gender (2009)
Appendix 2-7 Number of reimprisoned inmates by type of offense and gender (2009)
Table 2-7 Number of reimprisoned inmates by type of offense and gender (2009)
Appendix 2-8 Number of new inmates by history of Imprisonment and type of offense (2009)
Table 2-8 Number of new inmates by history of Imprisonment and type of offense (2009)
Appendix 2-9 Number of reimprisoned inmates by repeat offense period and type of previous offense (2009)
Table 2-9 Number of reimprisoned inmates by repeat offense period and type of previous offense (2009)
Appendix 2-10 Number of inmates sentenced to imprisonment with work at the end of each year by term of imprisonment (1957-2009)
Table 2-10 Number of inmates sentenced to imprisonment with work at the end of each year by term of imprisonment (1957-2009)
Appendix 2-11 Number of persons for whom parole examinations were instigated or parole was granted, etc. (1949-2009)
Table 2-11 Number of persons for whom parole examinations were instigated or parole was granted, etc. (1949-2009)
Appendix 2-12 Number of persons newly placed under probation/parole supervision (1949-2009)
Table 2-12 Number of persons newly placed under probation/parole supervision (1949-2009)
Appendix 2-13 Number of persons newly placed under probation/parole supervision by type of offense and gender (2009)
Table 2-13 Number of persons newly placed under probation/parole supervision by type of offense and gender (2009)
Appendix 3-1 Number of cases and persons cleared for non-traffic penal code offenses committed by foreign nationals (1980-2009)
Table 3-1 Number of cases and persons cleared for non-traffic penal code offenses committed by foreign nationals (1980-2009)
Appendix 3-2 Number of cases and persons referred to public prosecutors for special act offenses committed by foreign nationals (1980-2009)
Table 3-2 Number of cases and persons referred to public prosecutors for special act offenses committed by foreign nationals (1980-2009)
Appendix 3-3 Number of foreign nationals finally disposed in public prosecutors offices (1990-2009)
Table 3-3 Number of foreign nationals finally disposed in public prosecutors offices (1990-2009)
Appendix 3-4 Number of visiting foreign nationals finally disposed in public prosecutors offices by type of offense (2009)
Table 3-4 Number of visiting foreign nationals finally disposed in public prosecutors offices by type of offense (2009)
Appendix 3-5 Number of new Class F inmates by nationality, etc. (2007-2009)
Table 3-5 Number of new Class F inmates by nationality, etc. (2007-2009)
Appendix 3-6 Number of foreign nationals newly placed under probation/parole supervision by nationality, etc. (2007-2009)
Table 3-6 Number of foreign nationals newly placed under probation/parole supervision by nationality, etc. (2007-2009)
Appendix 3-7 Number of persons finally disposed in public prosecutors offices for Stimulants Control Act violations, etc. (2000-2009)
Table 3-7 Number of persons finally disposed in public prosecutors offices for Stimulants Control Act violations, etc. (2000-2009)
Appendix 4-1 Number of juveniles and adults cleared for penal code offenses, rate per population, and juvenile rate (1946-2009)
Table 4-1 Number of juveniles and adults cleared for penal code offenses, rate per population, and juvenile rate (1946-2009)
Appendix 4-2 Number of juveniles cleared for non-traffic penal code offenses and rate per population by age group (1966-2009)
Table 4-2 Number of juveniles cleared for non-traffic penal code offenses and rate per population by age group (1966-2009)
Appendix 4-3 Number of juveniles cleared for penal code offenses by type of offense (1946-2009)
Table 4-3 Number of juveniles cleared for penal code offenses by type of offense (1946-2009)
Appendix 4-4 Number of juvenile offenders under 14 guided by the police for non-traffic penal code offenses by type of delinquency (1946-2009)
Table 4-4 Number of juvenile offenders under 14 guided by the police for non-traffic penal code offenses by type of delinquency (1946-2009)
Appendix 4-5 Number of juveniles cleared for non-traffic penal code offenses by gender, age group, and type of offense (2009)
Table 4-5 Number of juveniles cleared for non-traffic penal code offenses by gender, age group, and type of offense (2009)
Appendix 4-6 Number of juveniles referred to public prosecutors for special act offenses by type of offense (1956-2009)
Table 4-6 Number of juveniles referred to public prosecutors for special act offenses by type of offense (1956-2009)
Appendix 4-7 Number of pre-delinquents finally disposed in family courts by type of predelinquency (1969-2009)
Table 4-7 Number of pre-delinquents finally disposed in family courts by type of predelinquency (1969-2009)
Appendix 4-8 Number of juvenile offenders newly received by public prosecutors offices by type of offense and age group (2004-2009)
Table 4-8 Number of juvenile offenders newly received by public prosecutors offices by type of offense and age group (2004-2009)
Appendix 4-9 Percent distribution of opinions by public prosecutors and final dispositions in family courts by age group (2009)
Table 4-9 Percent distribution of opinions by public prosecutors and final dispositions in family courts by age group (2009)
Appendix 4-10 Number of juveniles finally disposed in family courts for juvenile protection cases by type of delinquency and type of disposition (1975, 1985, 2005-2009)
Table 4-10 Number of juveniles finally disposed in family courts for juvenile protection cases by type of delinquency and type of disposition (1975, 1985, 2005-2009)
Appendix 4-11 Number of juveniles newly admitted to juvenile classification homes and average daily number of juvenile inmates by gender (1949-2009)
Table 4-11 Number of juveniles newly admitted to juvenile classification homes and average daily number of juvenile inmates by gender (1949-2009)
Appendix 4-12 Number of juveniles newly admitted to juvenile training schools by gender and type of treatment program (1949-2009)
Table 4-12 Number of juveniles newly admitted to juvenile training schools by gender and type of treatment program (1949-2009)
Appendix 4-13 Number of juveniles newly admitted to juvenile training schools by type of delinquency (2002-2009)
Table 4-13 Number of juveniles newly admitted to juvenile training schools by type of delinquency (2002-2009)
Appendix 5-1 Application and payment of crime victim benefits (FY 1998-2009)
Table 5-1 Application and payment of crime victim benefits (FY 1998-2009)
Appendix 6-1 Chronological Table of “Criminal Justice System Reform”
Table 6-1 Chronological Table of “Criminal Justice System Reform”

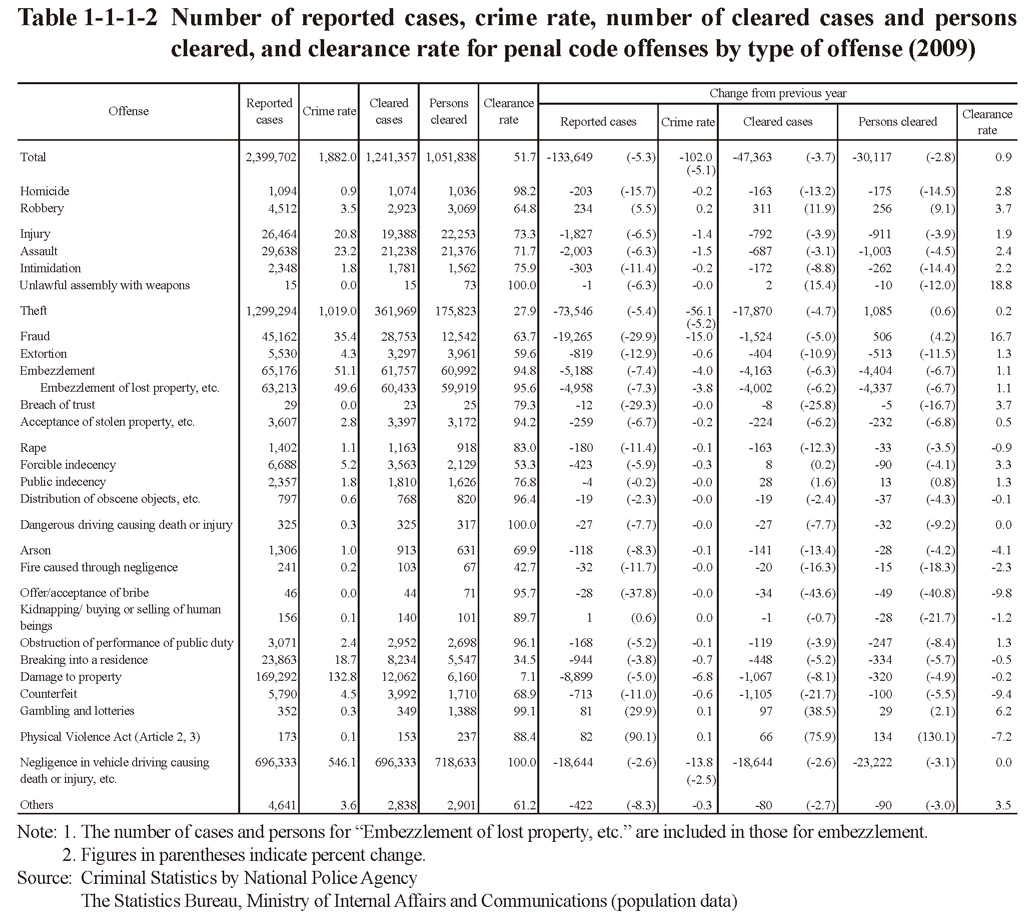
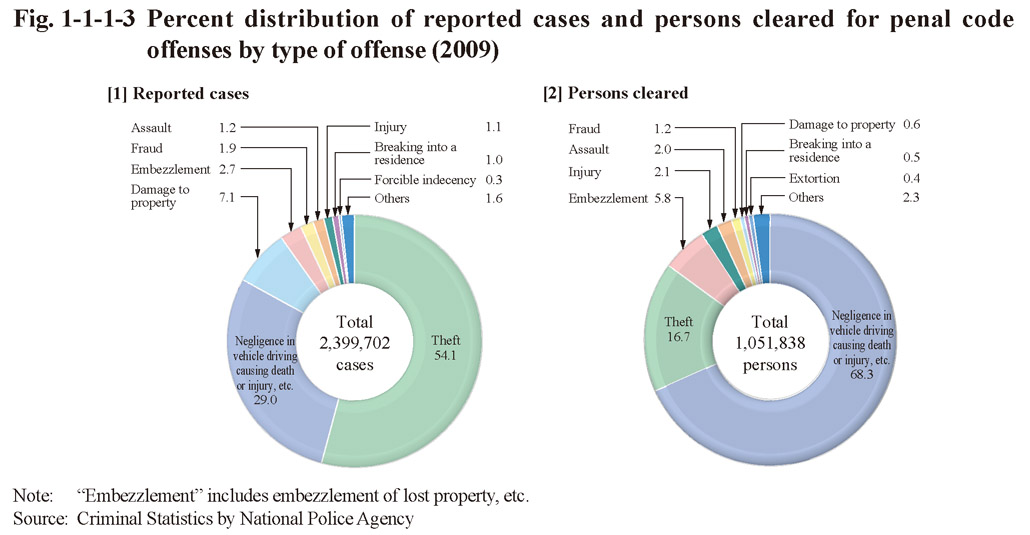
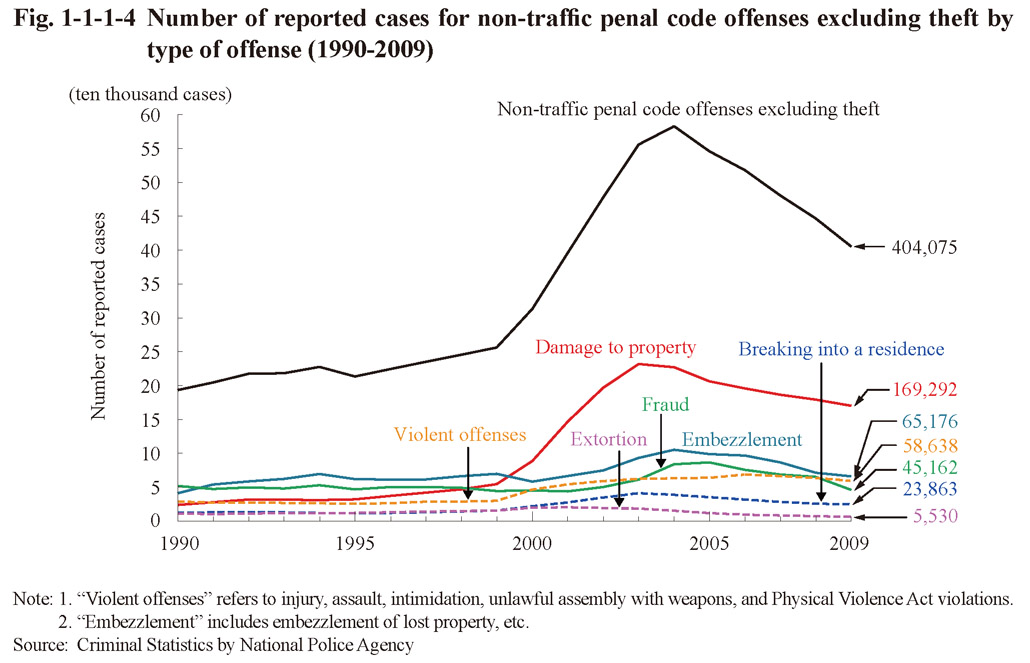
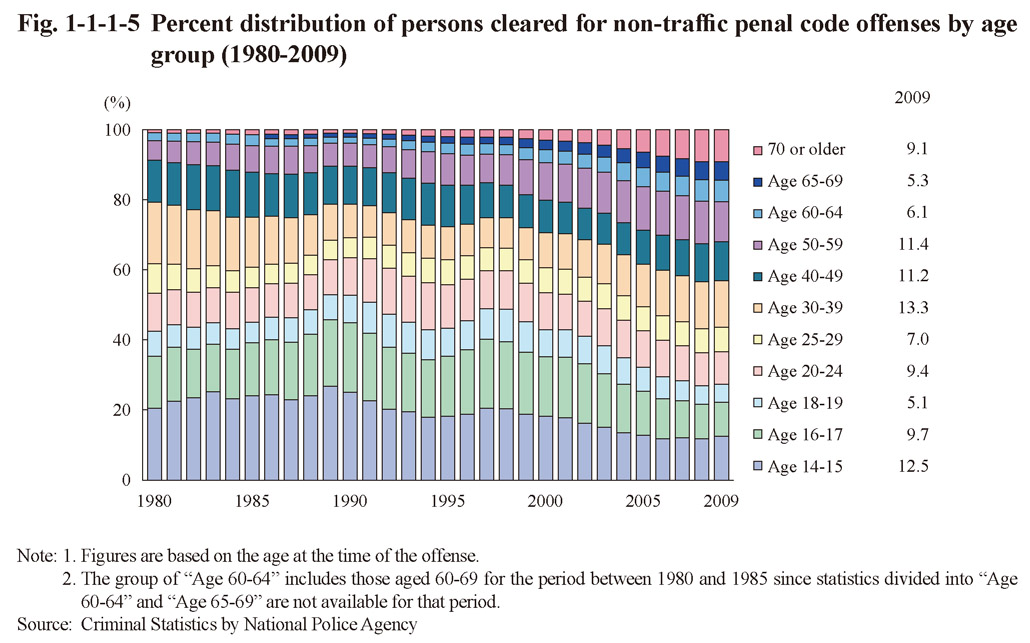
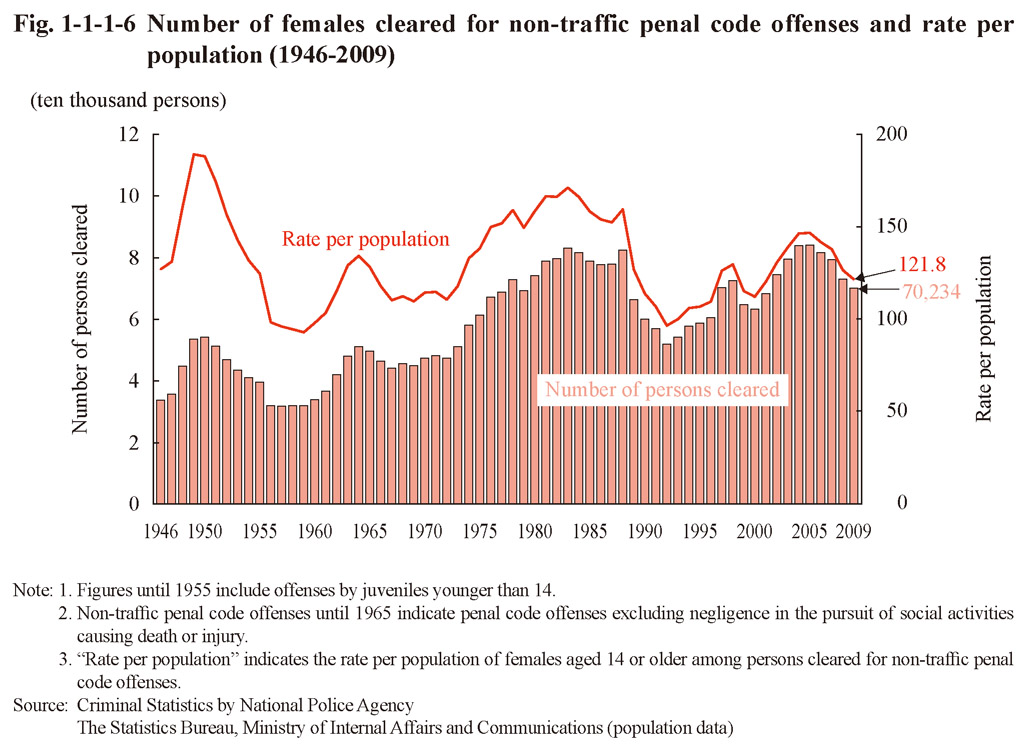
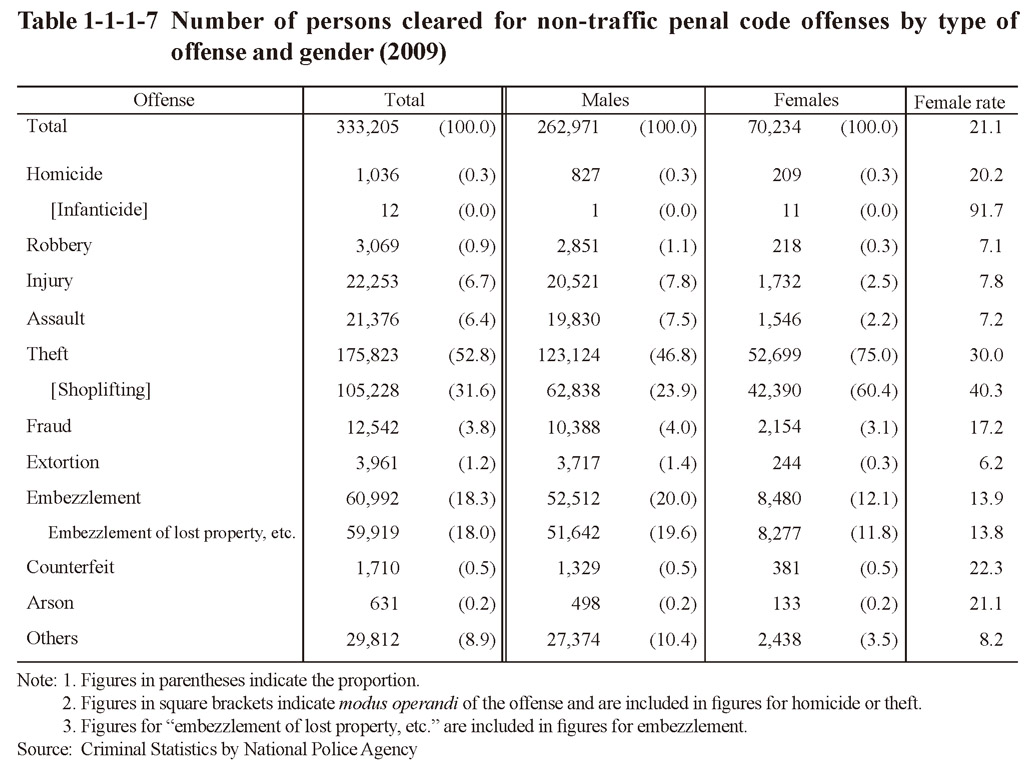
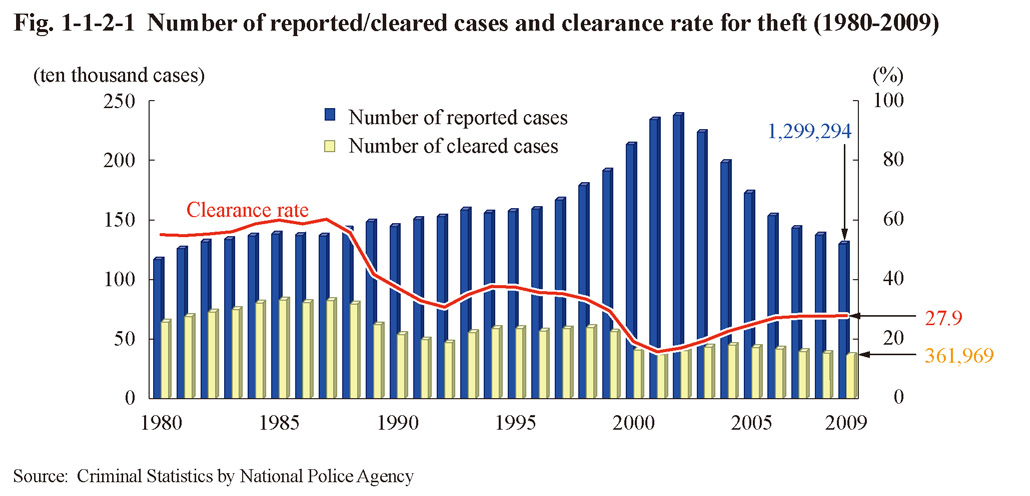 Fig. 1-1-2-1 Number of reported/cleared cases and clearance rate for theft (1980-2009)
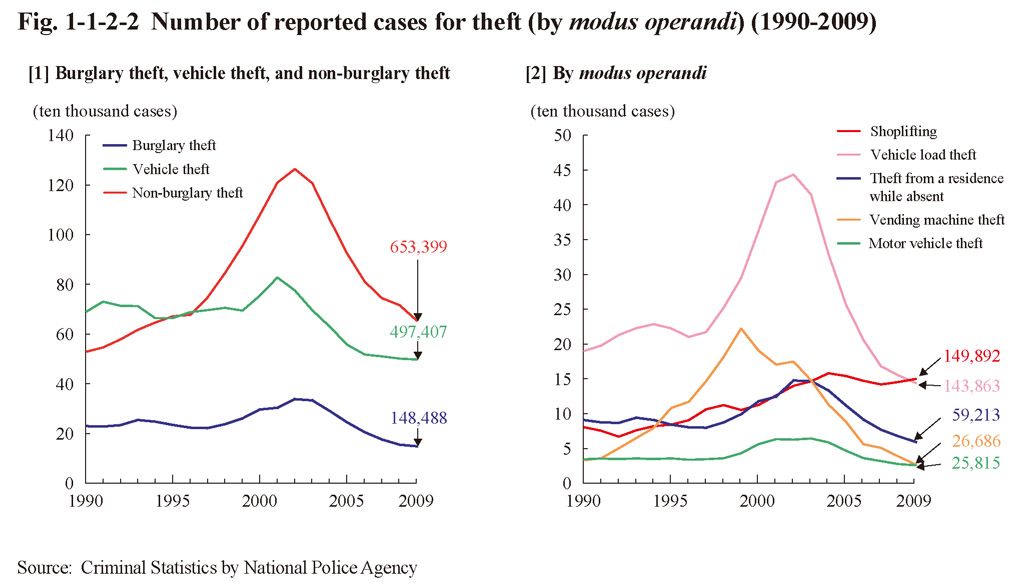 Fig. 1-1-2-2 Number of reported cases for theft (by modus operandi) (1990-2009)
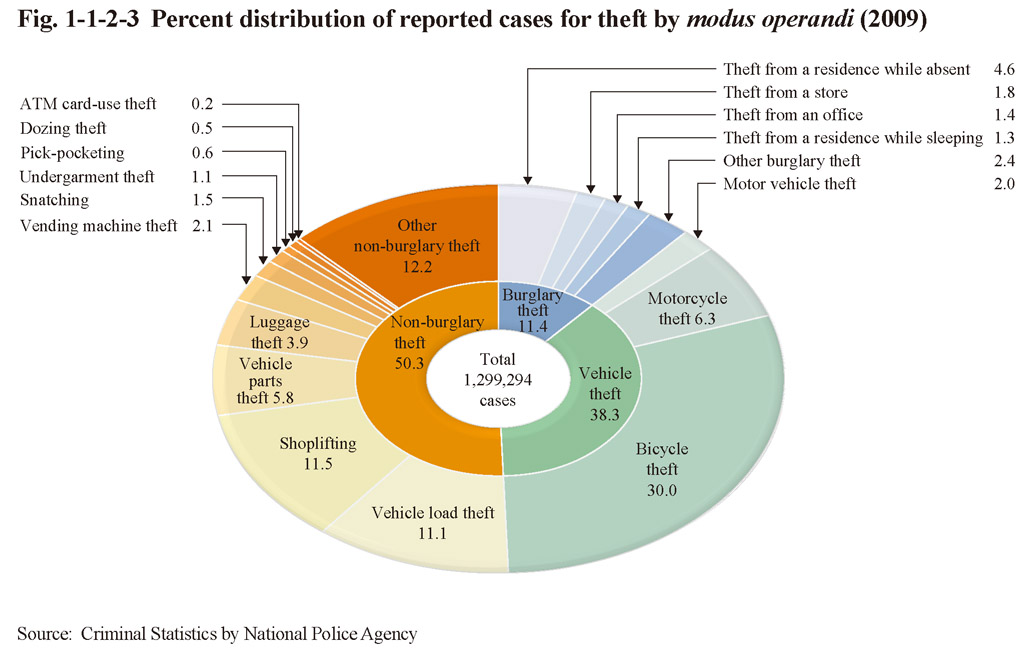 Fig. 1-1-2-3 Percent distribution of reported cases for theft by modus operandi (2009)
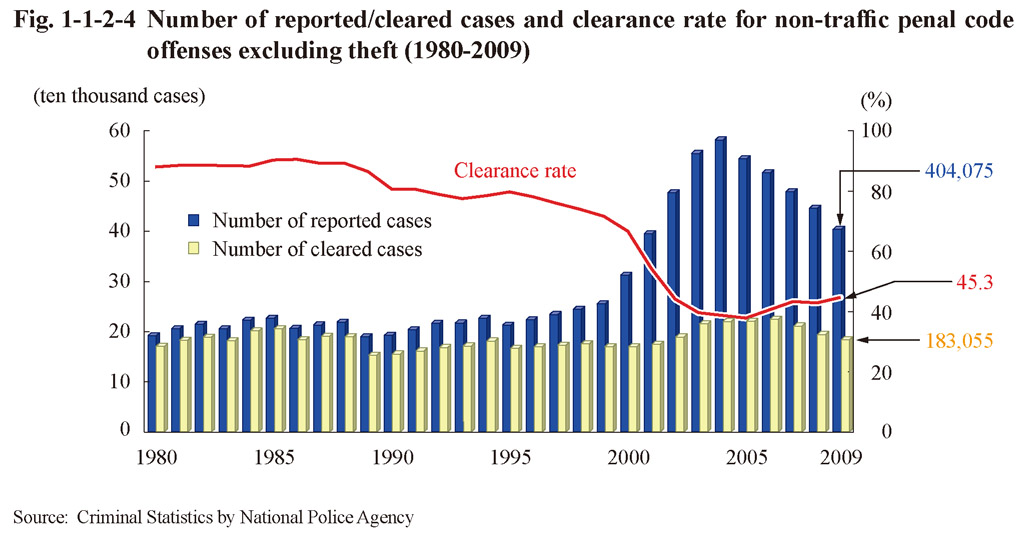
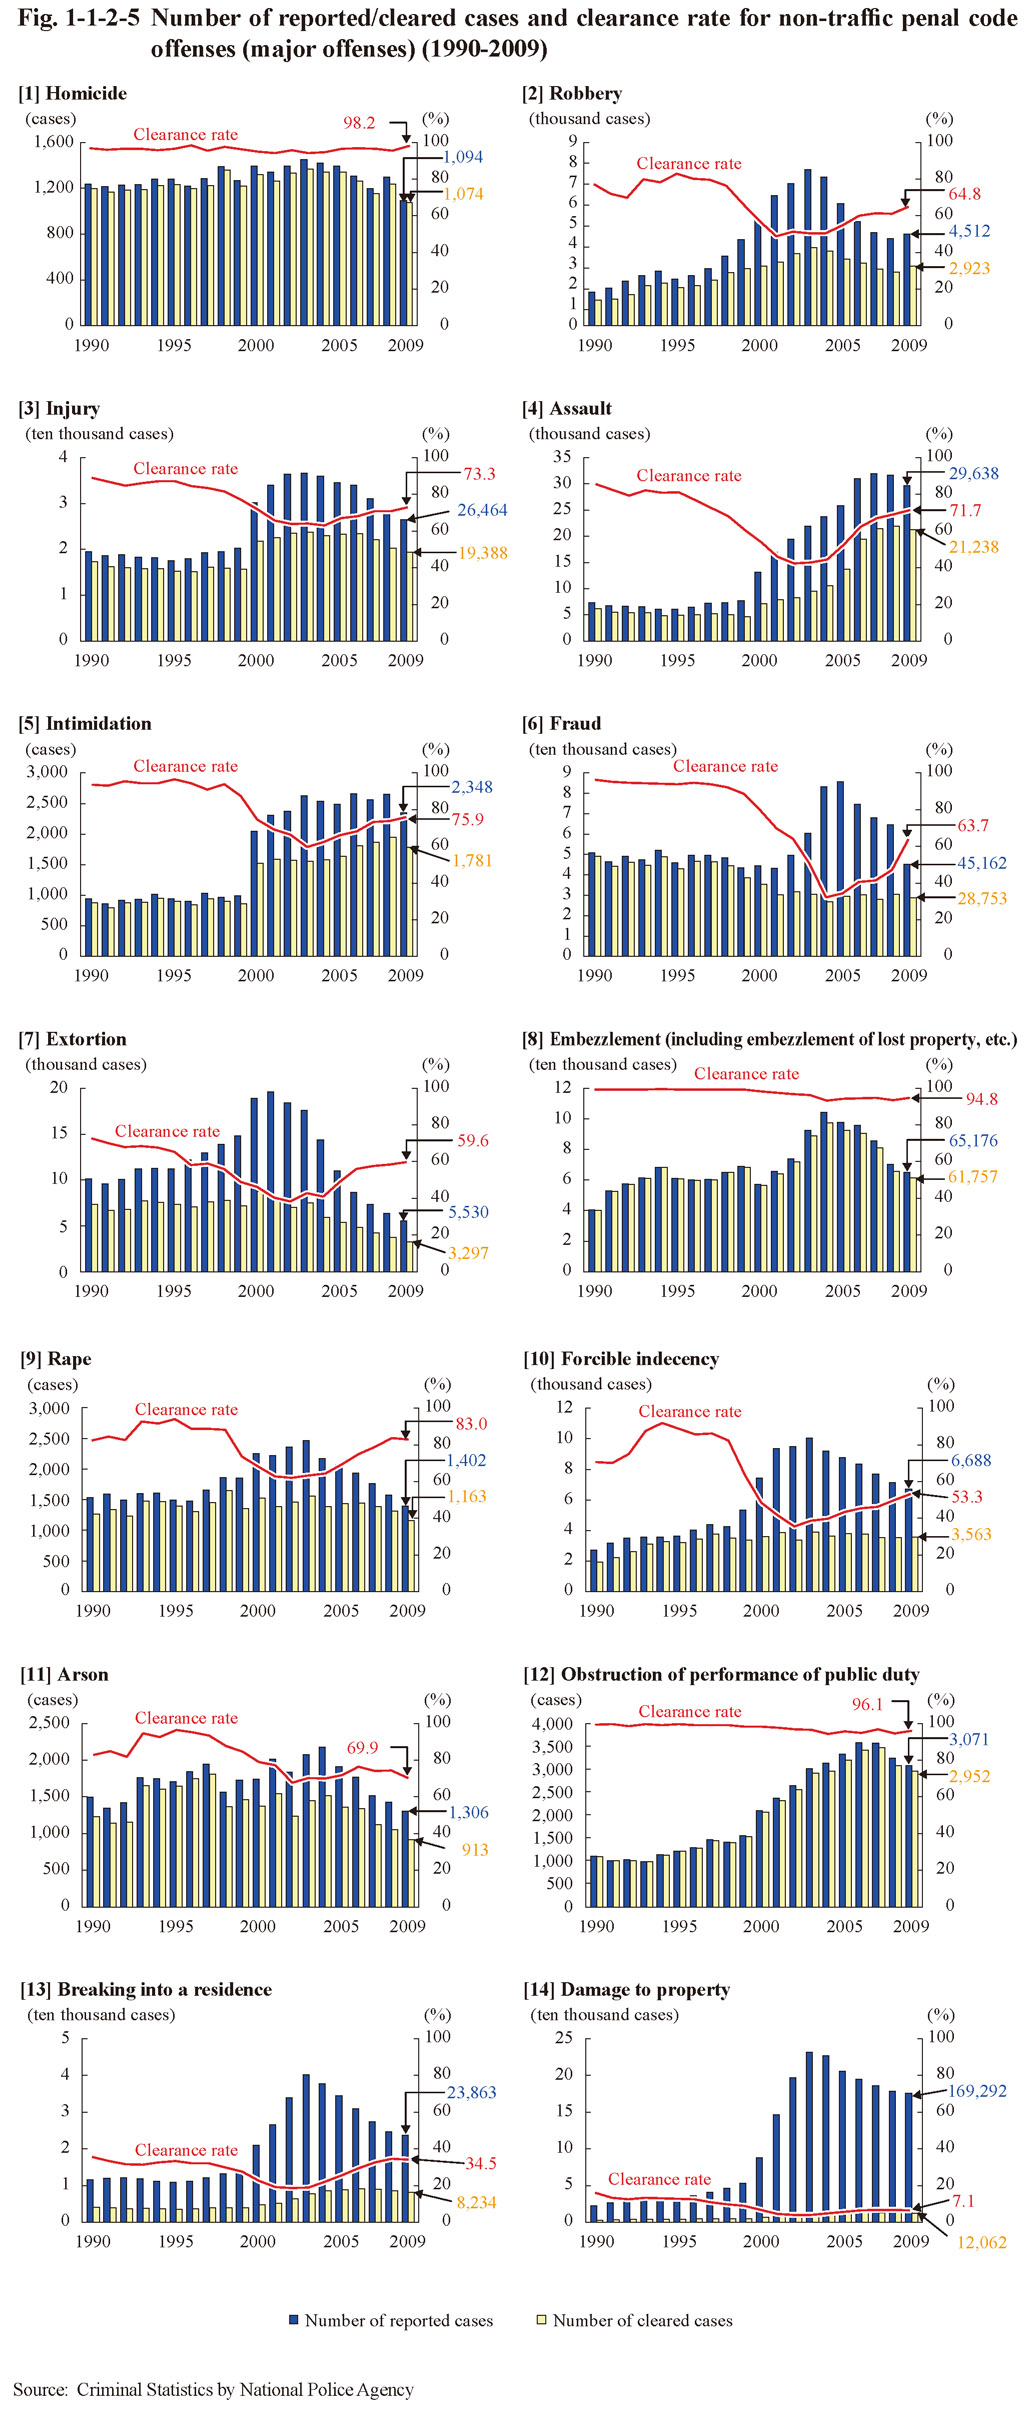
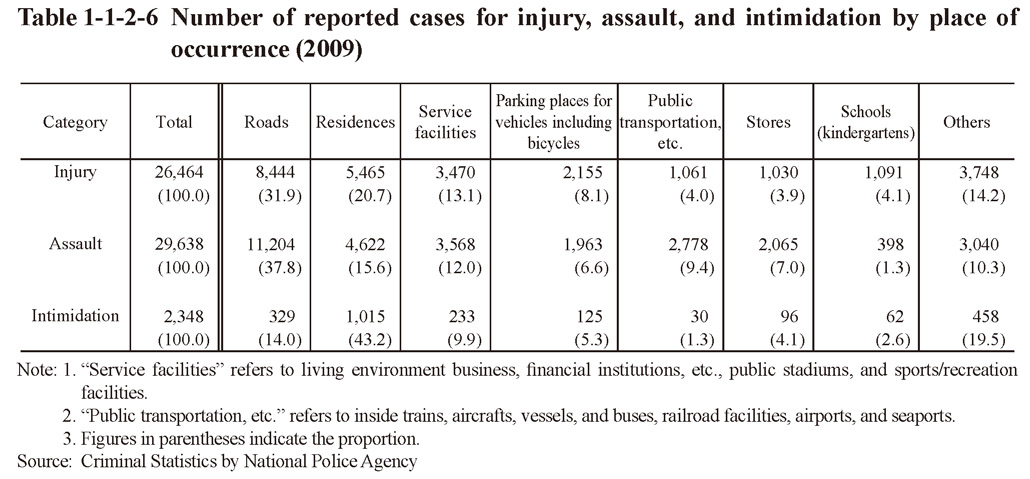
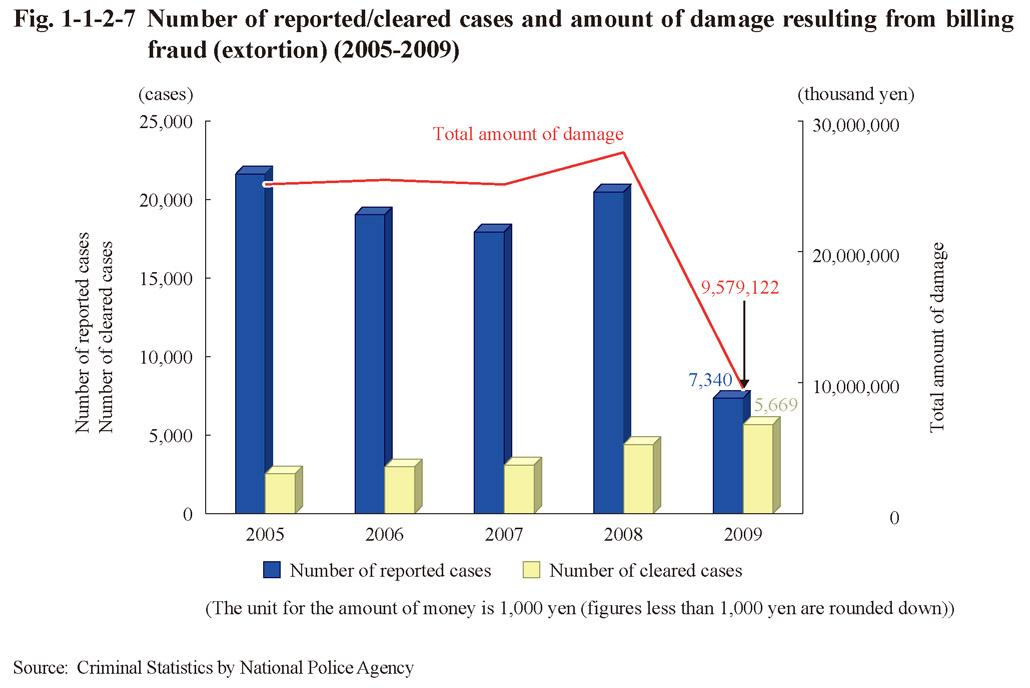
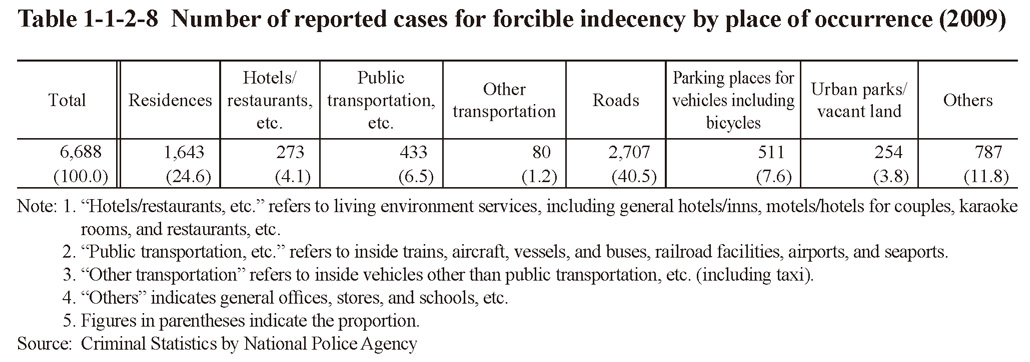 Table 1-1-2-8 Number of reported cases for forcible indecency by place of occurrence (2009)
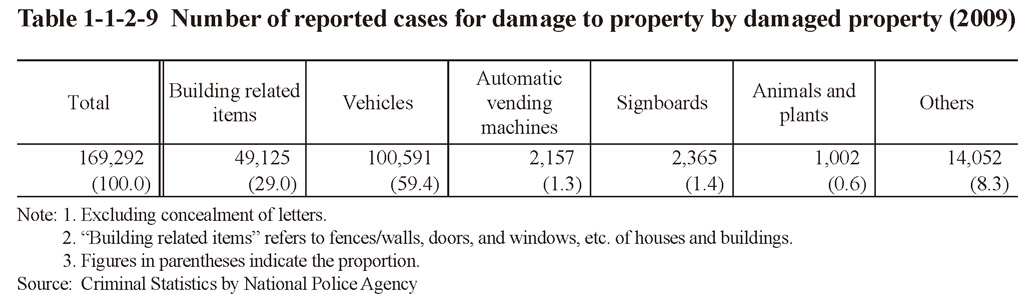 Table 1-1-2-9 Number of reported cases for damage to property by damaged property (2009)
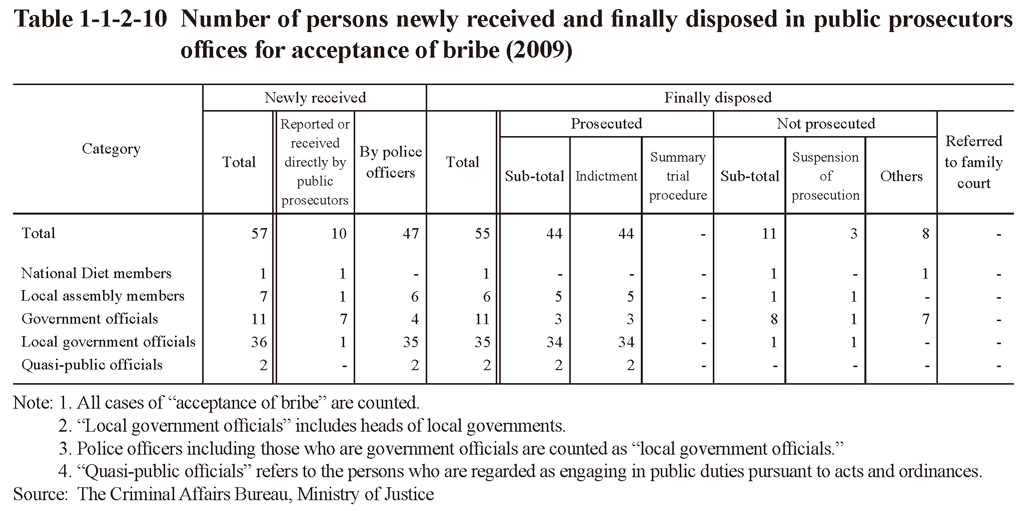


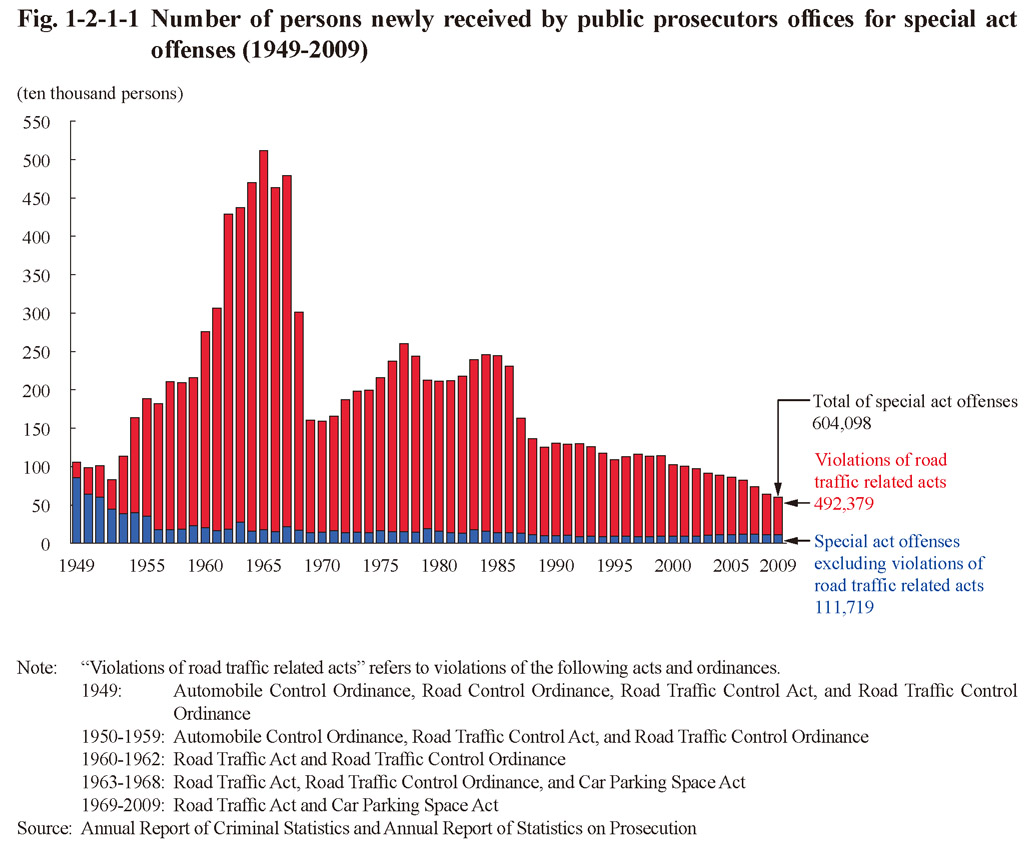
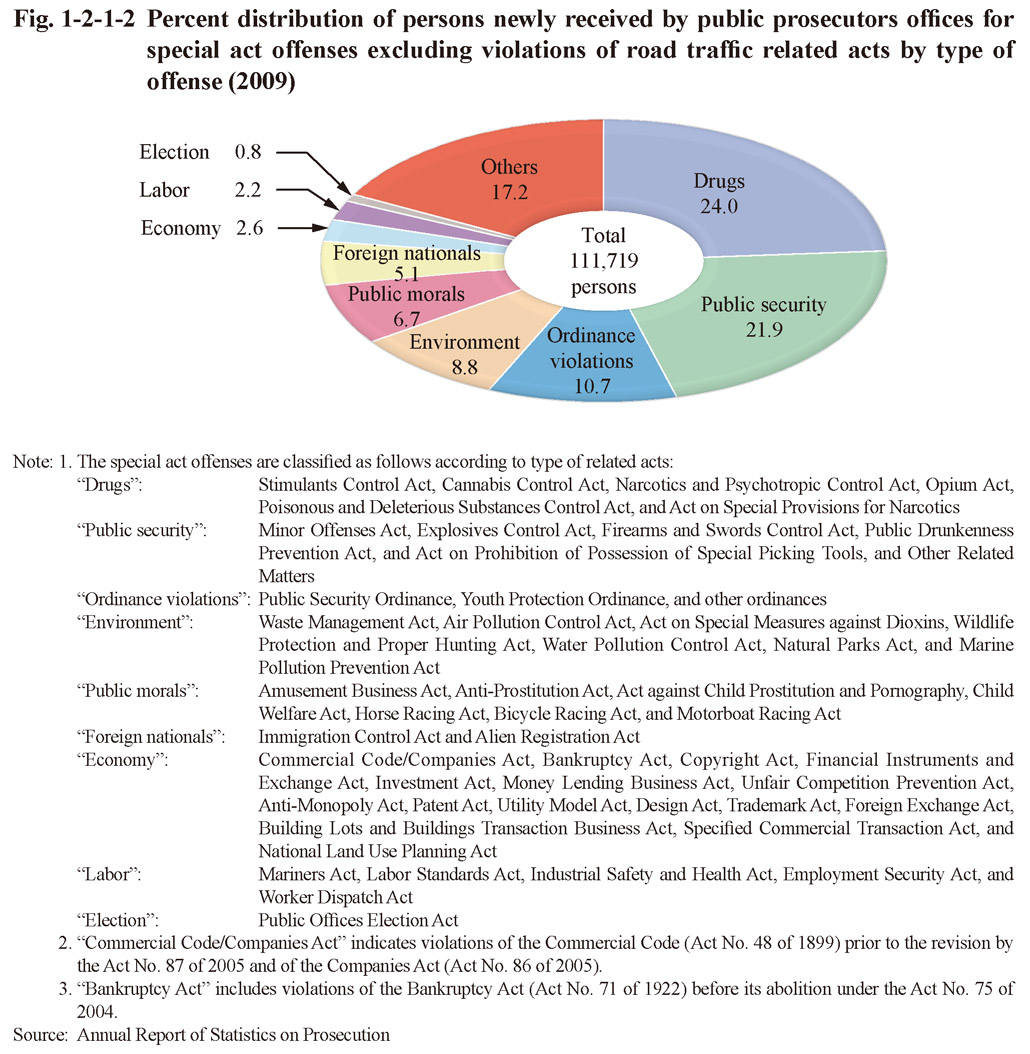
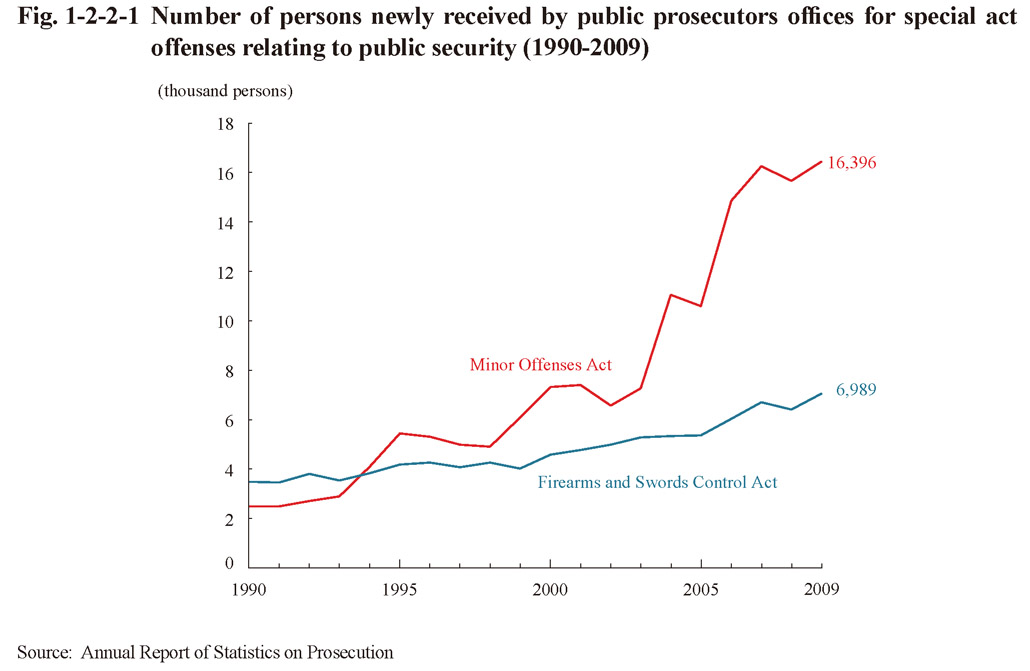
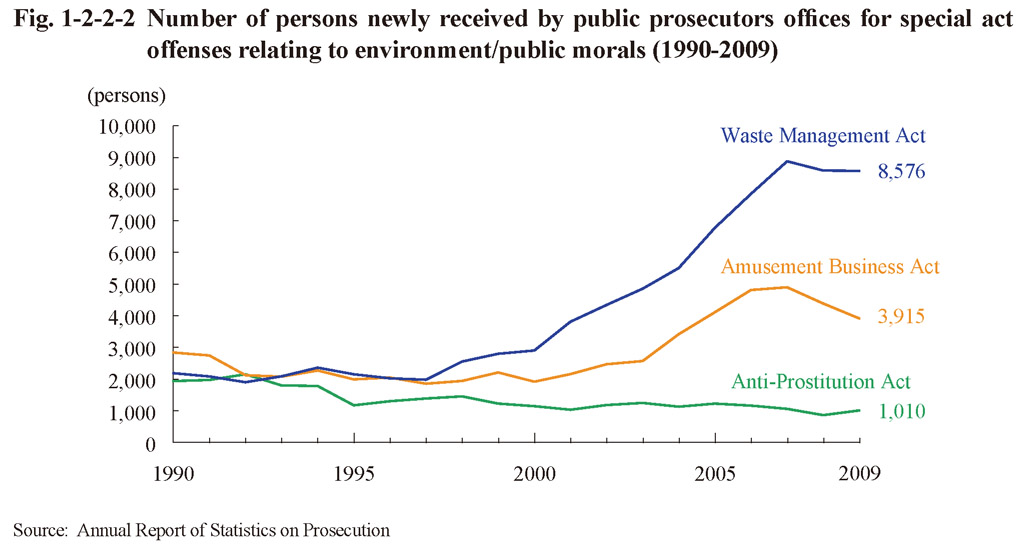


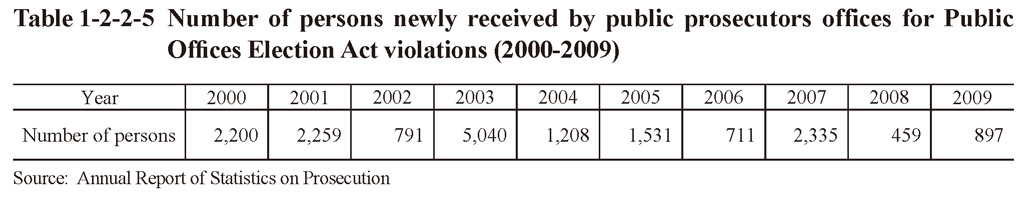
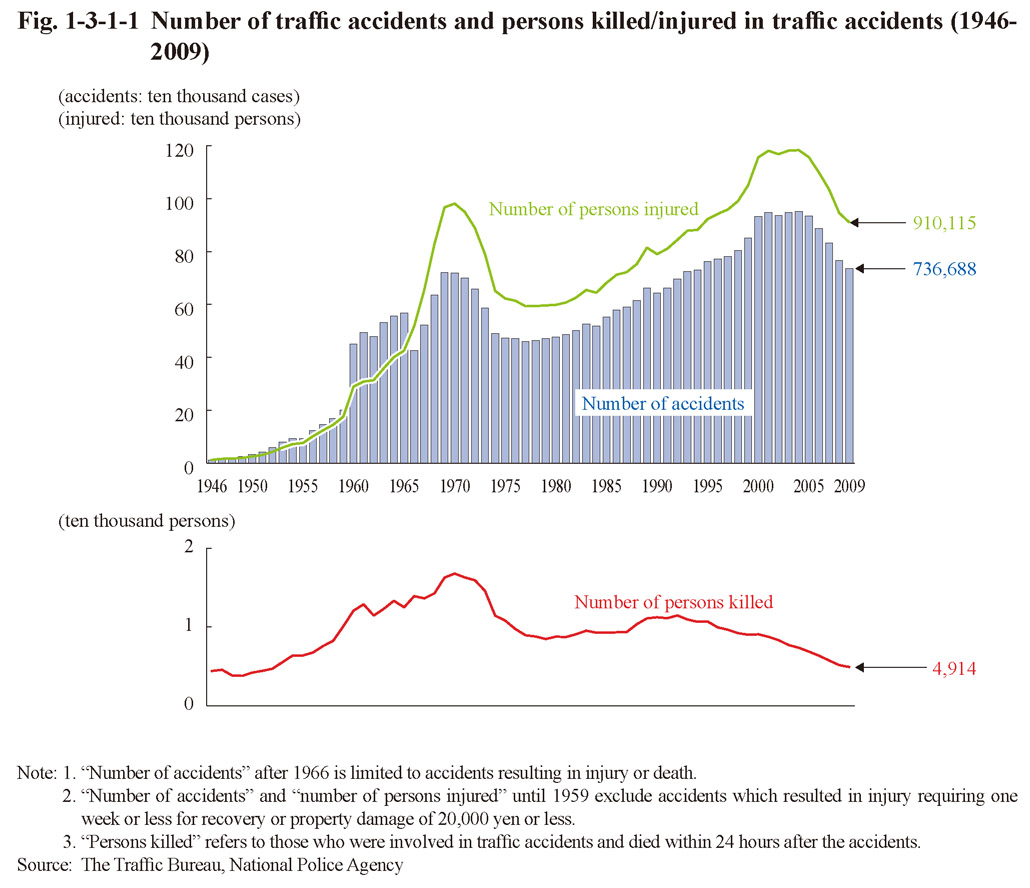
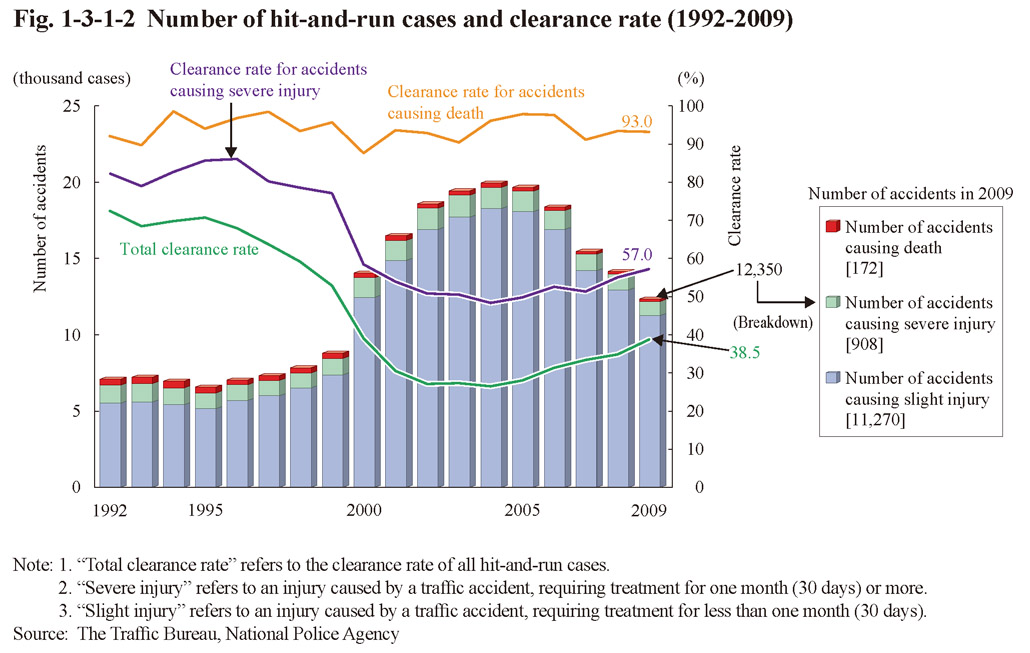 Fig. 1-3-1-2 Number of hit-and-run cases and clearance rate (1992-2009)
 Fig. 1-3-1-3 Number of referred cases for violations of road traffic related acts (1990-2009)
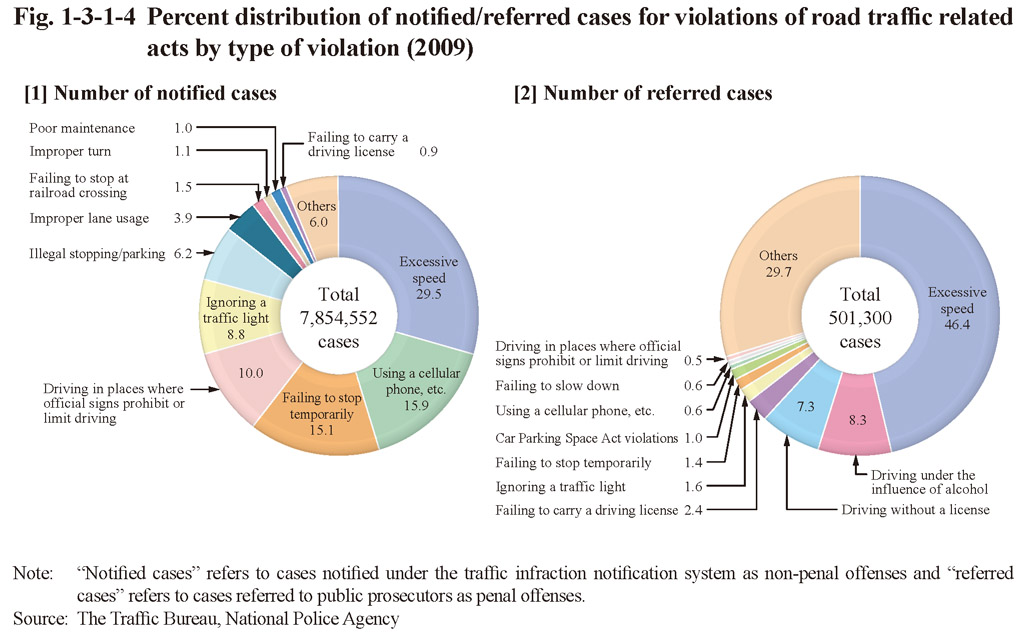
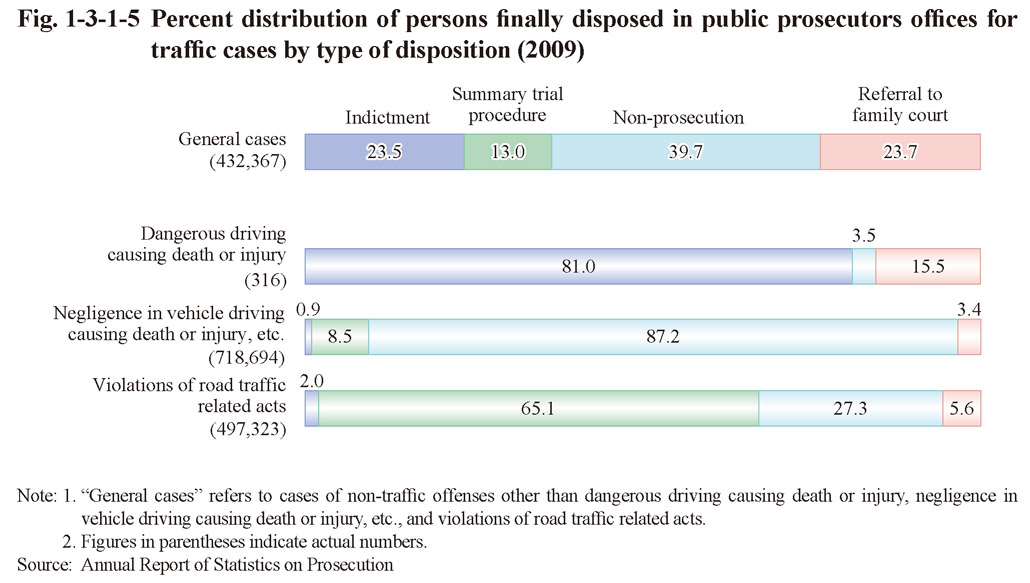

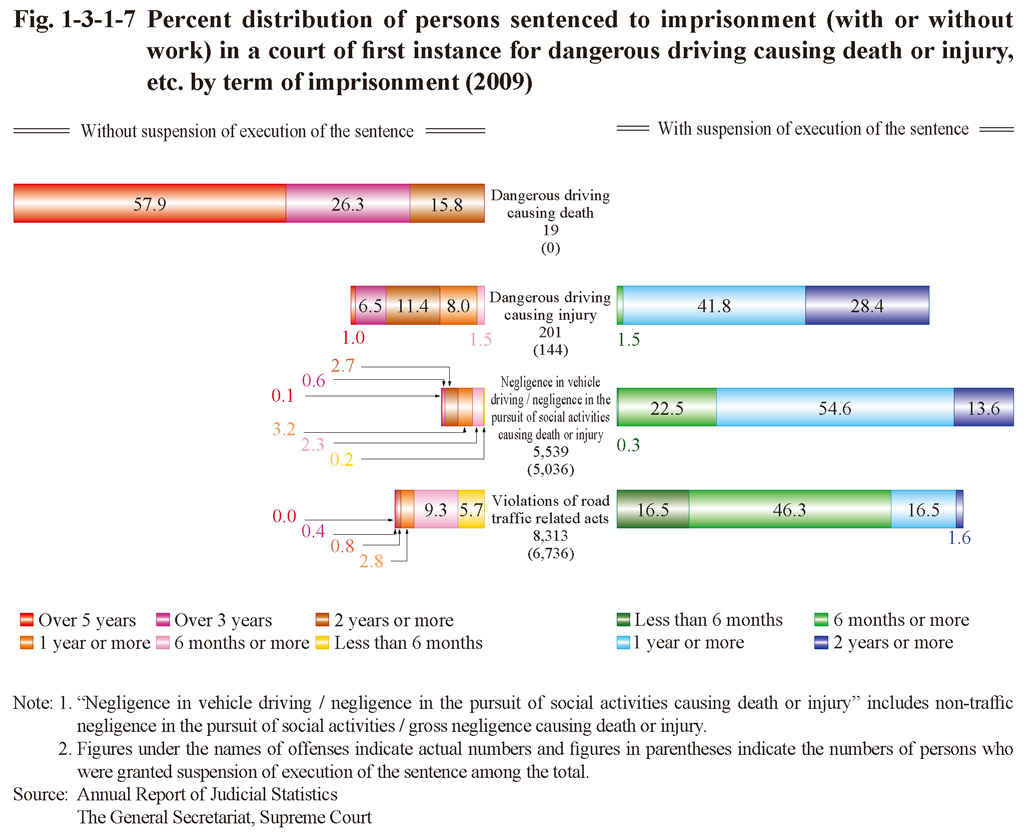
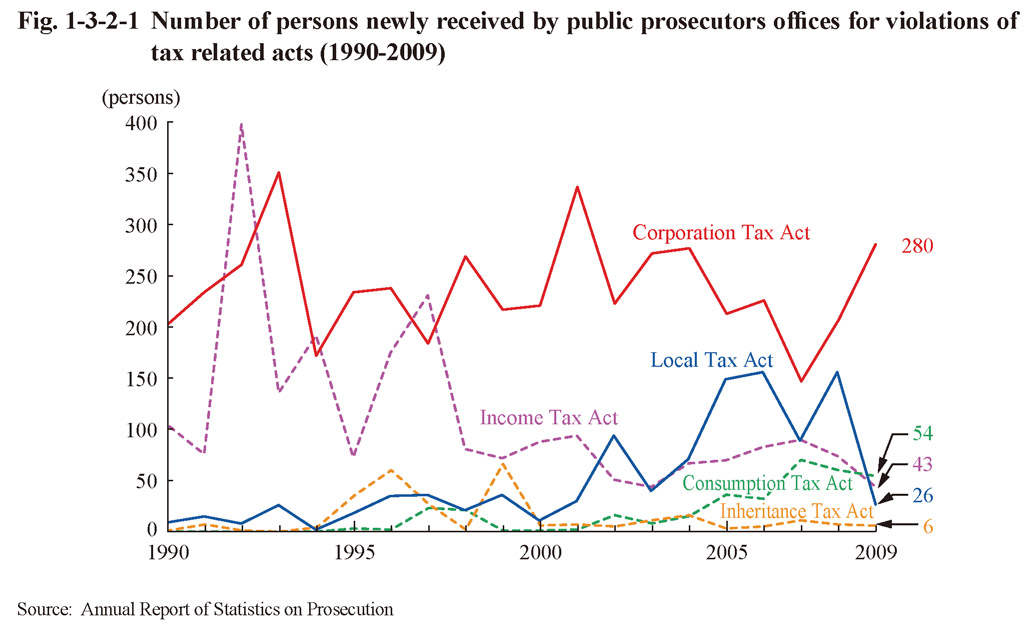
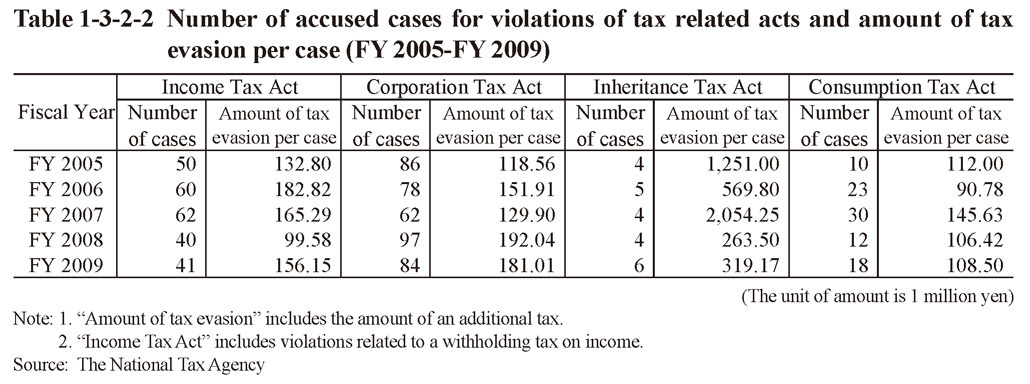
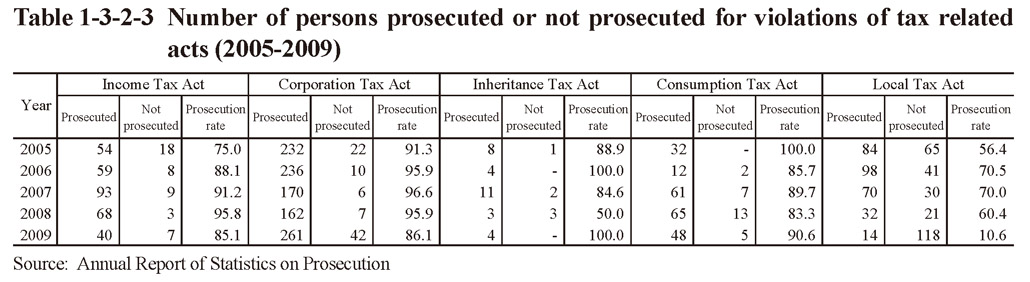
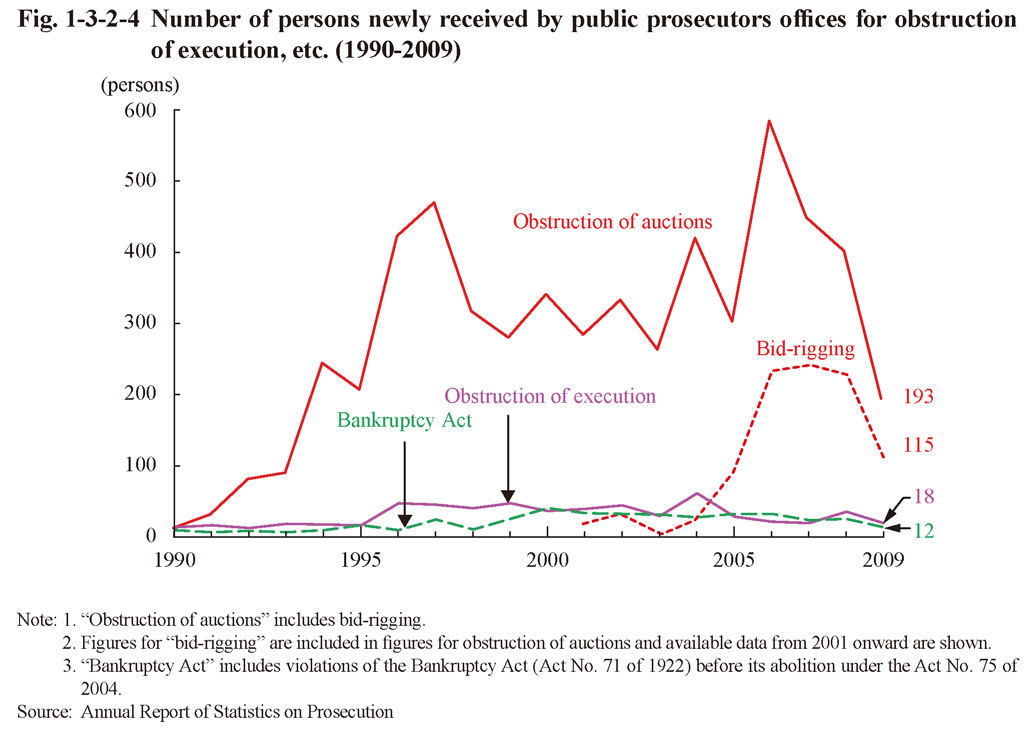
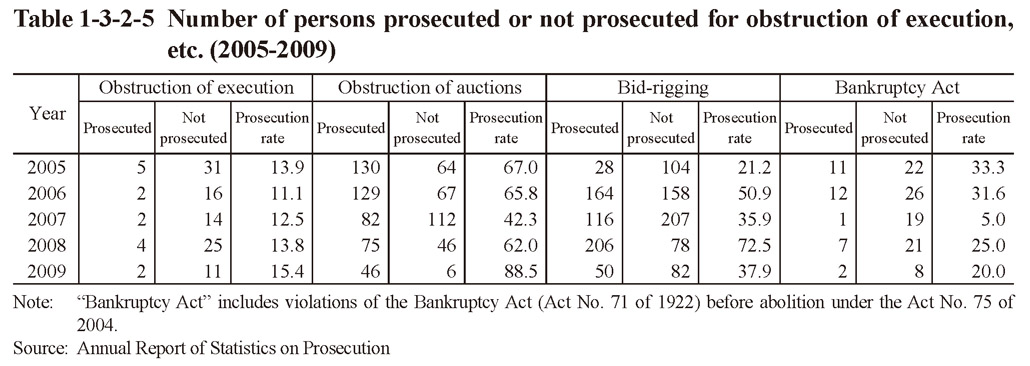
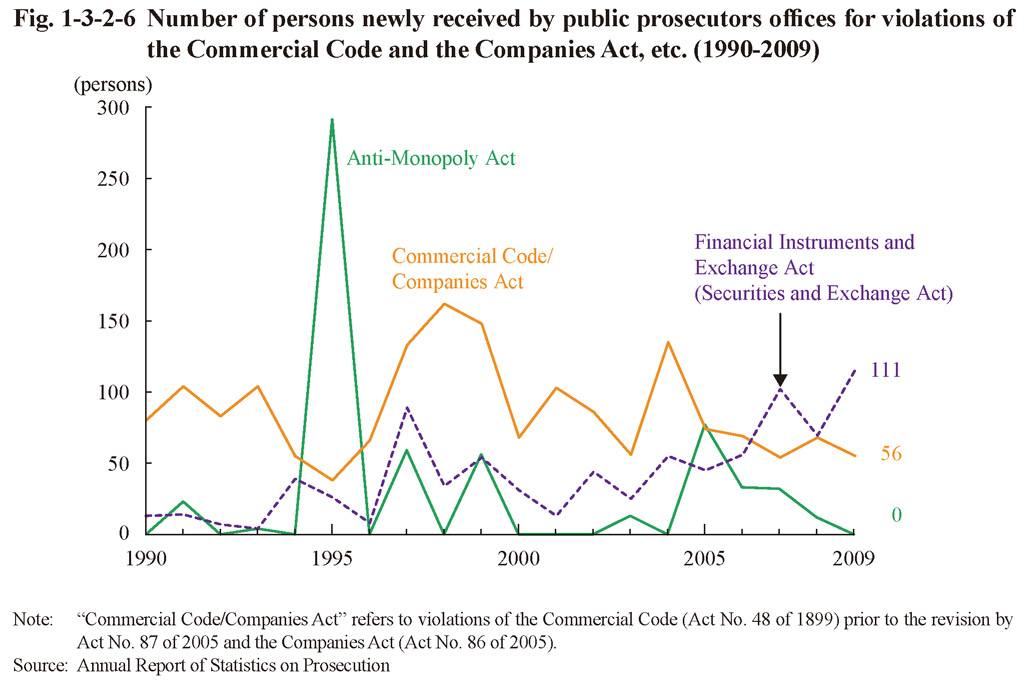
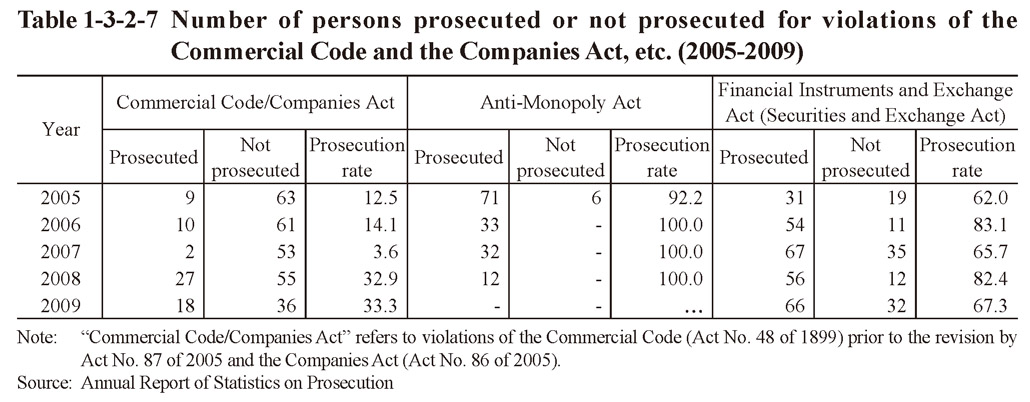
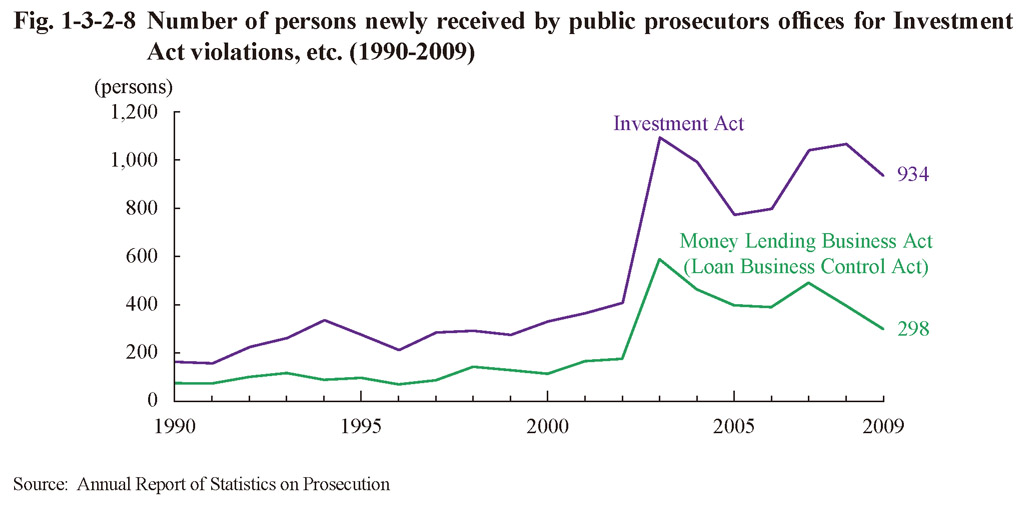
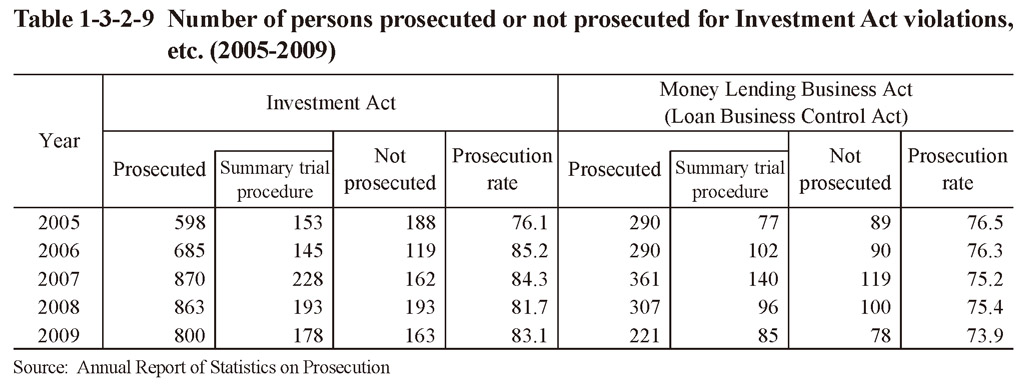
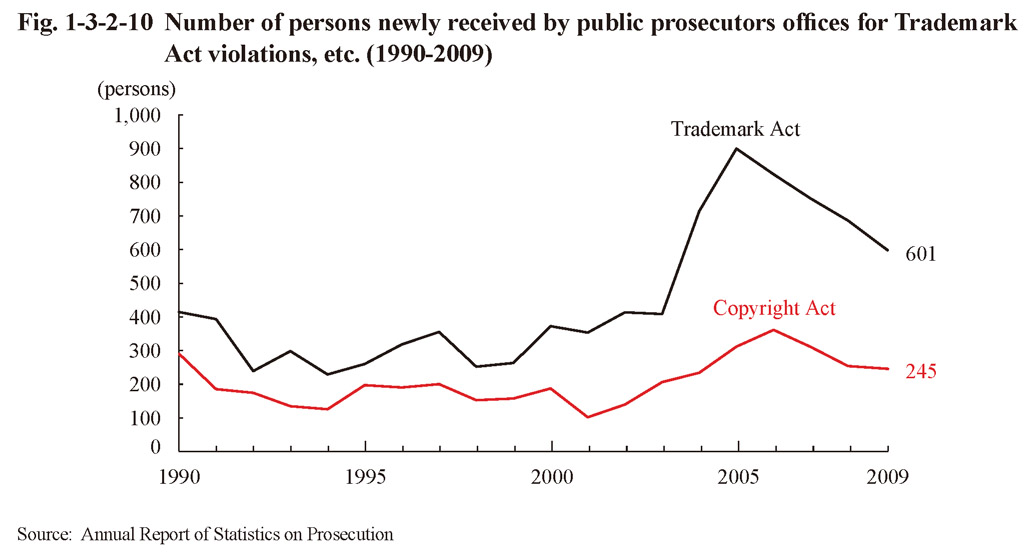
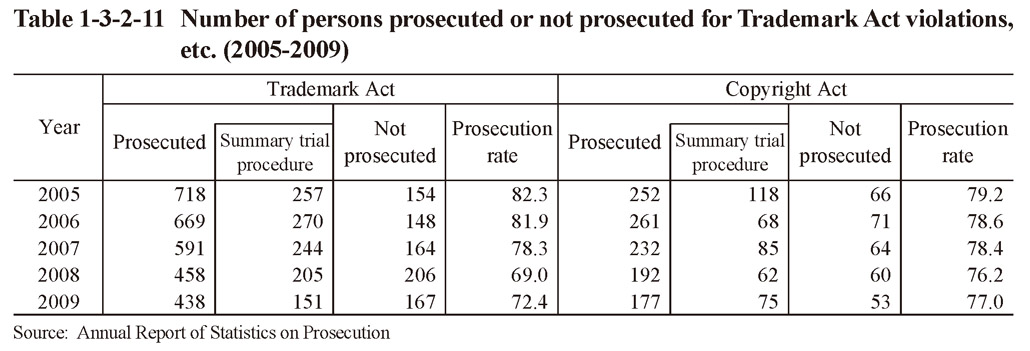

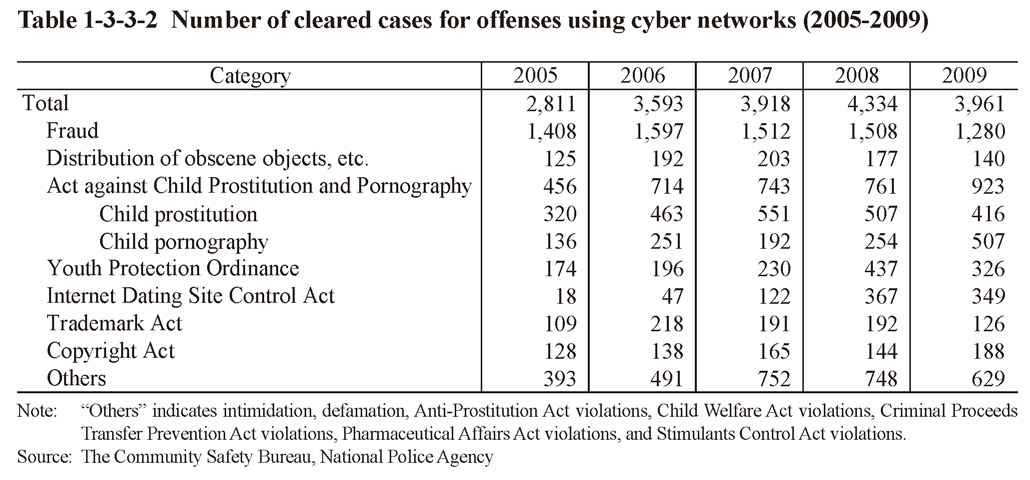 Table 1-3-3-2 Number of cleared cases for offenses using cyber networks (2005-2009)
 Table 1-3-3-3 Number of reported cases of computer viruses (2000-2009)
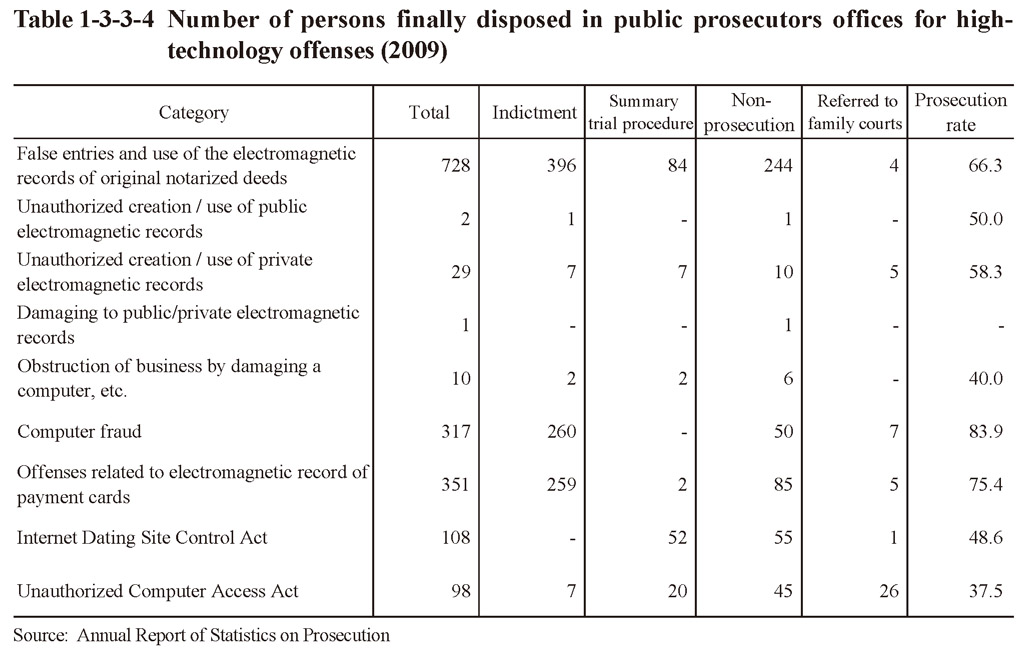
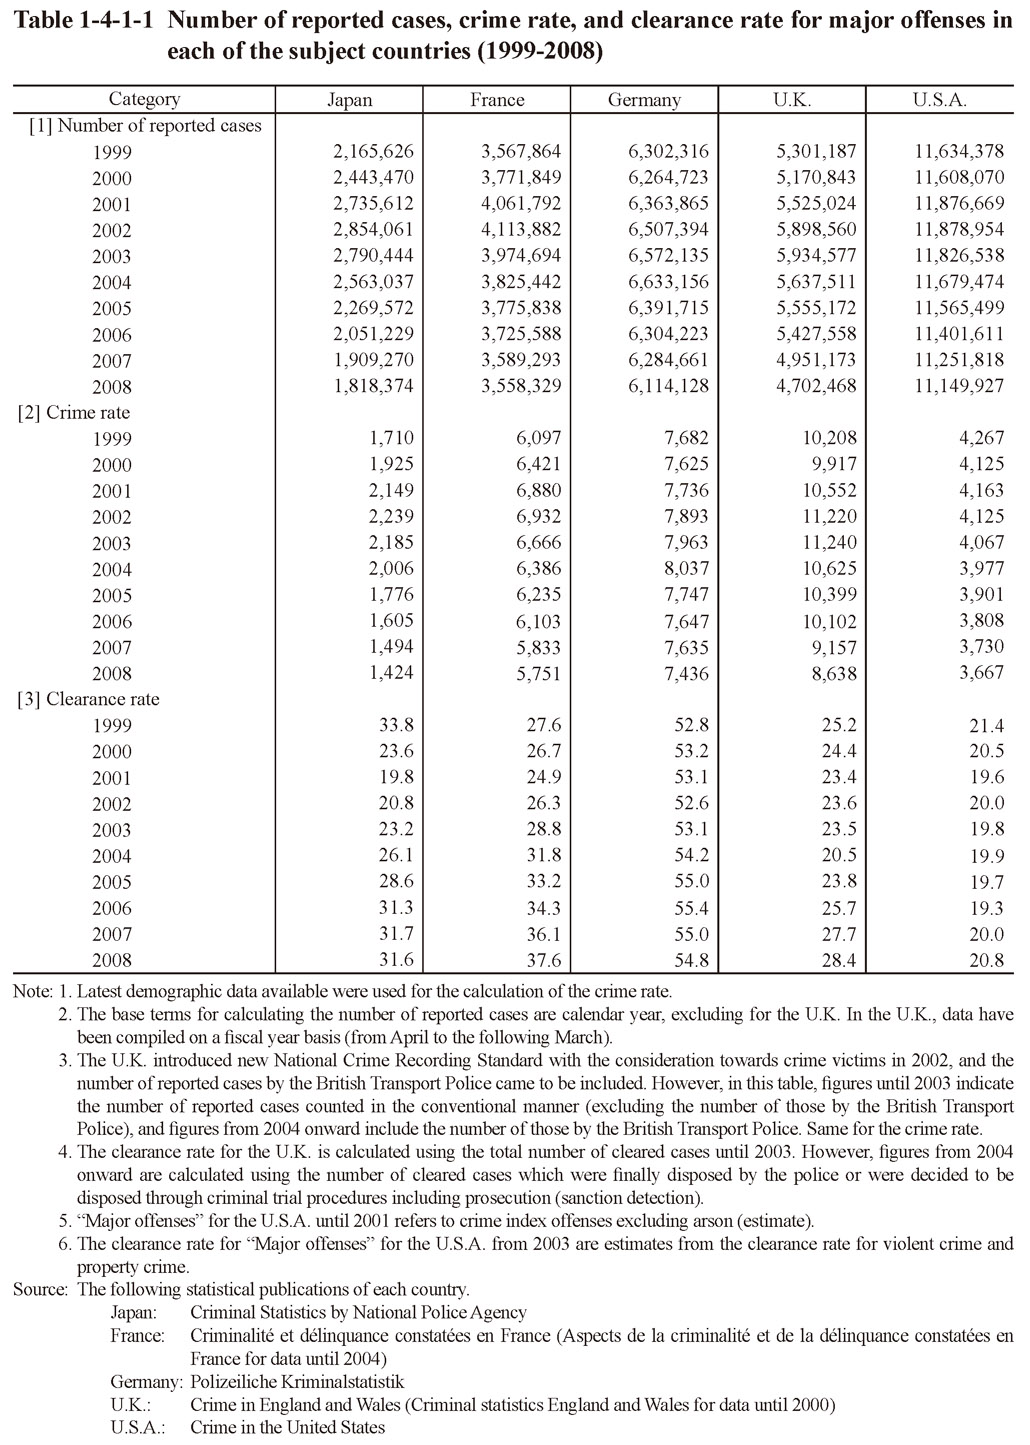
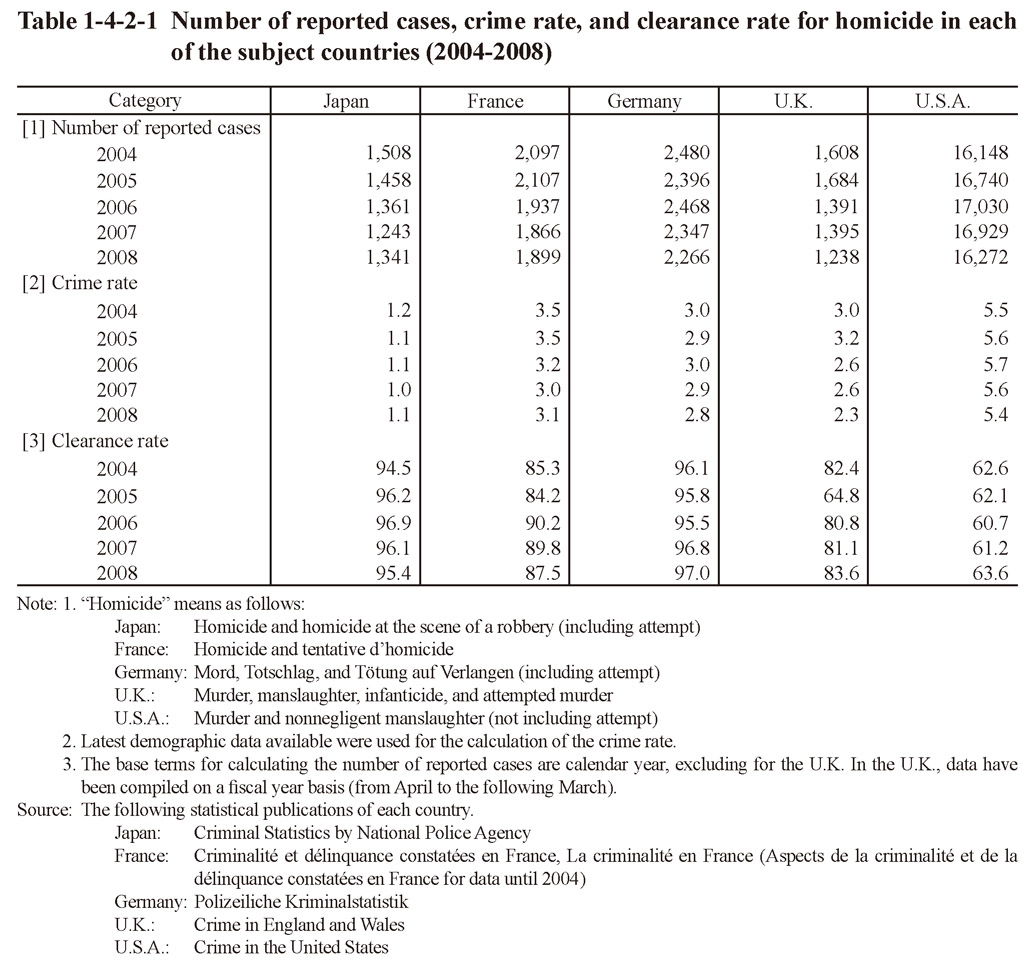
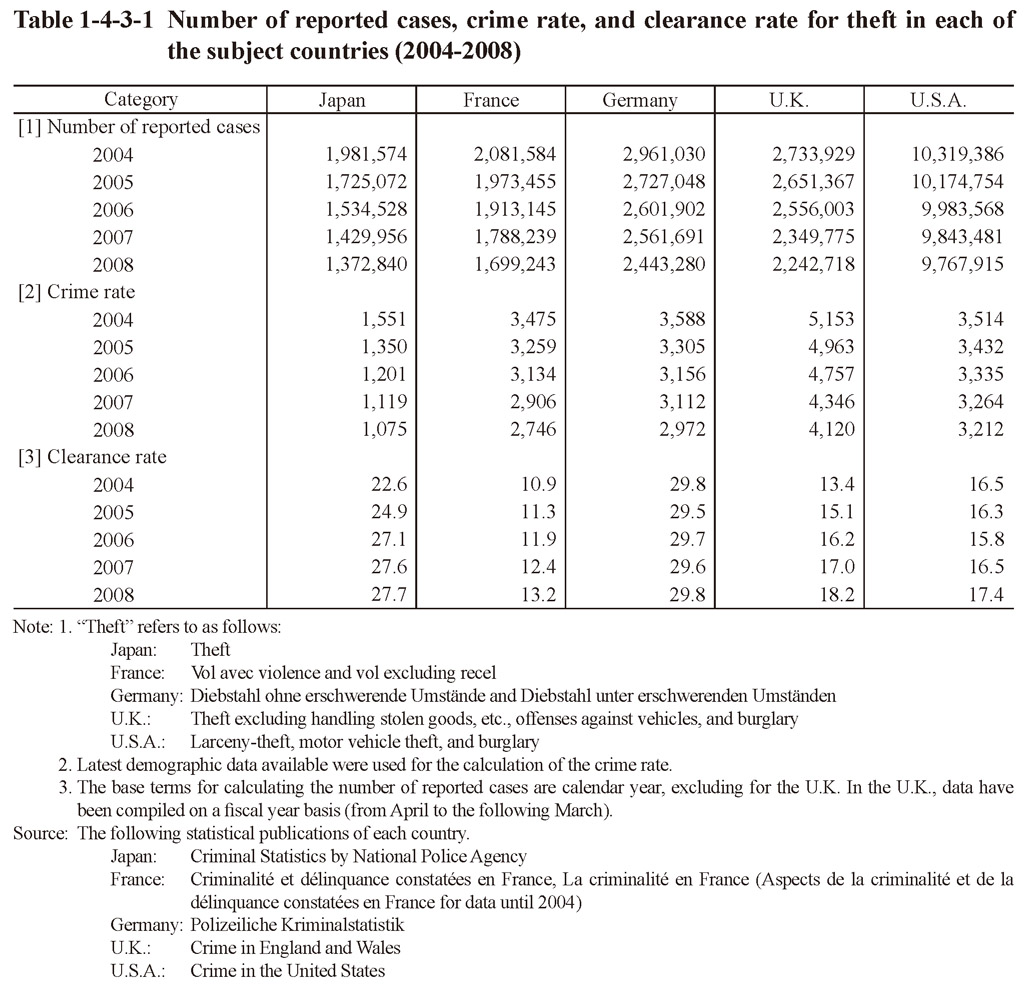
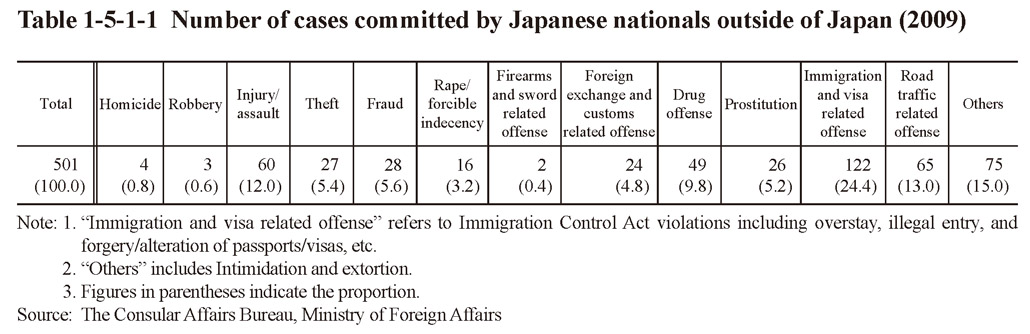 Table 1-5-1-1 Number of cases committed by Japanese nationals outside of Japan (2009)
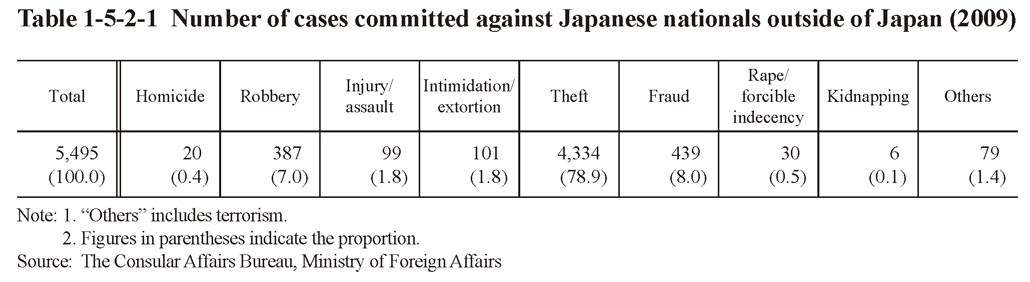 Table 1-5-2-1 Number of cases committed against Japanese nationals outside of Japan (2009)
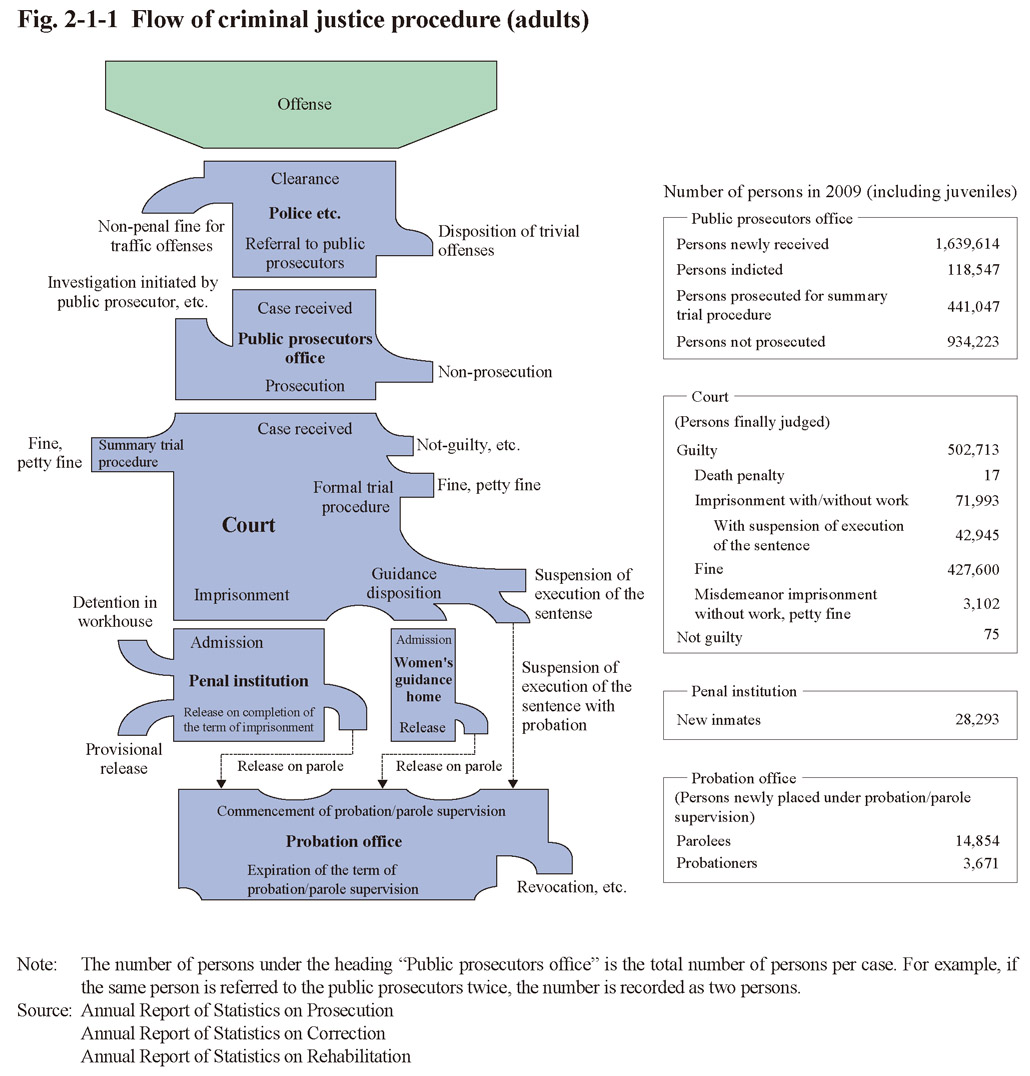 Fig. 2-1-1 Flow of criminal justice procedure (adults)
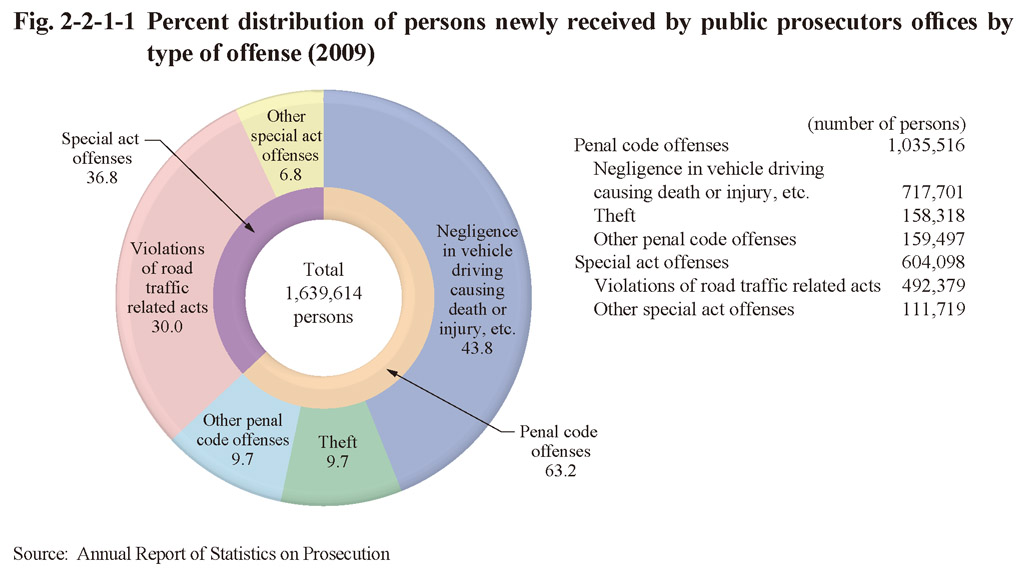
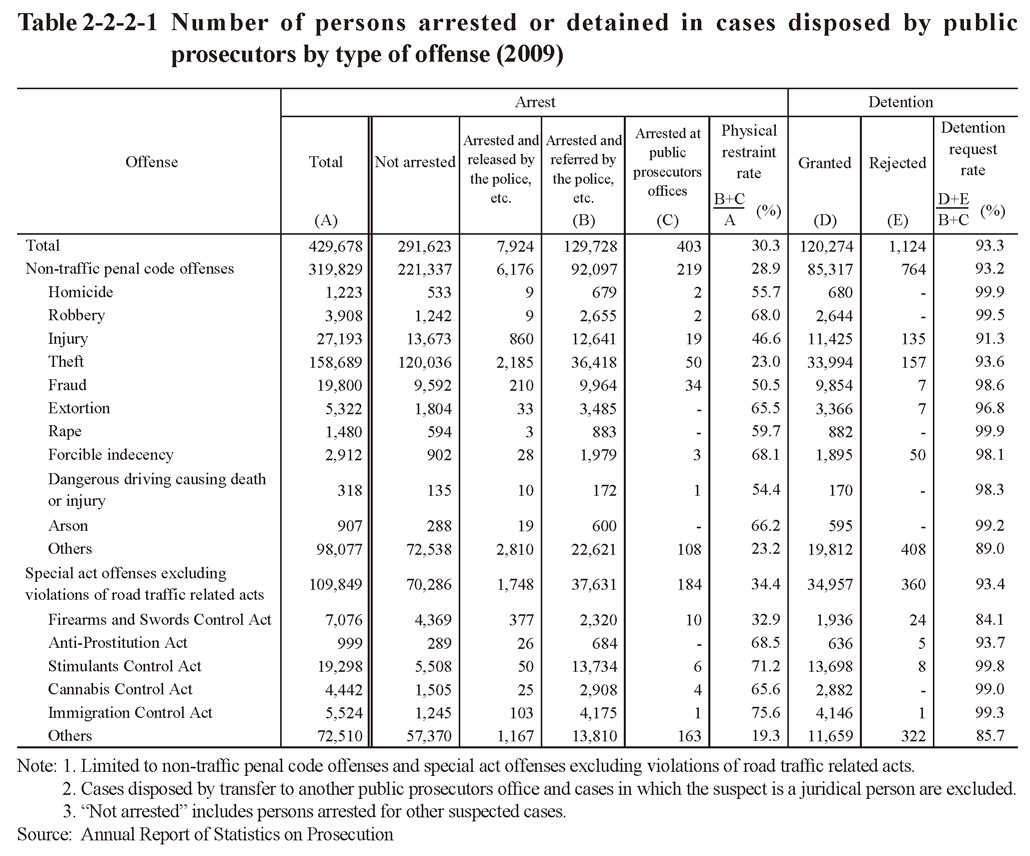
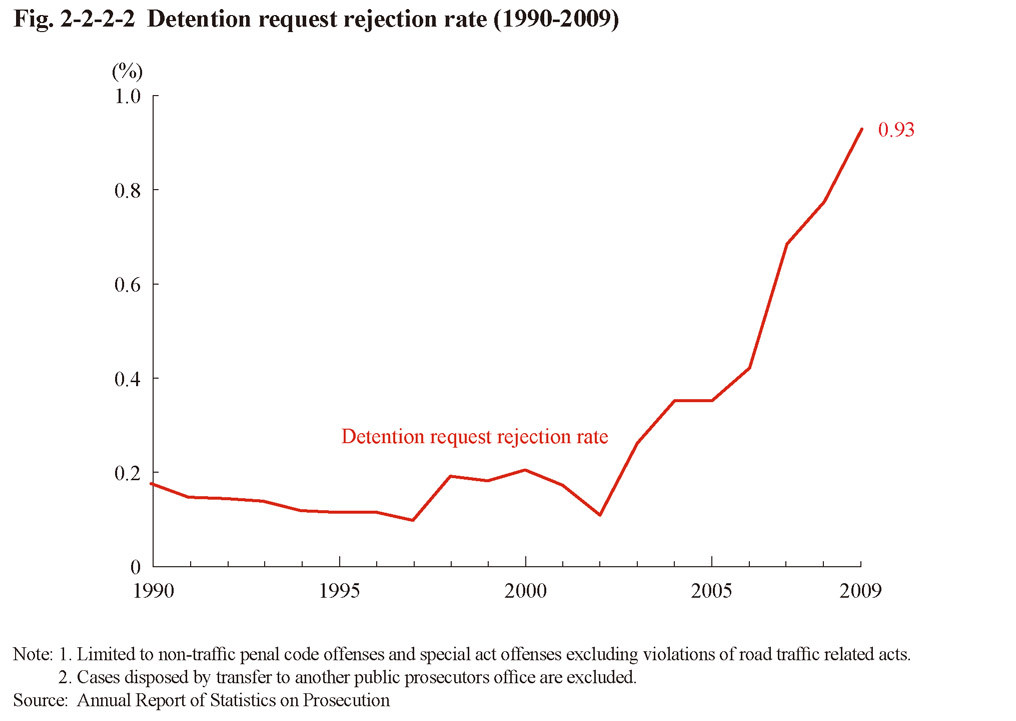 Fig. 2-2-2-2 Detention request rejection rate (1990-2009)
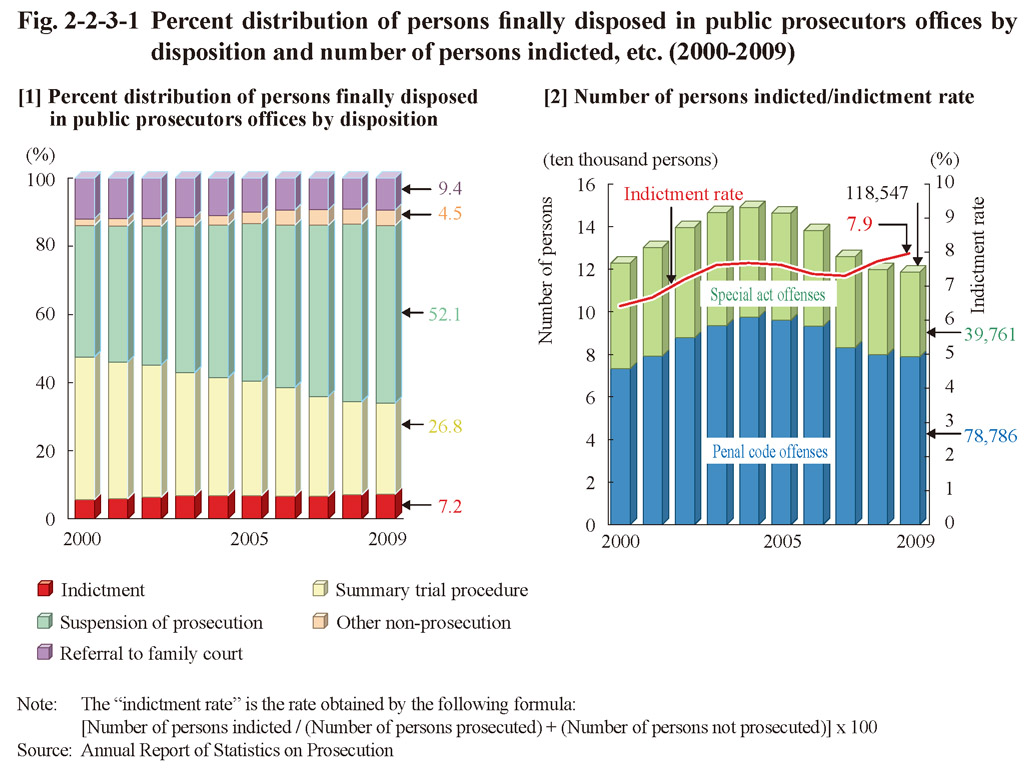
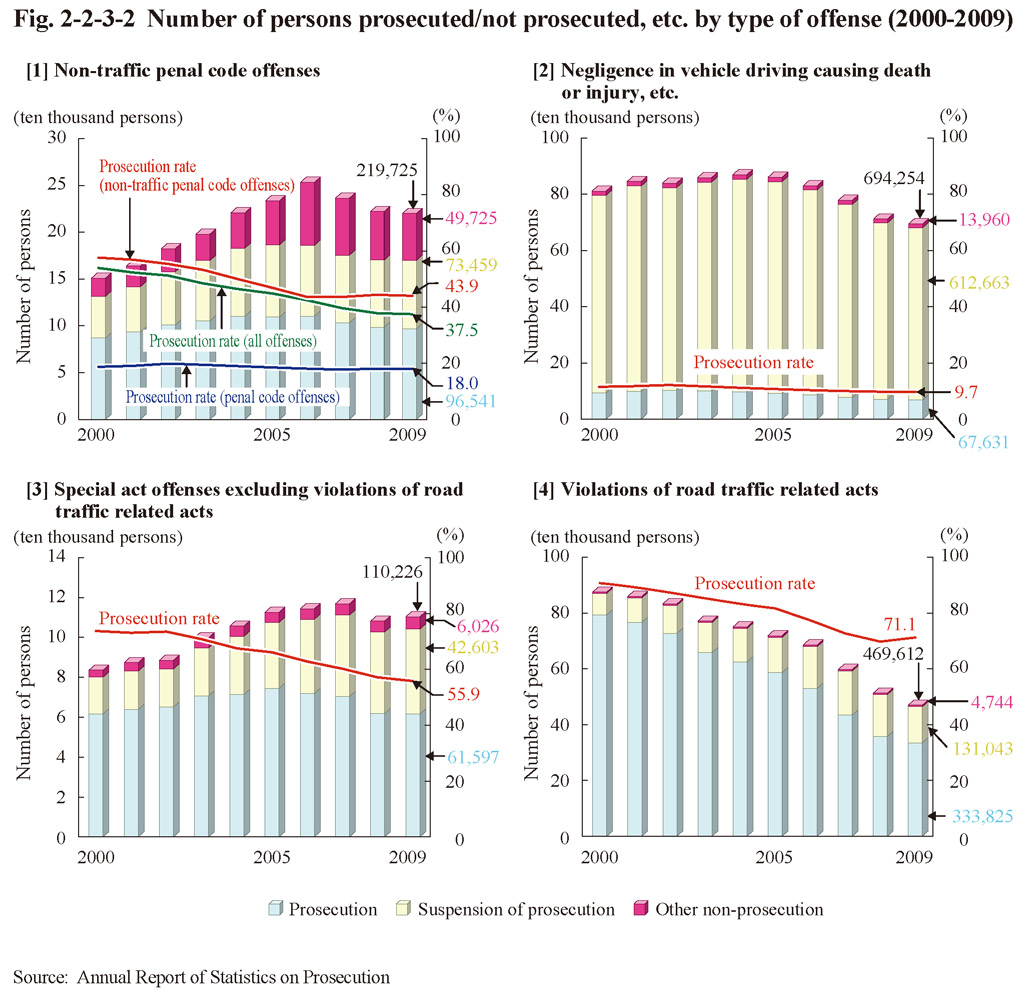 Fig. 2-2-3-2 Number of persons prosecuted/not prosecuted, etc. by type of offense (2000-2009)
 Table 2-2-3-3 Number of persons not prosecuted by reason (2009)
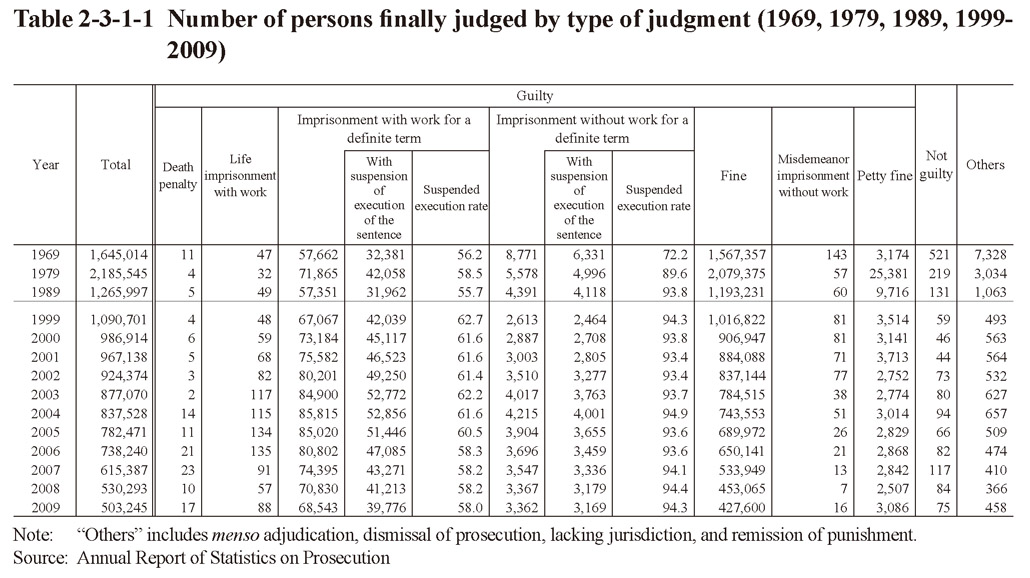 Table 2-3-1-1 Number of persons finally judged by type of judgment (1969, 1979, 1989, 1999- 2009)
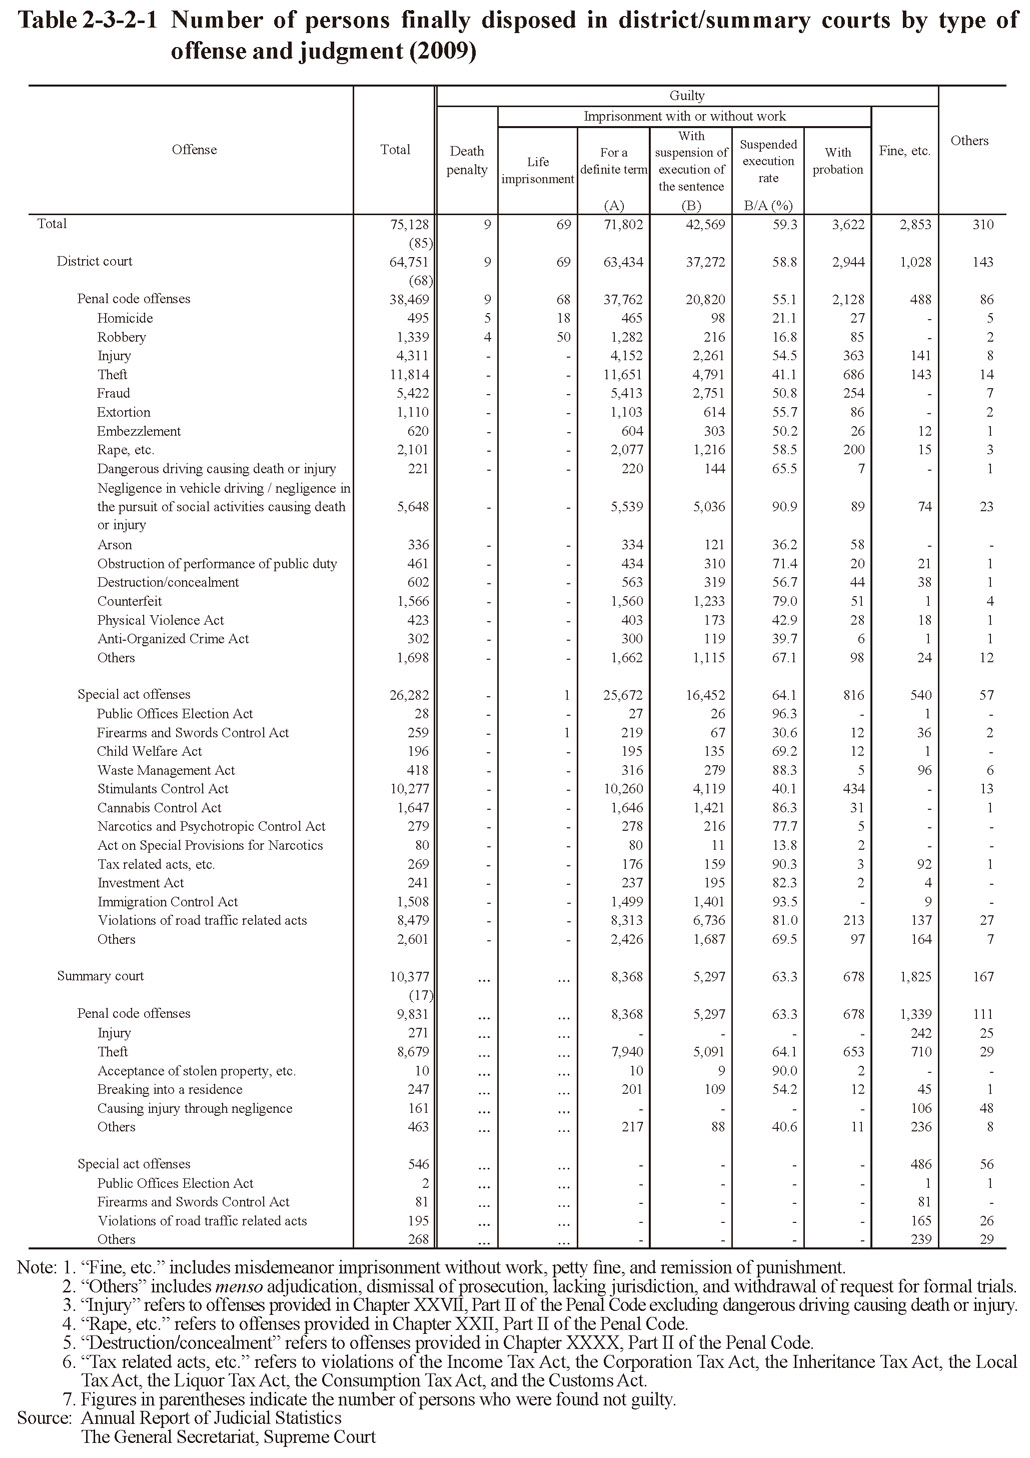

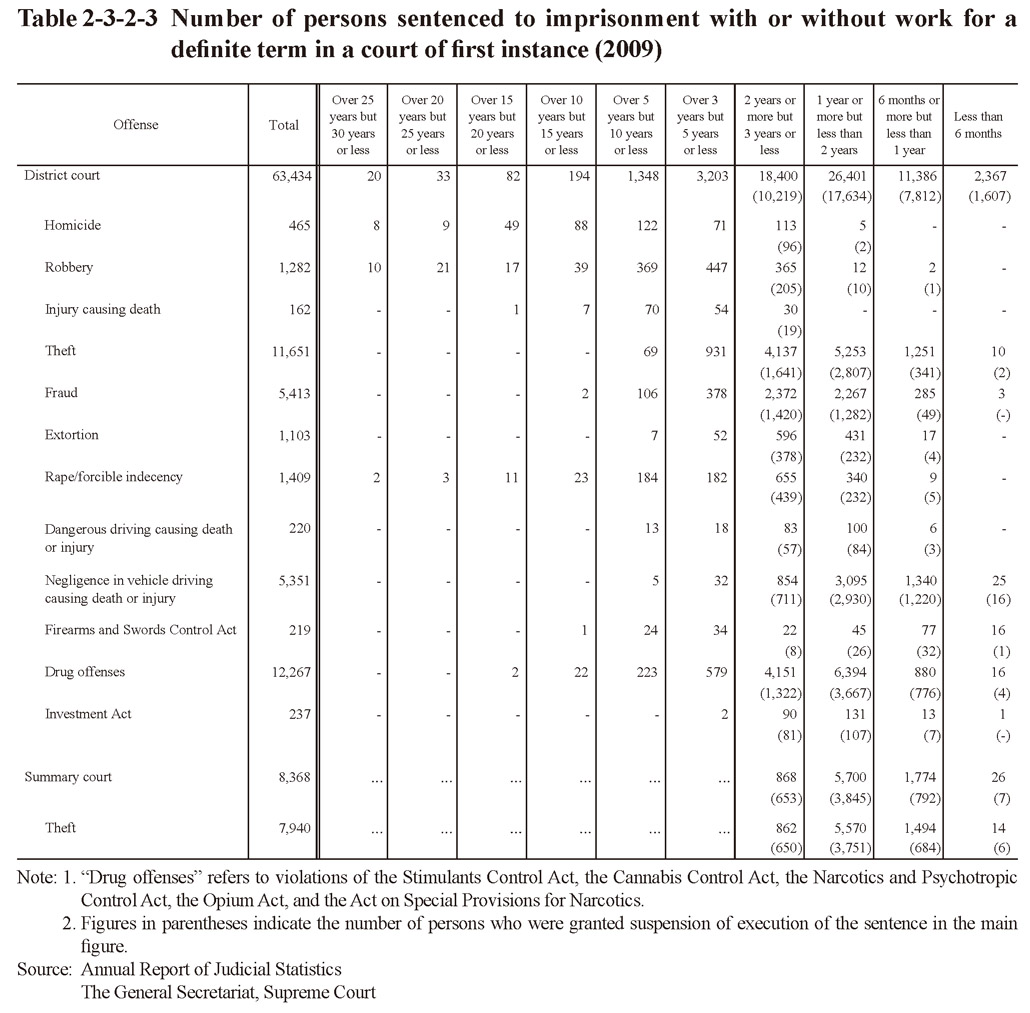
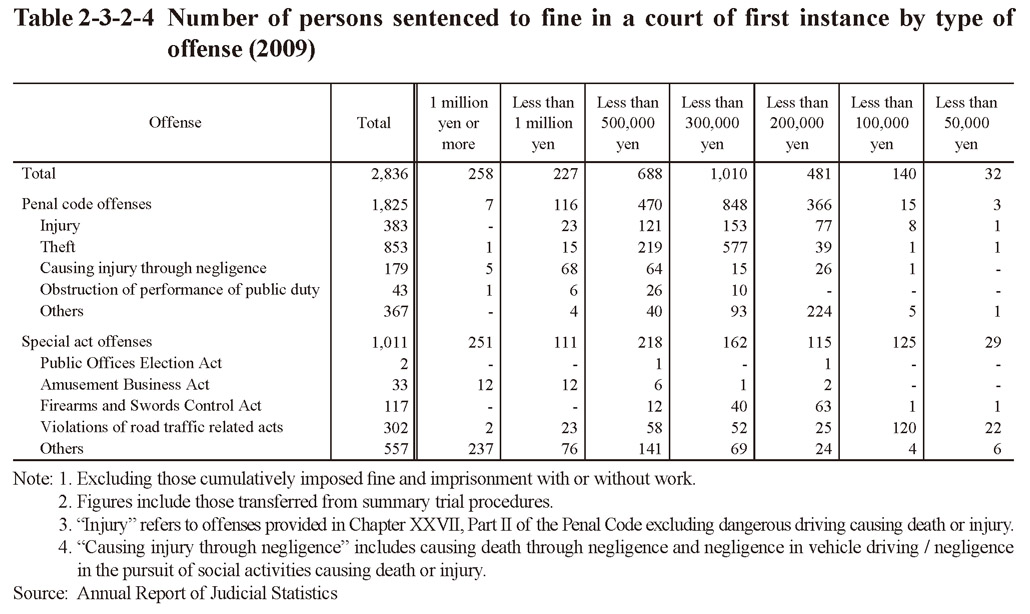
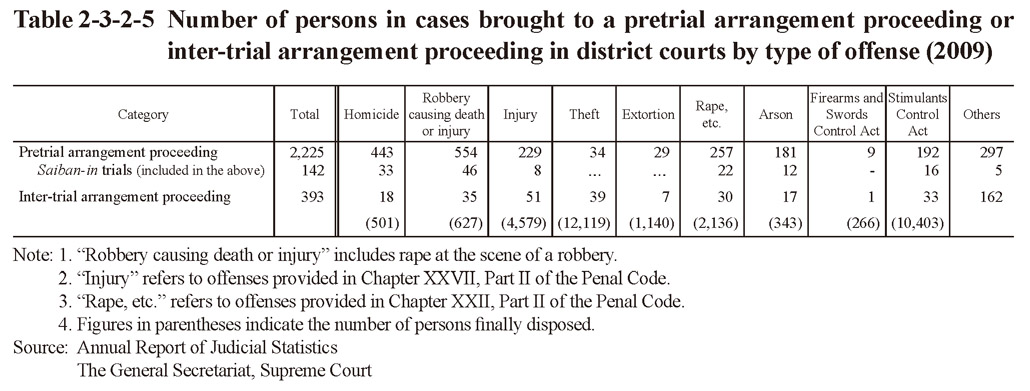

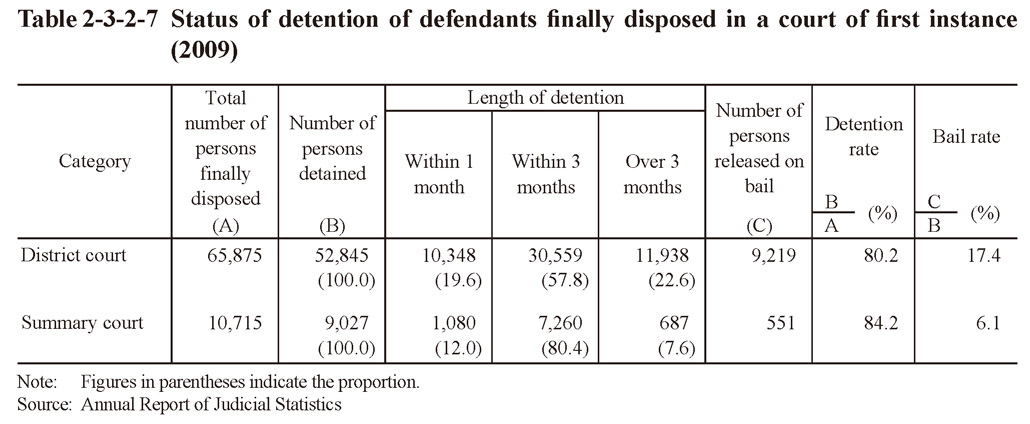 Table 2-3-2-7 Status of detention of defendants finally disposed in a court of first instance (2009)
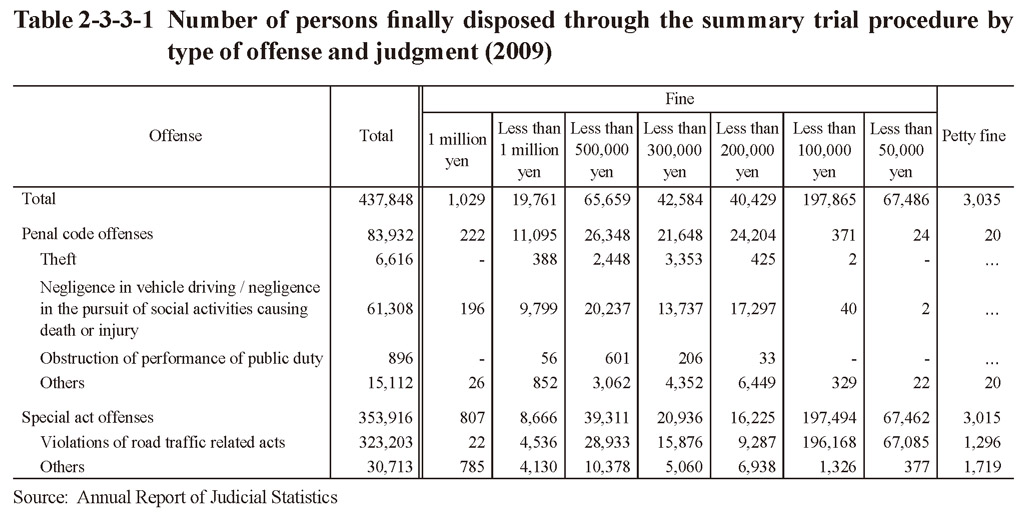
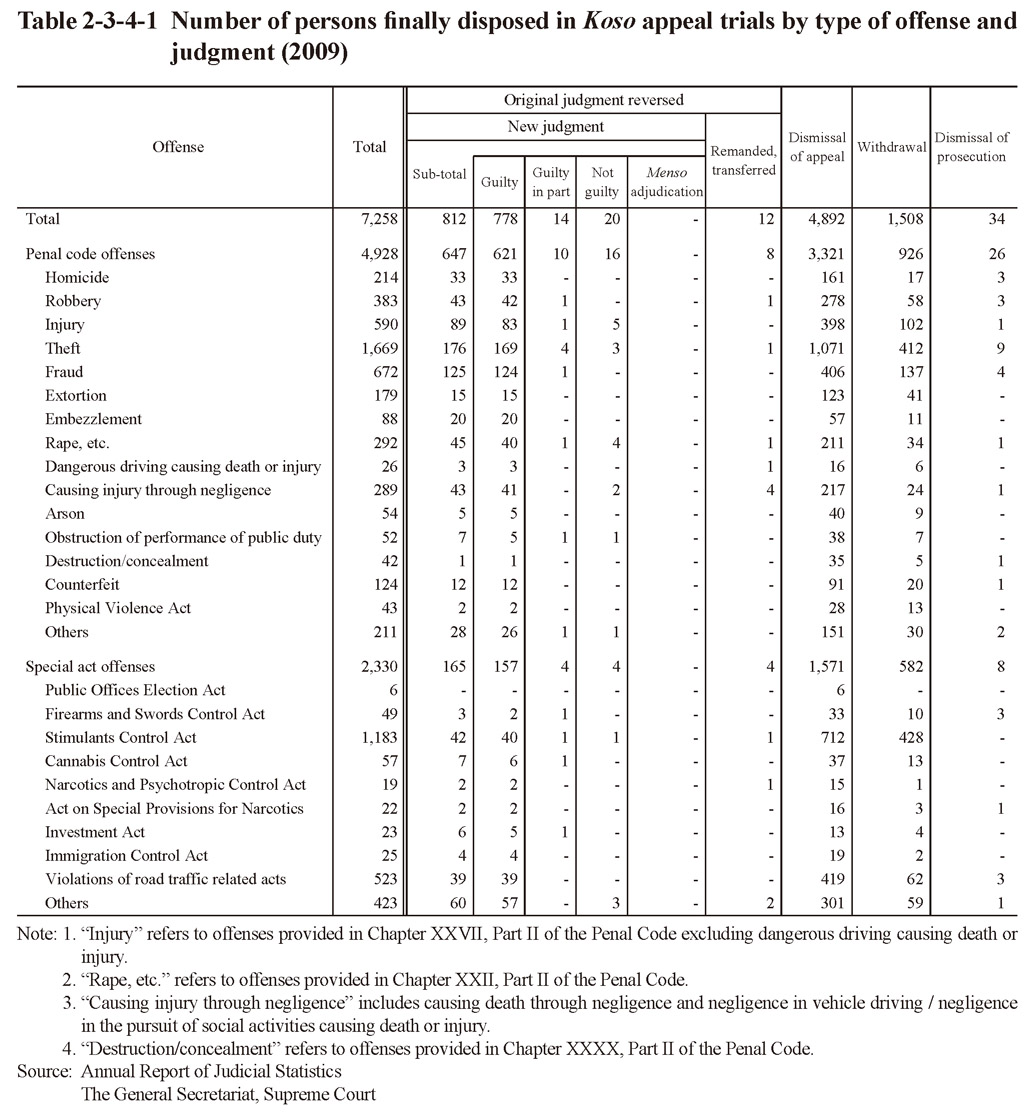
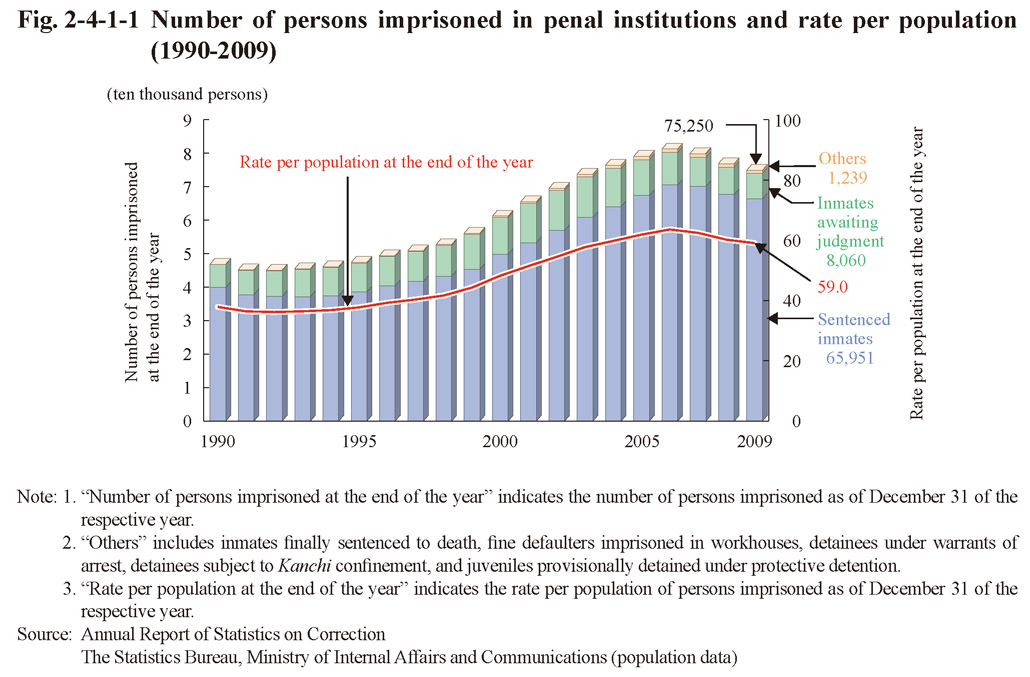 Fig. 2-4-1-1 Number of persons imprisoned in penal institutions and rate per population (1990-2009)
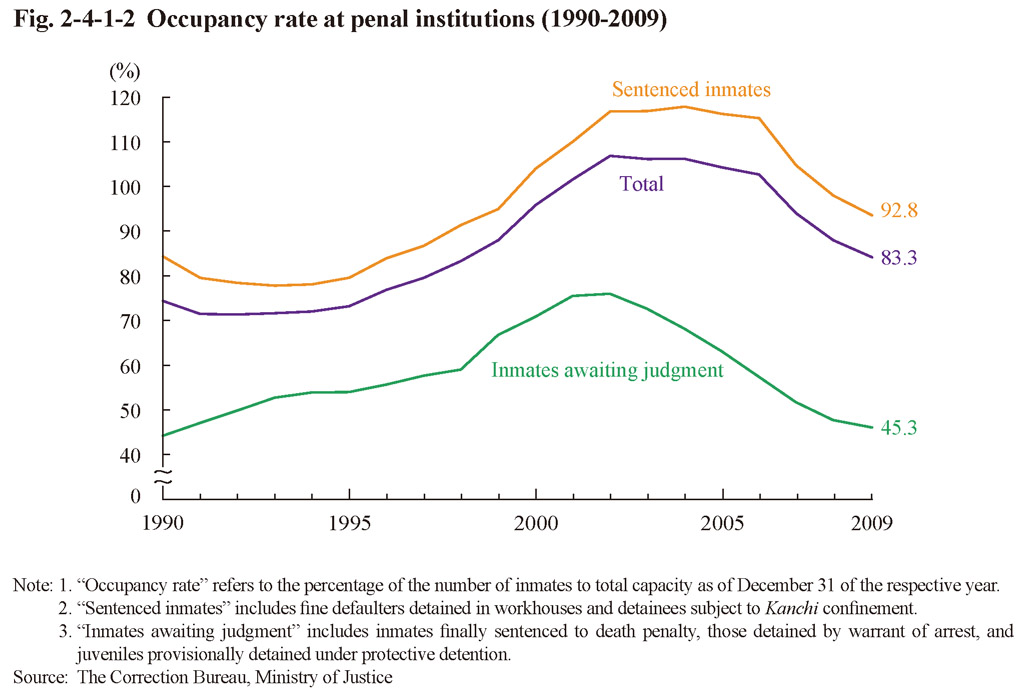 Fig. 2-4-1-2 Occupancy rate at penal institutions (1990-2009)
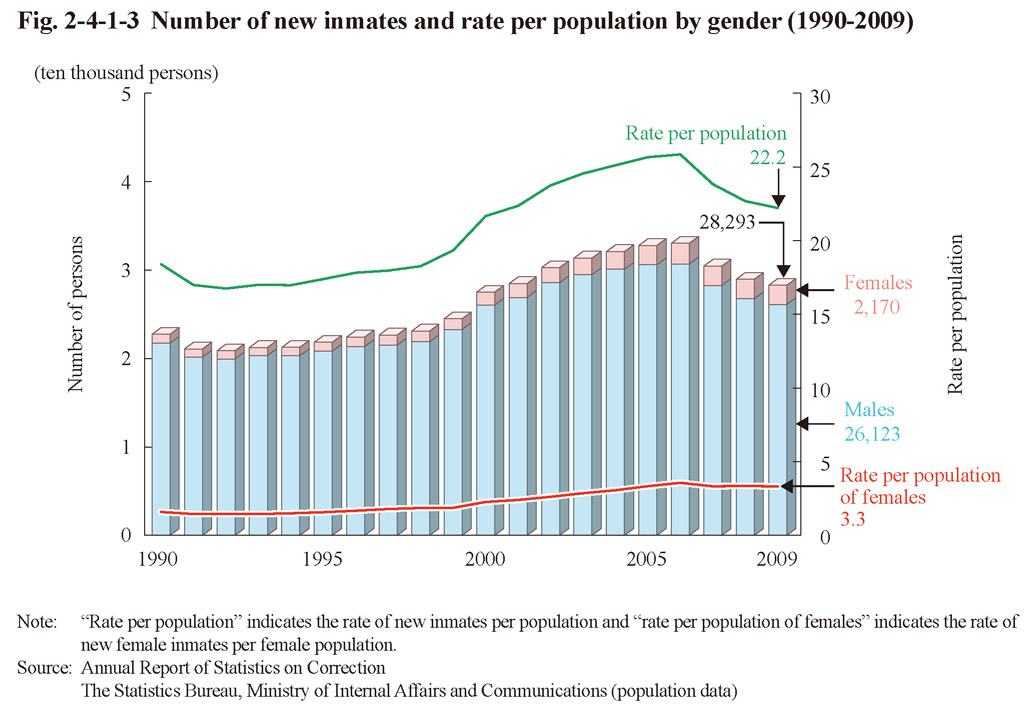 Fig. 2-4-1-3 Number of new inmates and rate per population by gender (1990-2009)
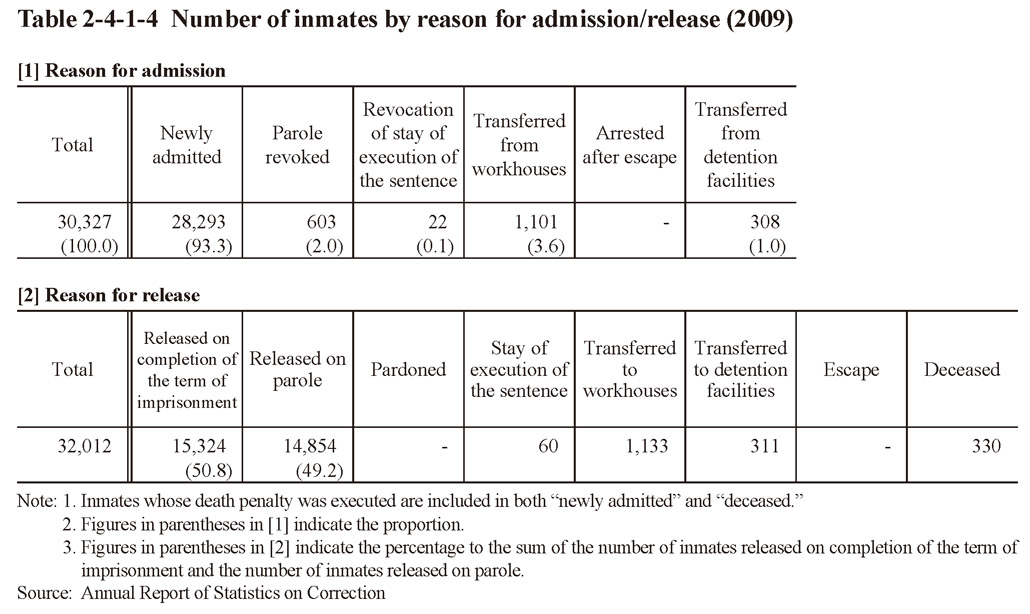 Table 2-4-1-4 Number of inmates by reason for admission/release (2009)
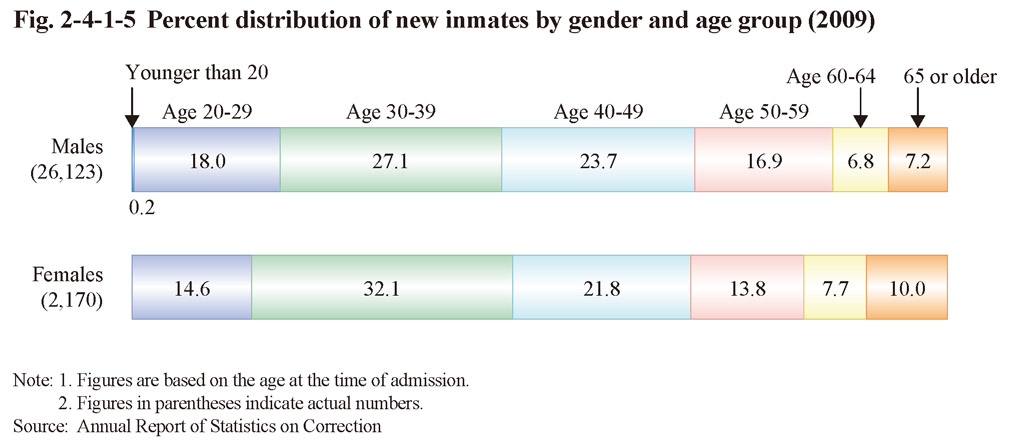 Fig. 2-4-1-5 Percent distribution of new inmates by gender and age group (2009)
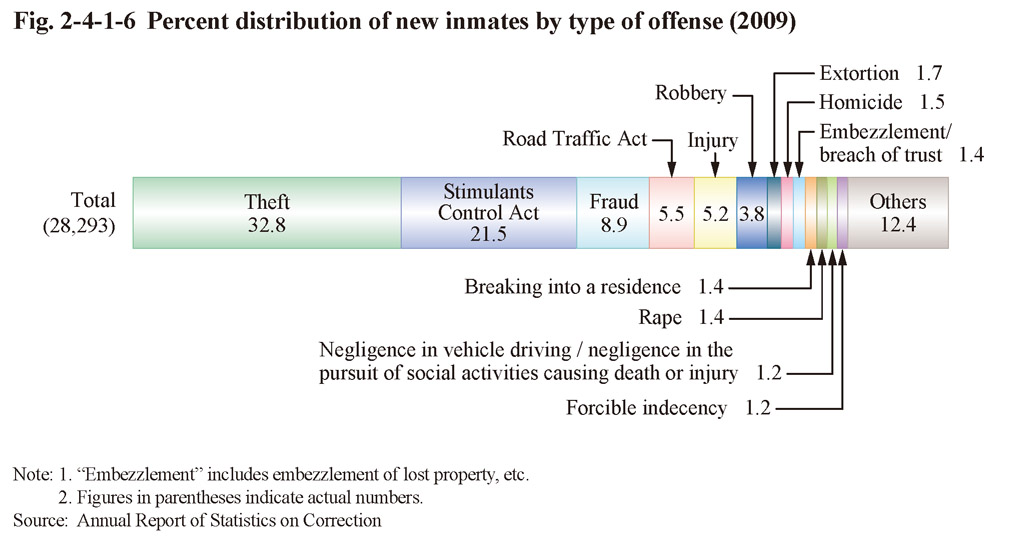 Fig. 2-4-1-6 Percent distribution of new inmates by type of offense (2009)
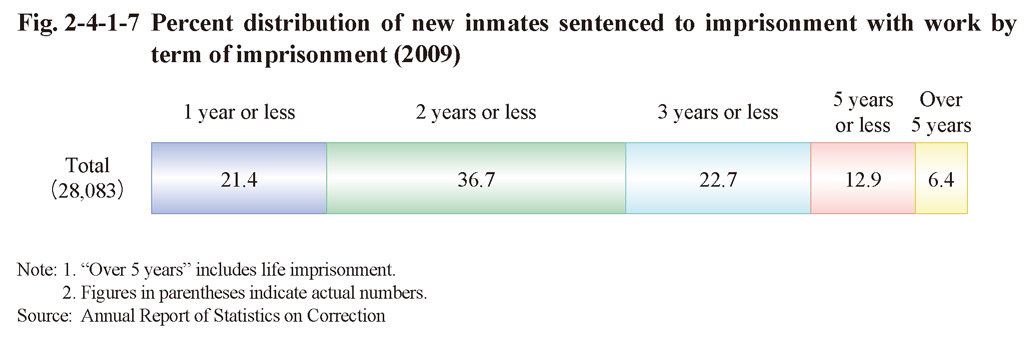
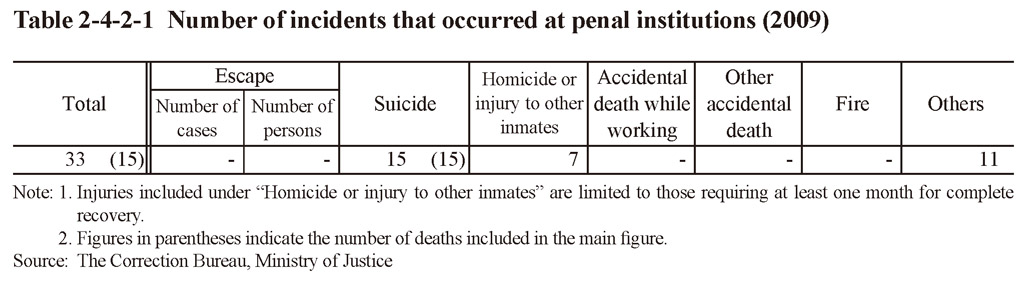 Table 2-4-2-1 Number of incidents that occurred at penal institutions (2009)
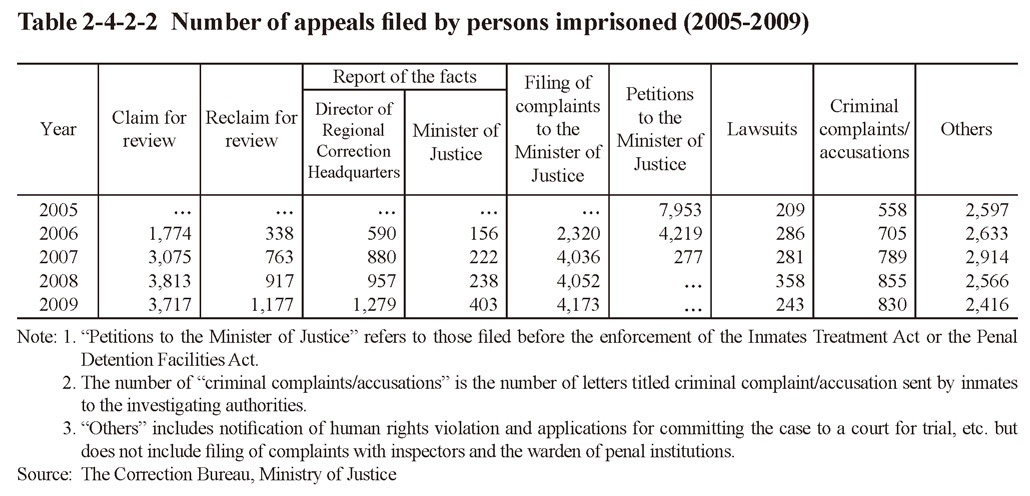 Table 2-4-2-2 Number of appeals filed by persons imprisoned (2005-2009)
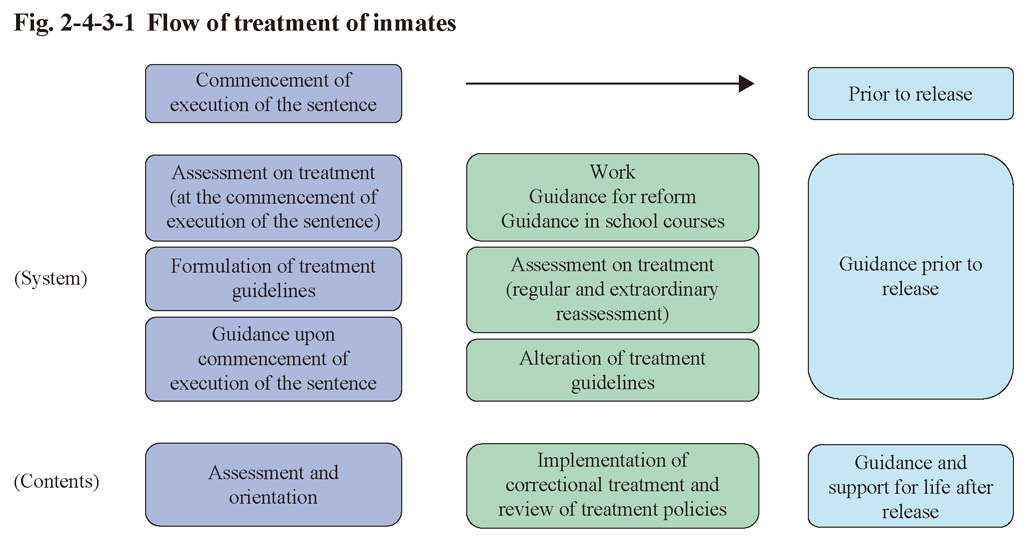 Fig. 2-4-3-1 Flow of treatment of inmates
 Table 2-4-3-2 Number of inmates by classification and treatment index code
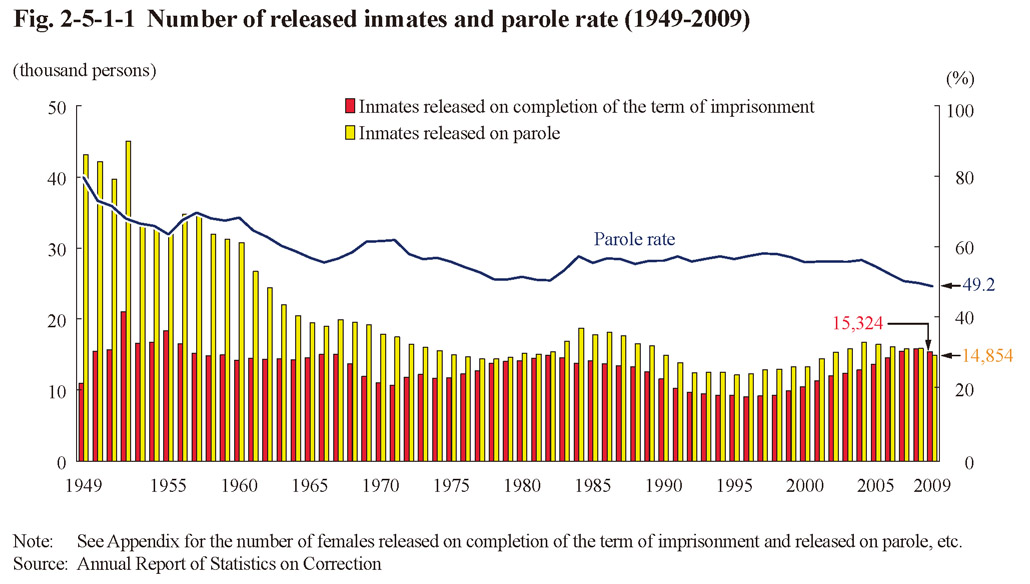 Fig. 2-5-1-1 Number of released inmates and parole rate (1949-2009)
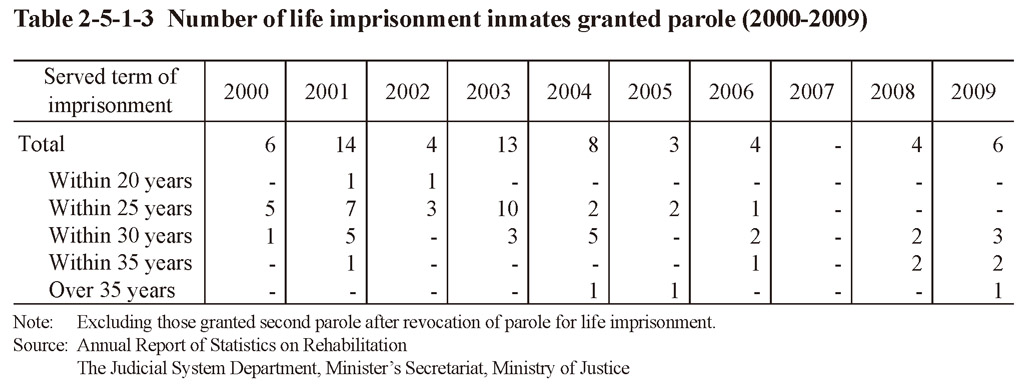 Table 2-5-1-3 Number of life imprisonment inmates granted parole (2000-2009)
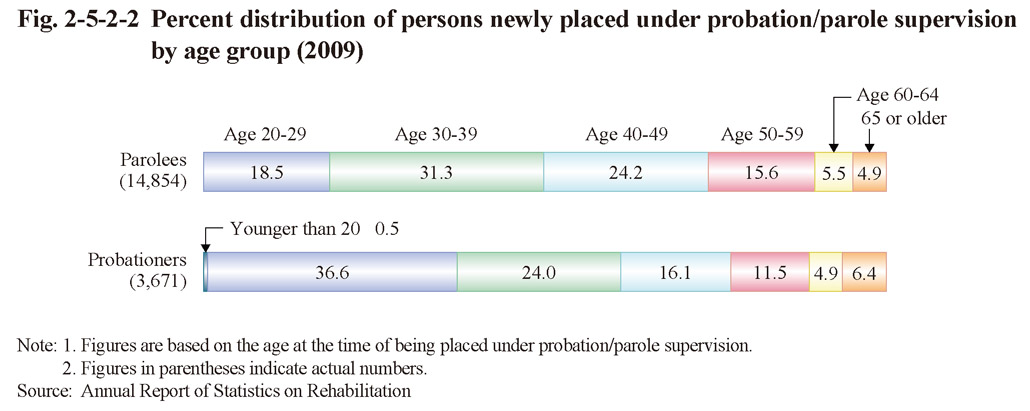
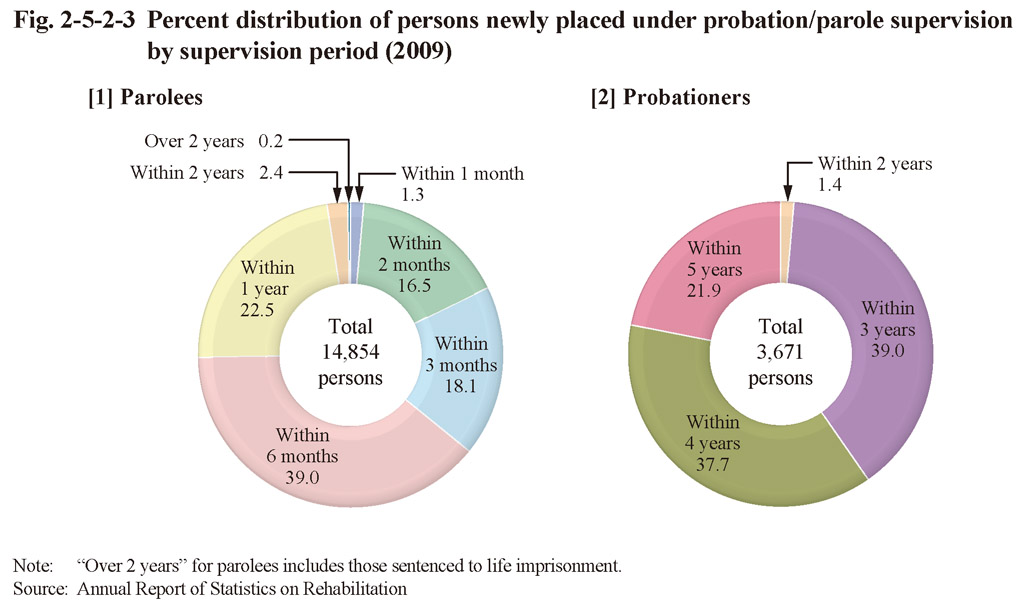
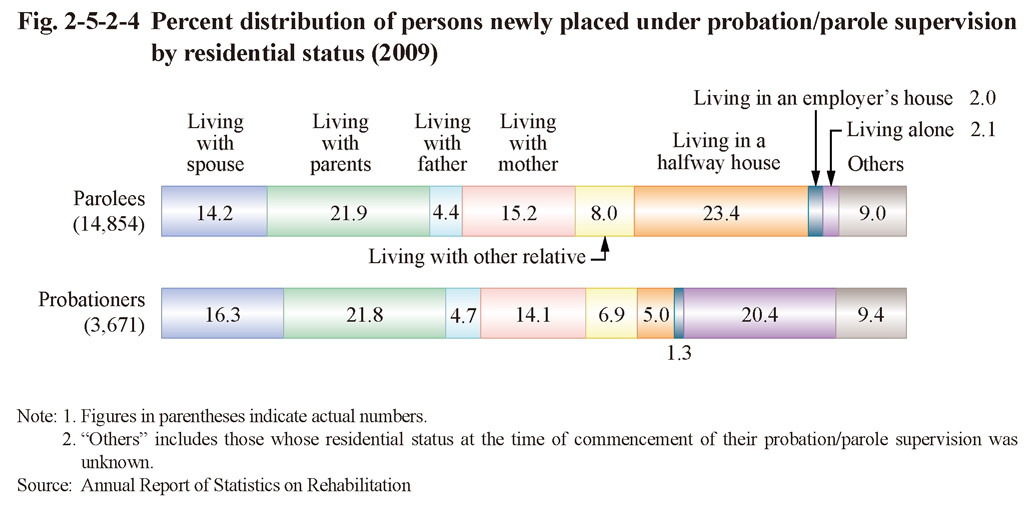
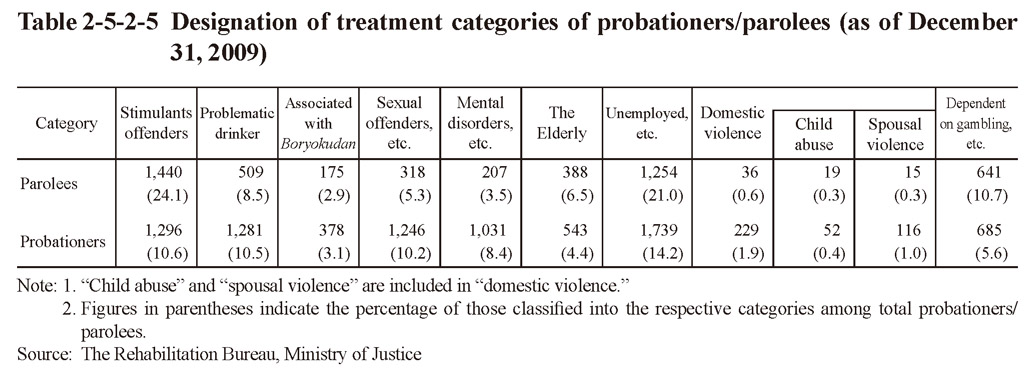 Table 2-5-2-5 Designation of treatment categories of probationers/parolees (as of December 31, 2009)
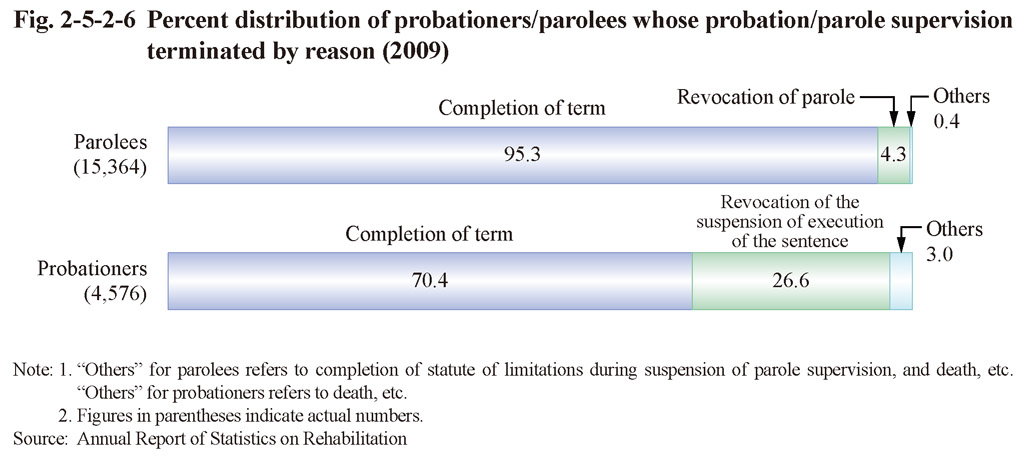
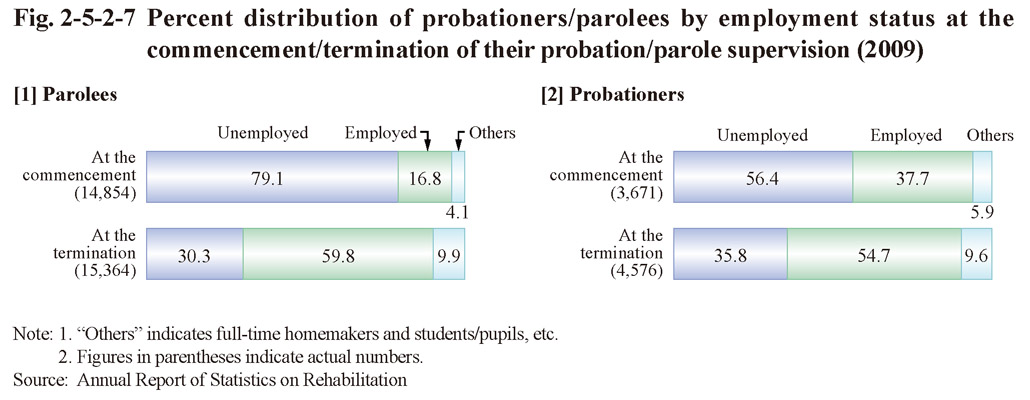
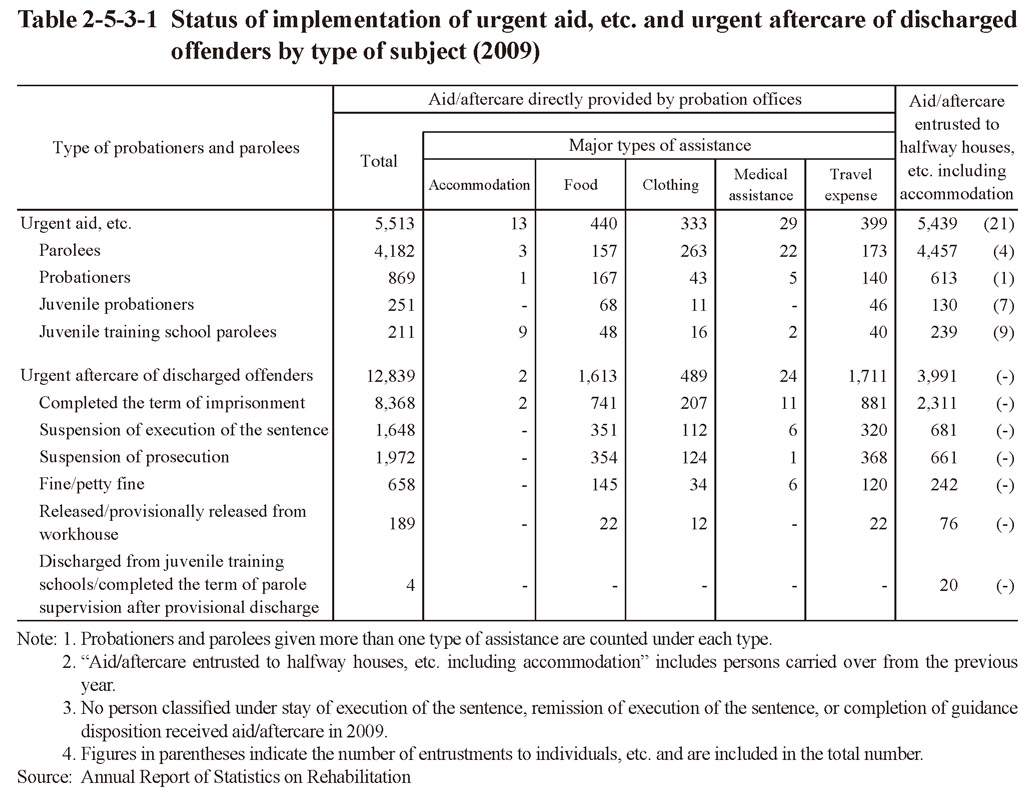
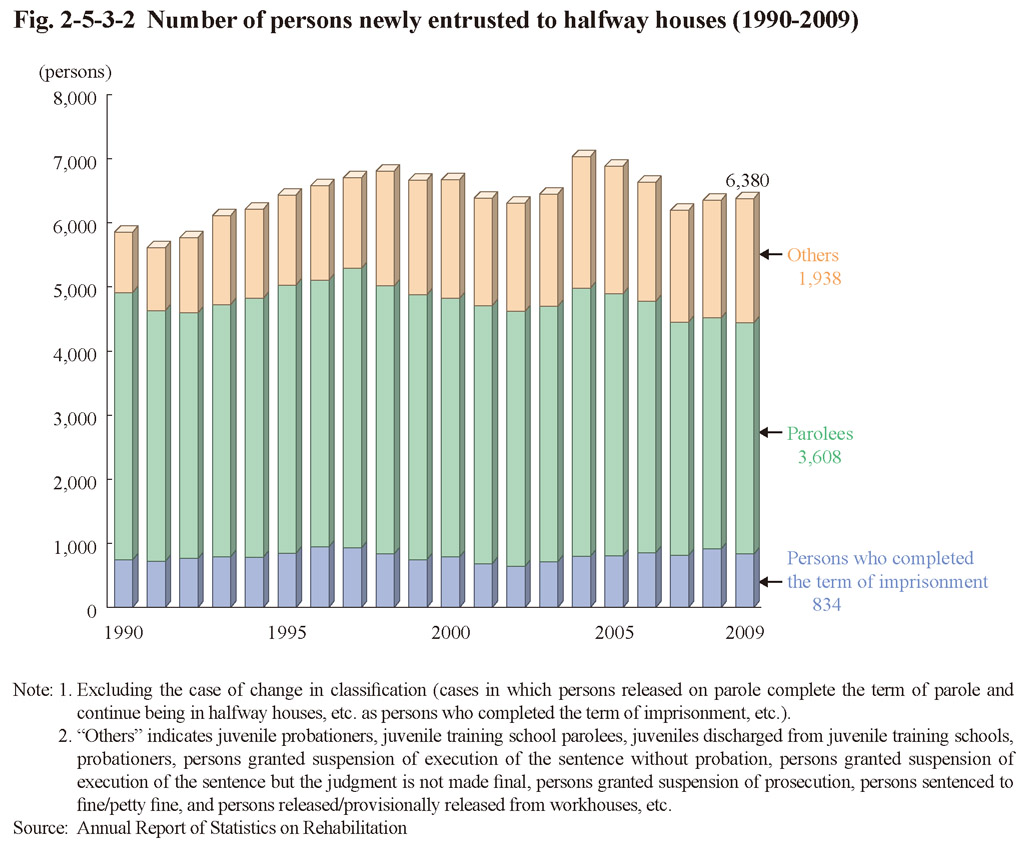 Fig. 2-5-3-2 Number of persons newly entrusted to halfway houses (1990-2009)
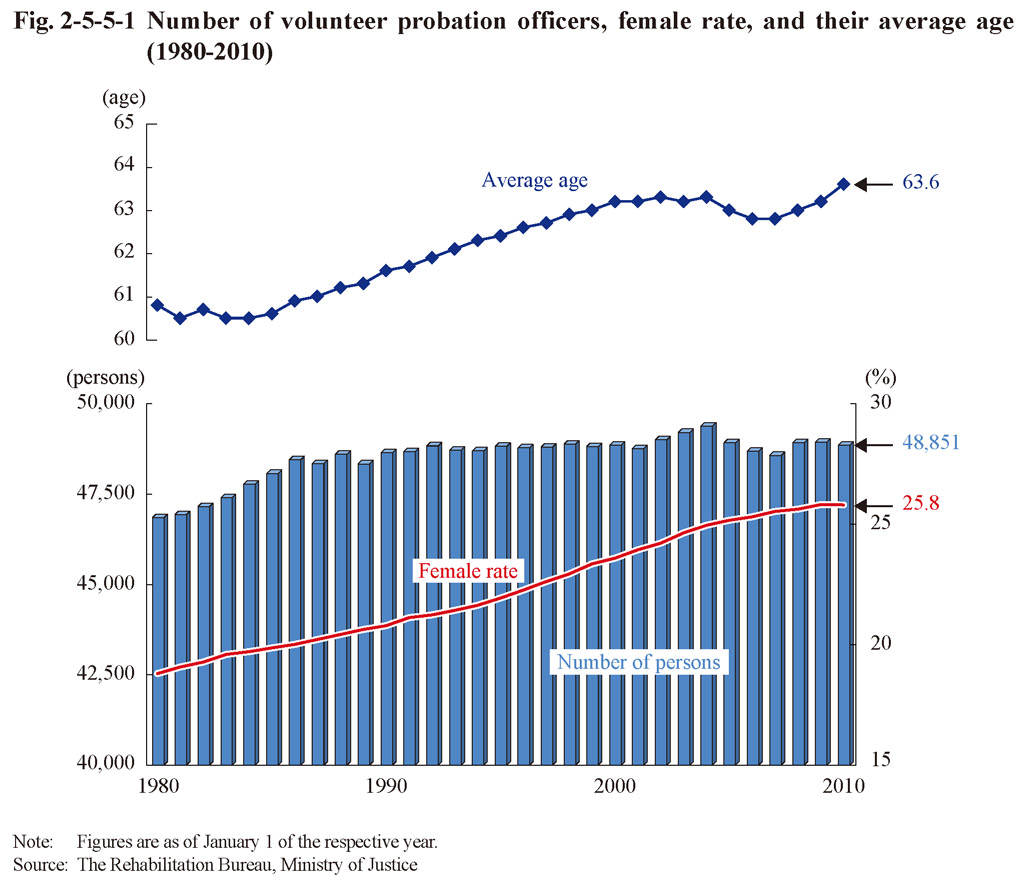 Fig. 2-5-5-1 Number of volunteer probation officers, female rate, and their average age
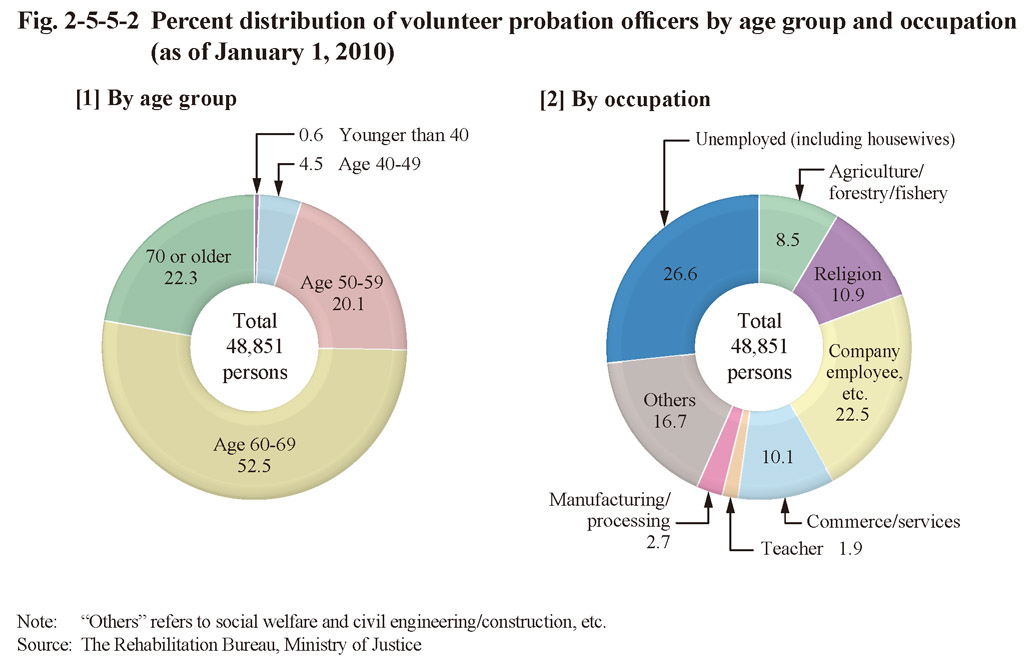
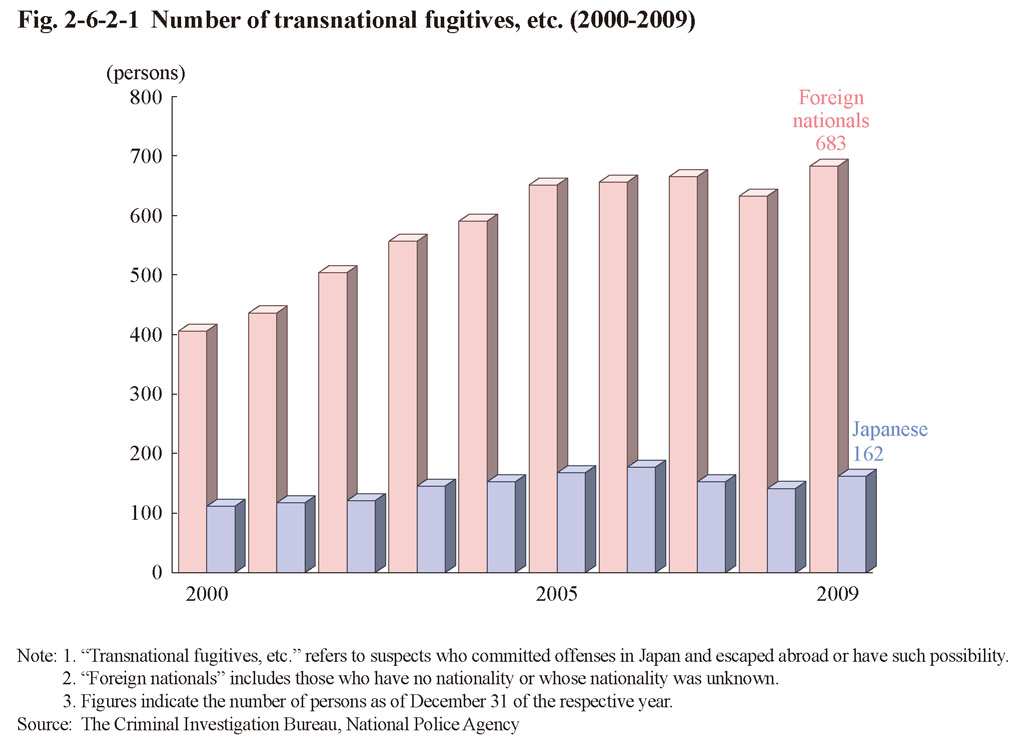 Fig. 2-6-2-1 Number of transnational fugitives, etc. (2000-2009)
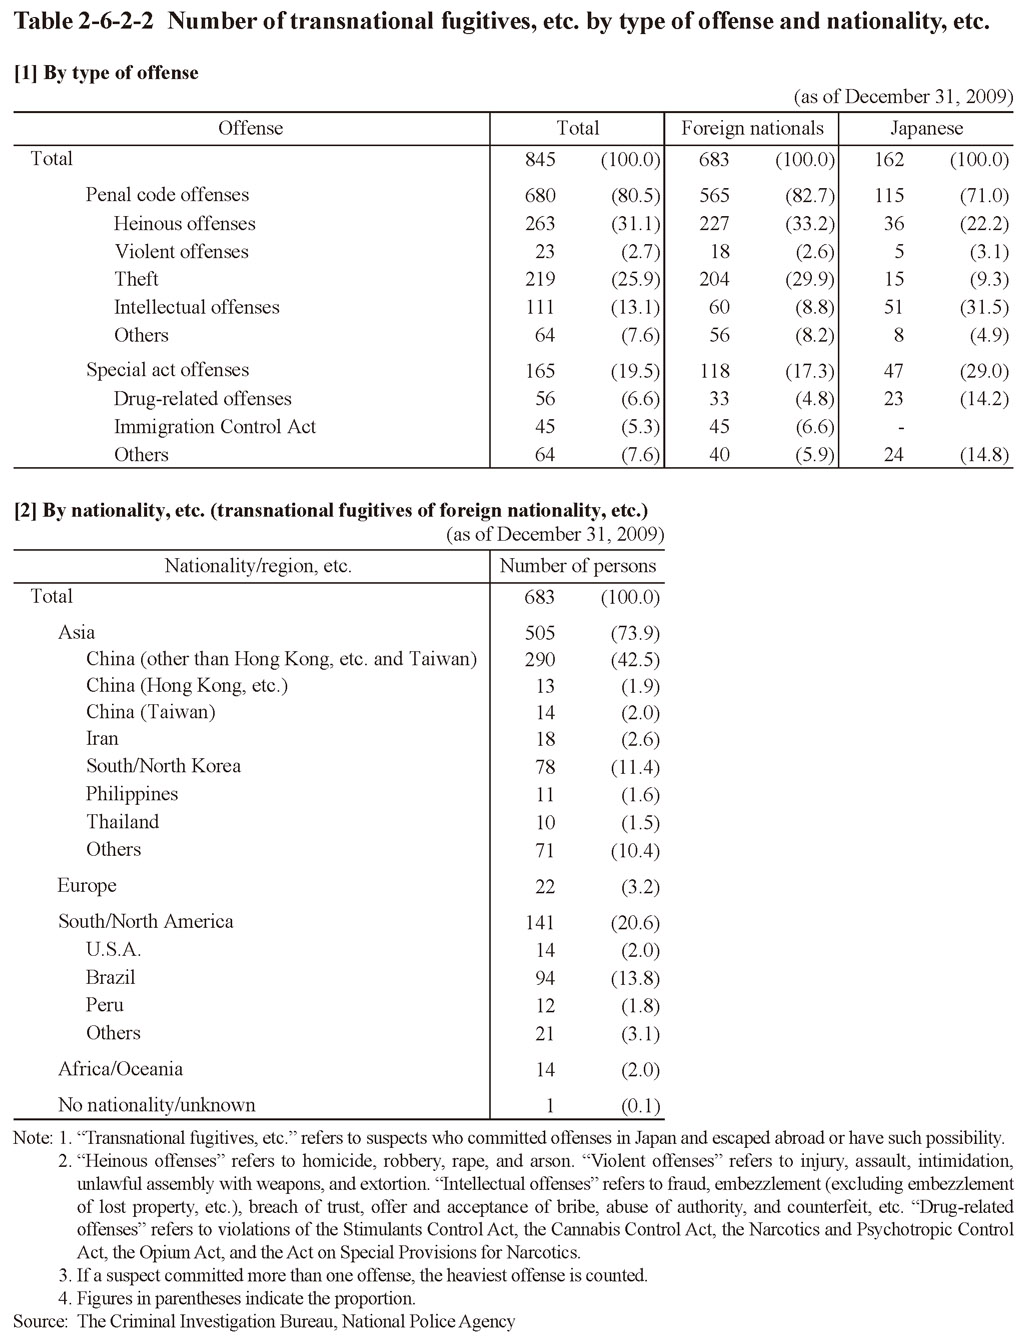 Table 2-6-2-2 Number of transnational fugitives, etc. by type of offense and nationality, etc.
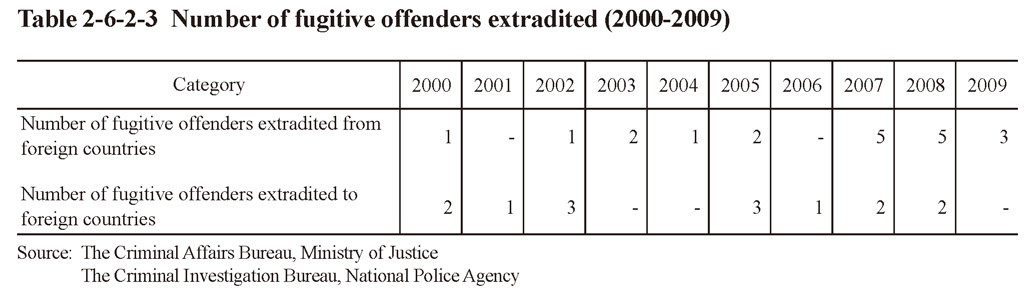 Table 2-6-2-3 Number of fugitive offenders extradited (2000-2009)
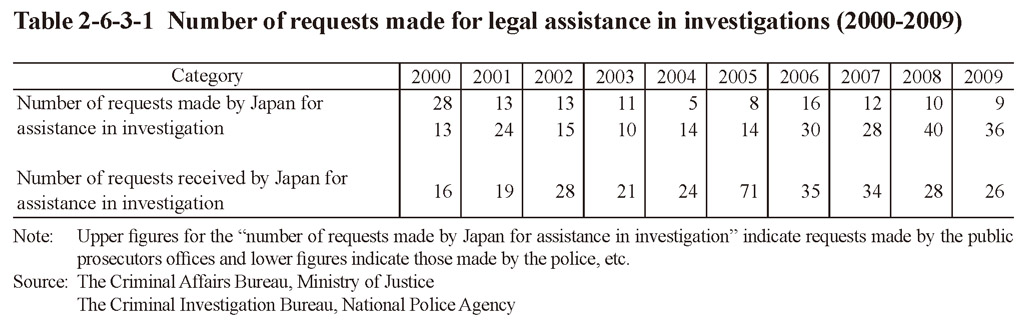 Table 2-6-3-1 Number of requests made for legal assistance in investigations (2000-2009)
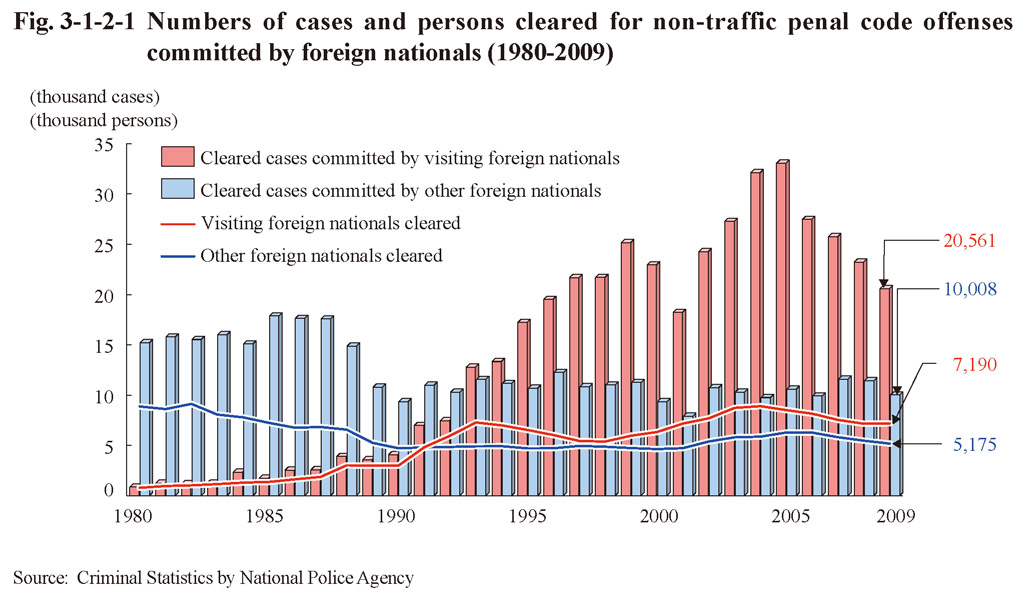
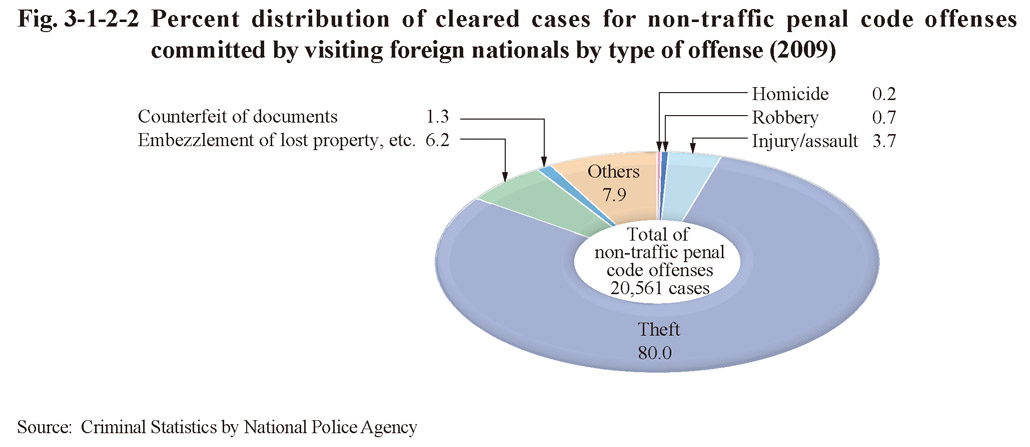
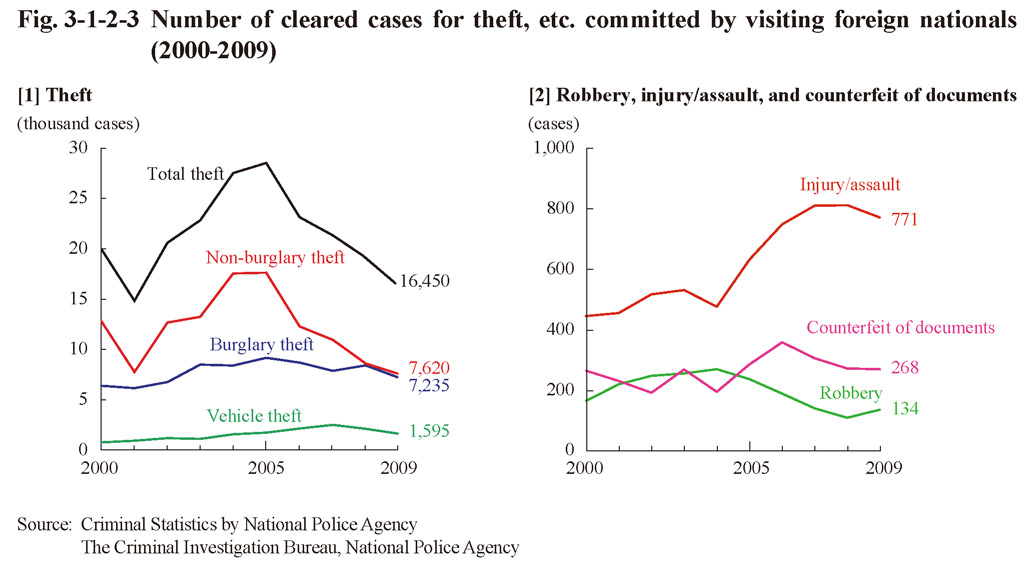
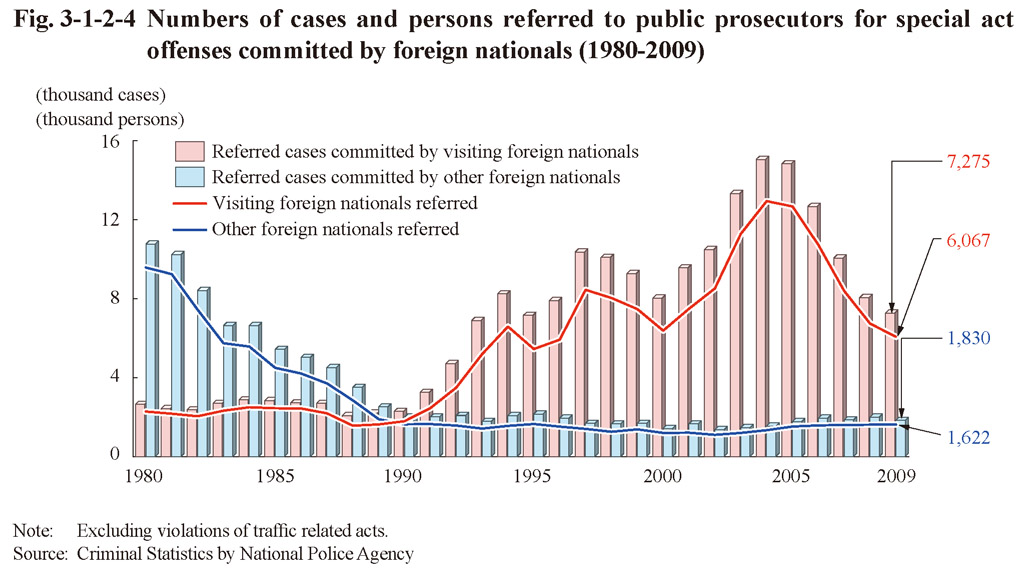
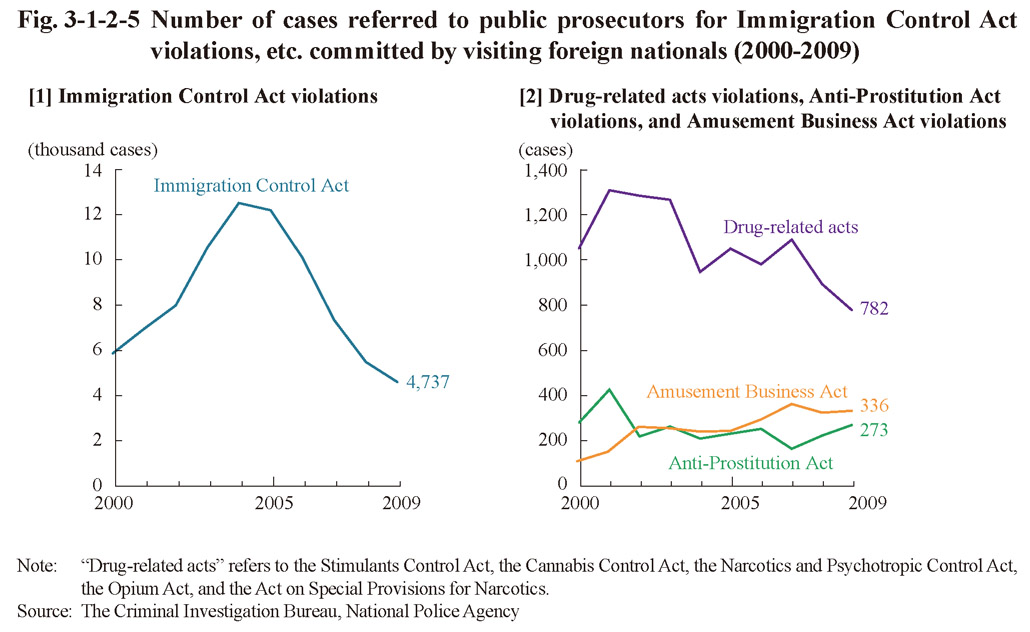
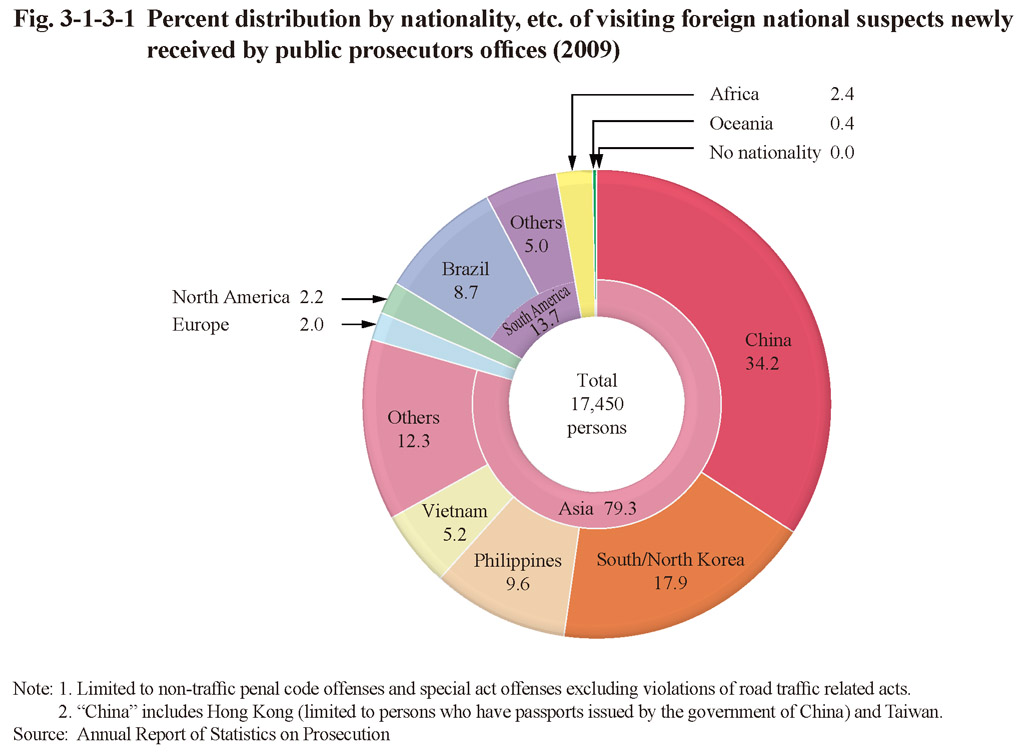

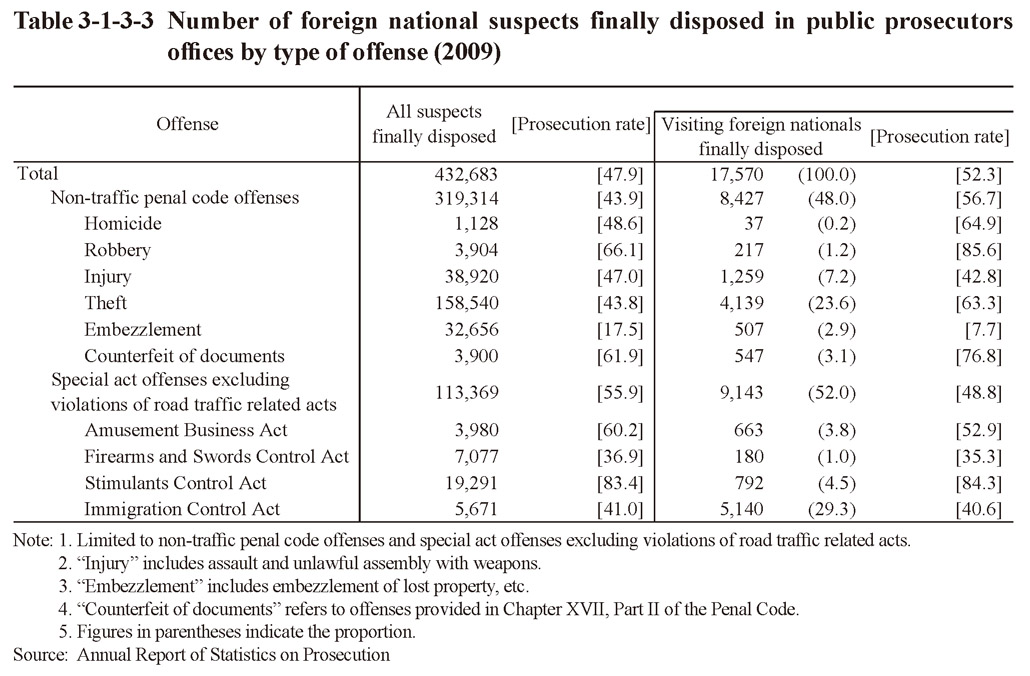
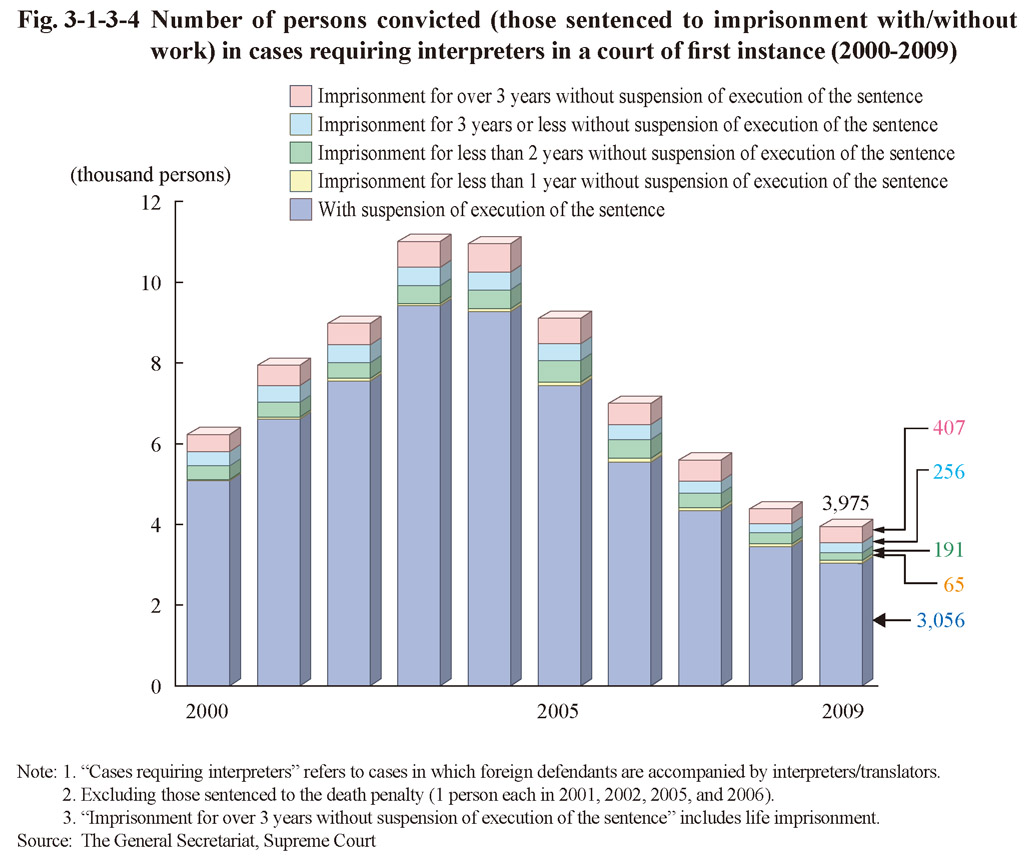
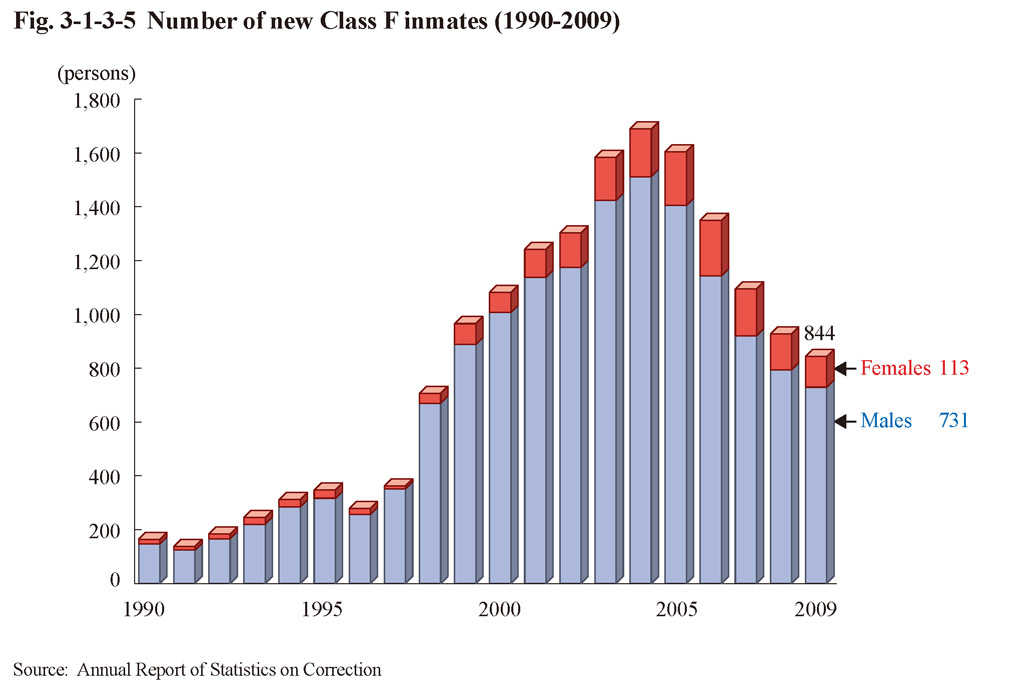 Fig. 3-1-3-5 Number of new Class F inmates (1990-2009)
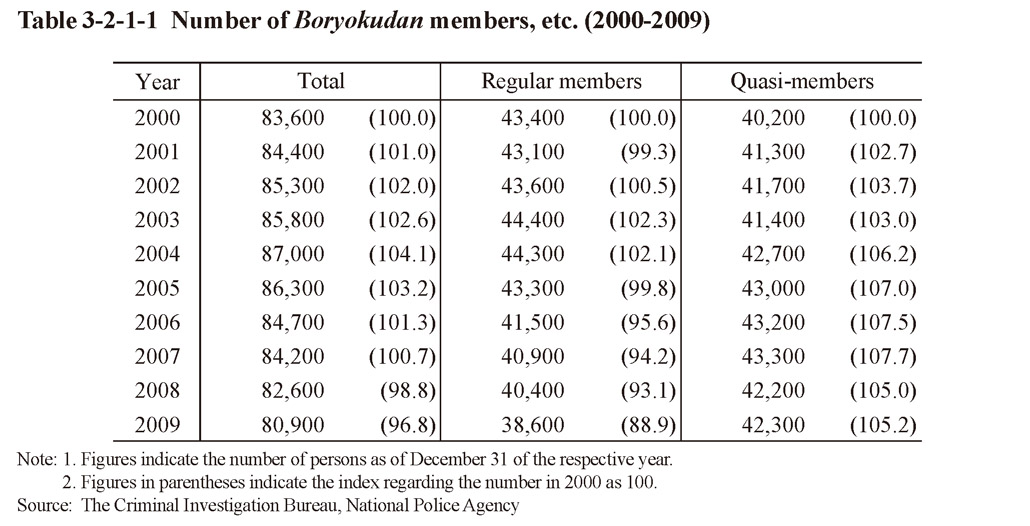 Table 3-2-1-1 Number of Boryokudan members, etc. (2000-2009)
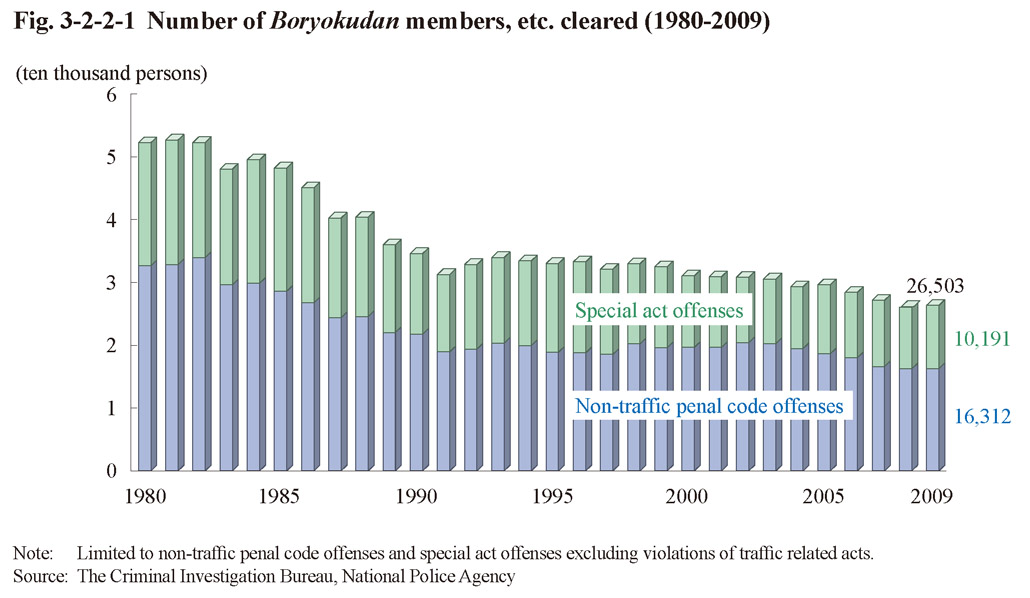 Fig. 3-2-2-1 Number of Boryokudan members, etc. cleared (1980-2009)
 Table 3-2-2-2 Number of Boryokudan members cleared by type of offense (2009)
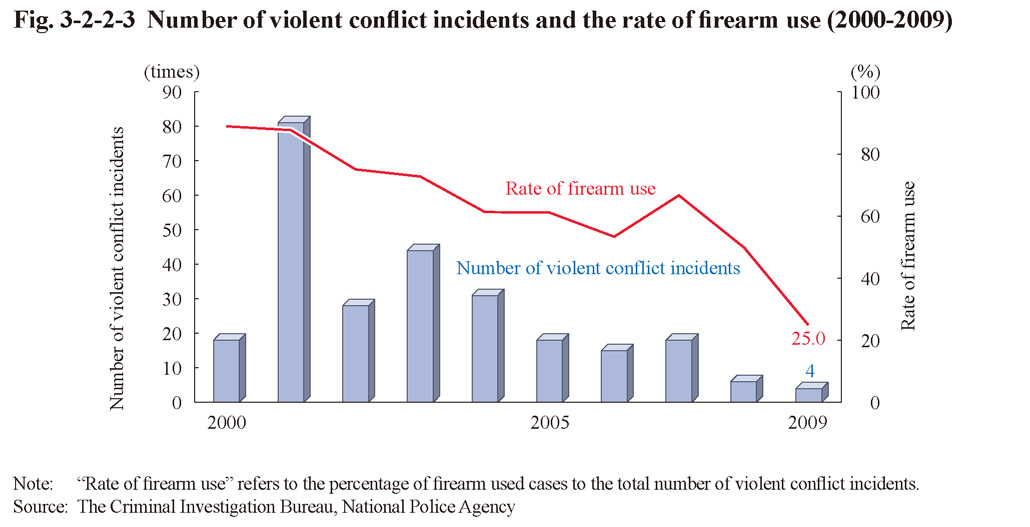 Fig. 3-2-2-3 Number of violent confl ict incidents and the rate of firearm use (2000-2009)
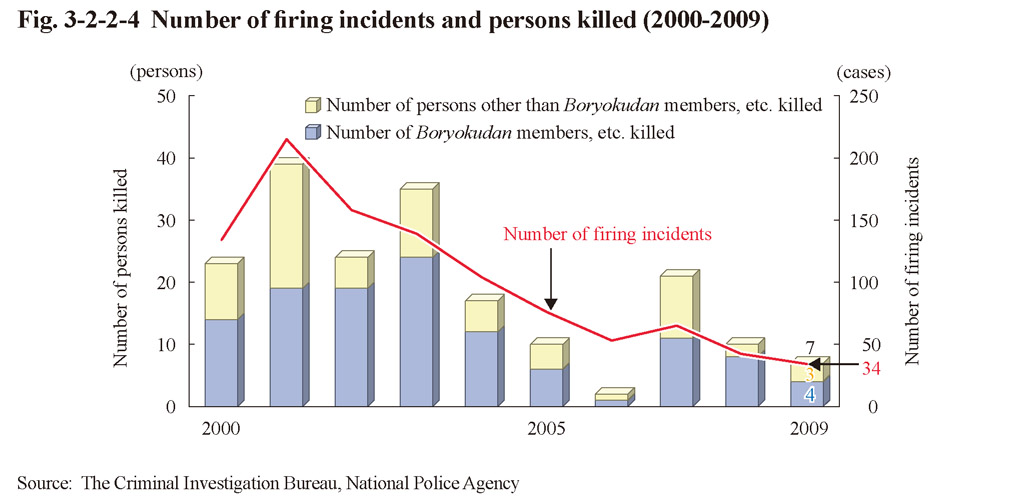 Fig. 3-2-2-4 Number of firing incidents and persons killed (2000-2009)
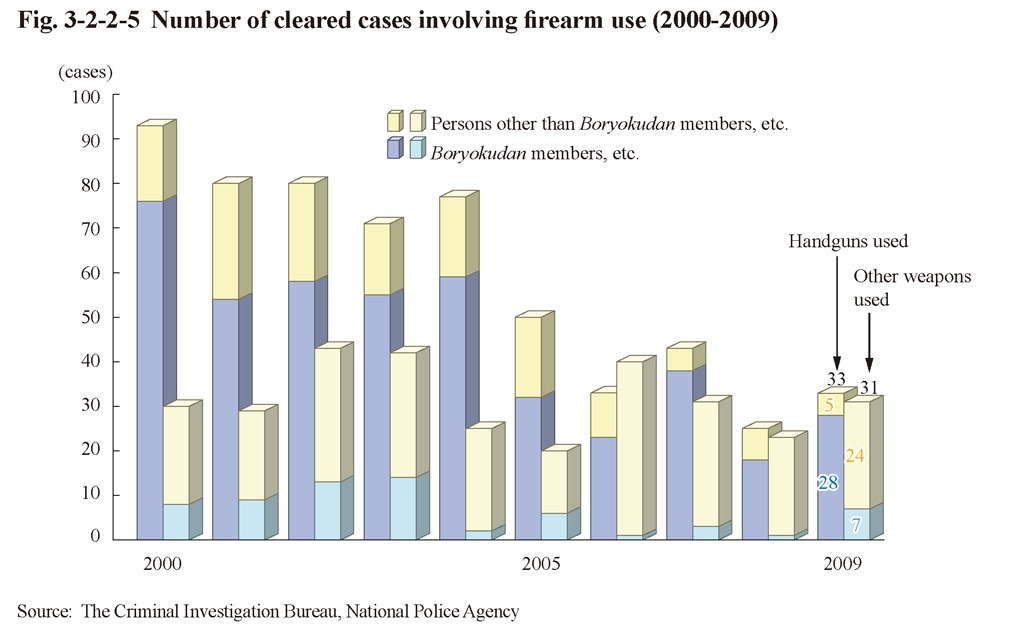 Fig. 3-2-2-5 Number of cleared cases involving firearm use (2000-2009)
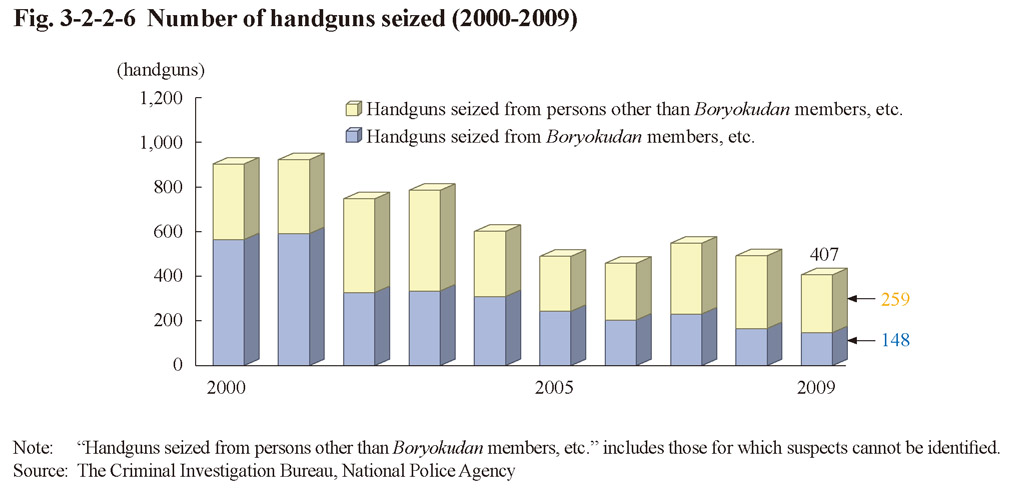 Fig. 3-2-2-6 Number of handguns seized (2000-2009)
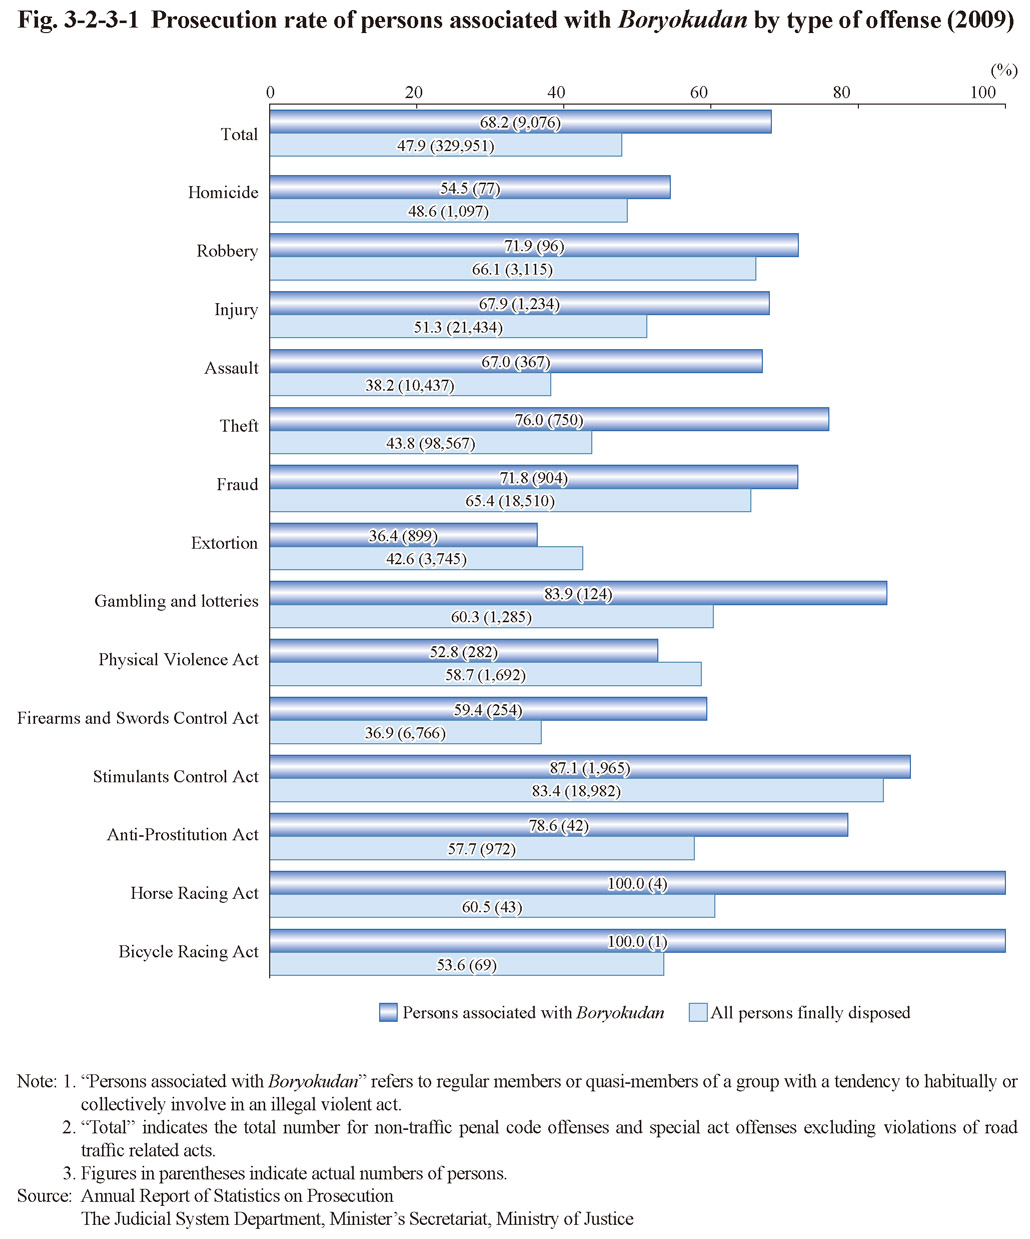 Fig. 3-2-3-1 Prosecution rate of persons associated with Boryokudan by type of offense (2009)
 Fig. 3-2-3-2 Number of new inmates associated with Boryokudan (1980-2009)
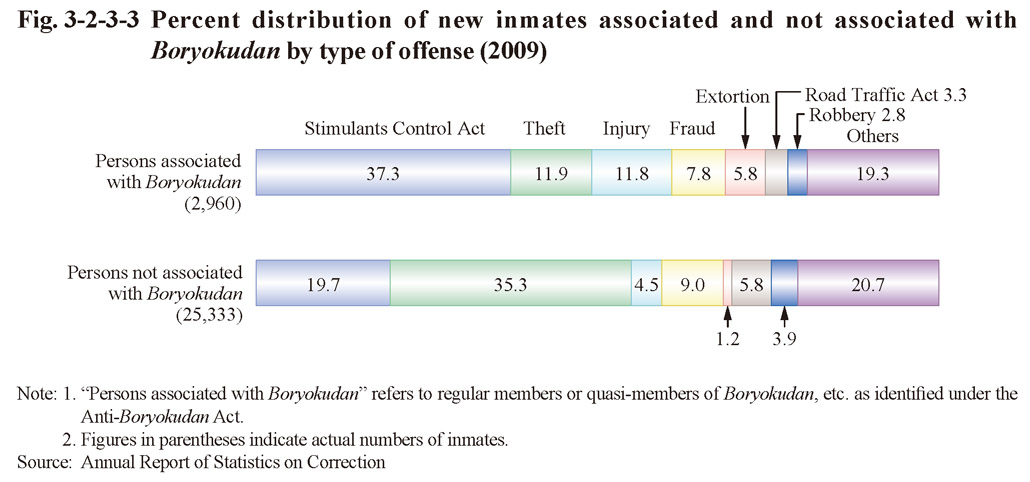
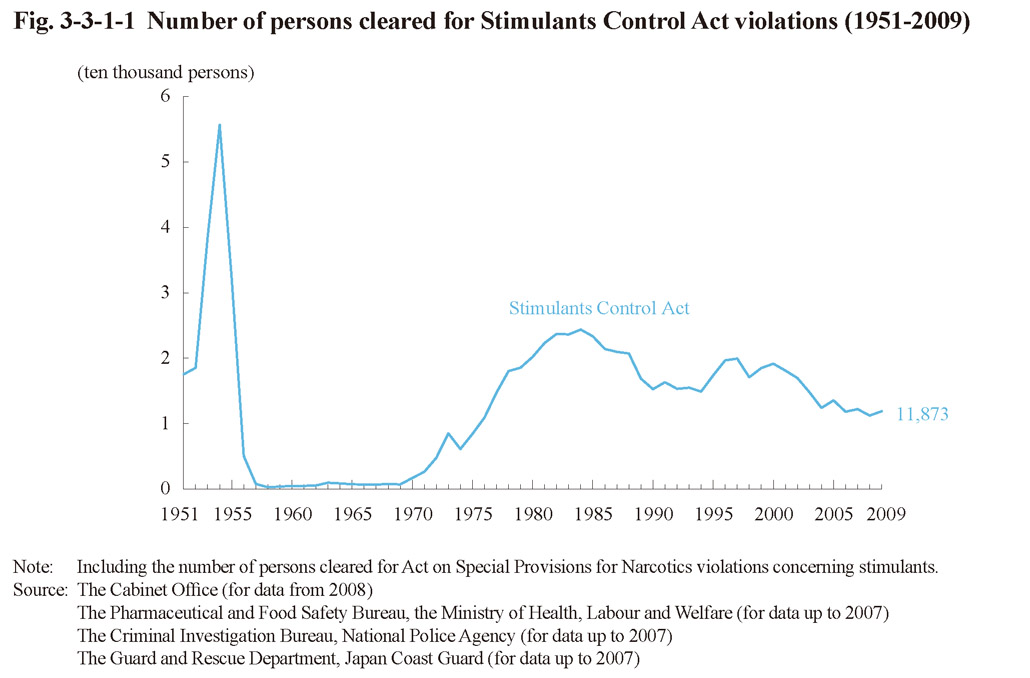 Fig. 3-3-1-1 Number of persons cleared for Stimulants Control Act violations (1951-2009)
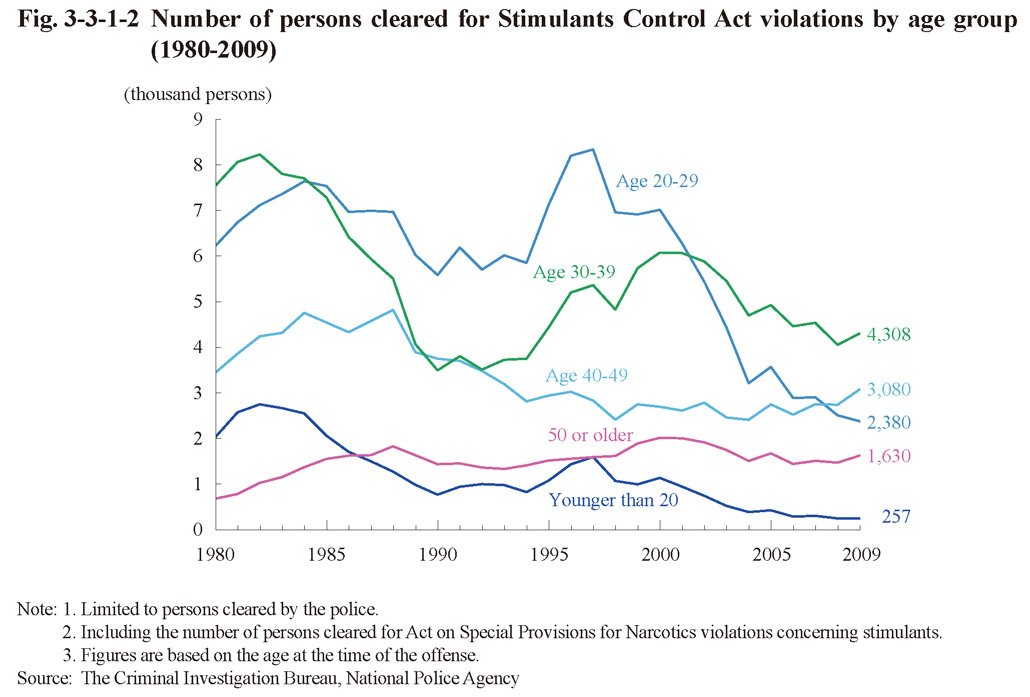

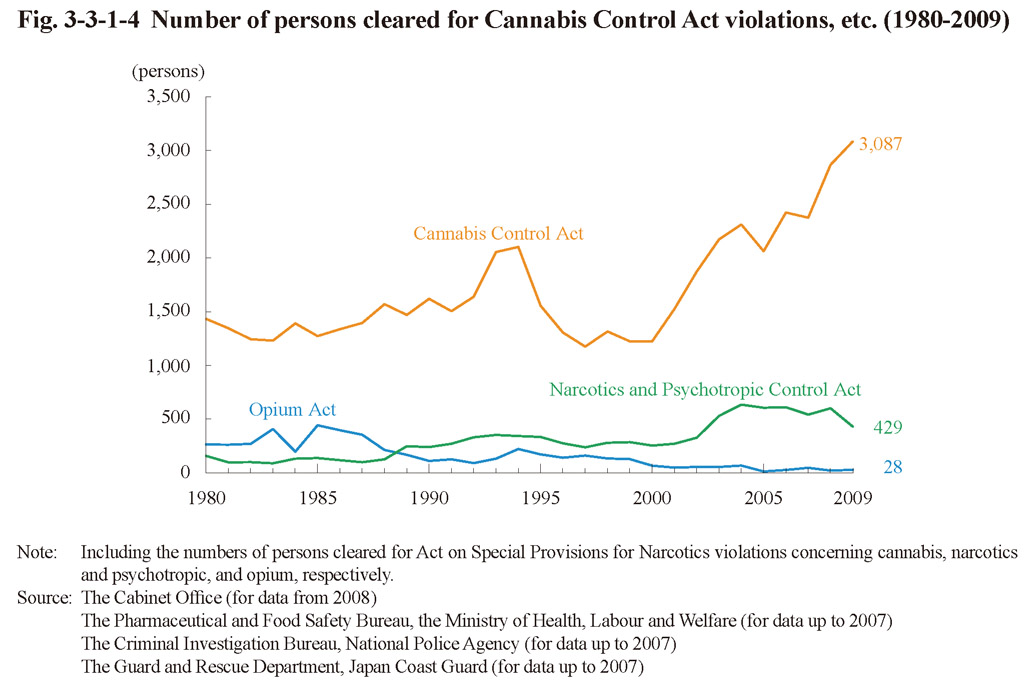 Fig. 3-3-1-4 Number of persons cleared for Cannabis Control Act violations, etc. (1980-2009)
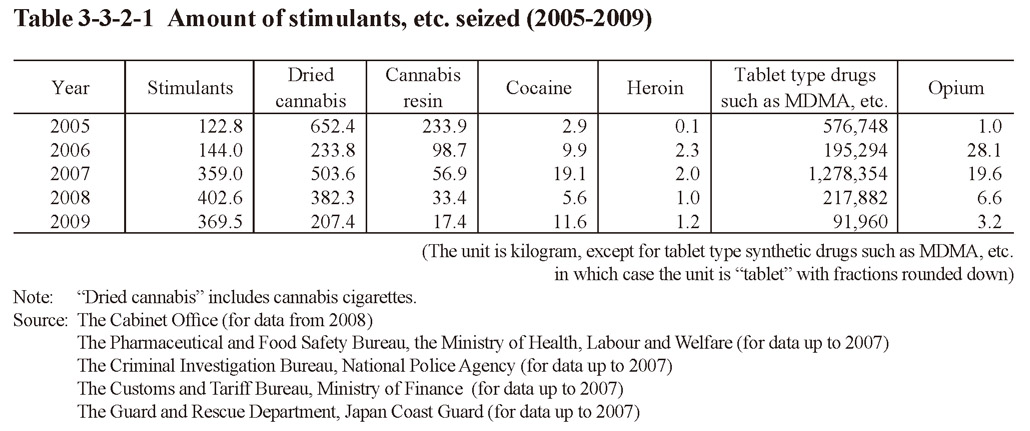 Table 3-3-2-1 Amount of stimulants, etc. seized (2005-2009)
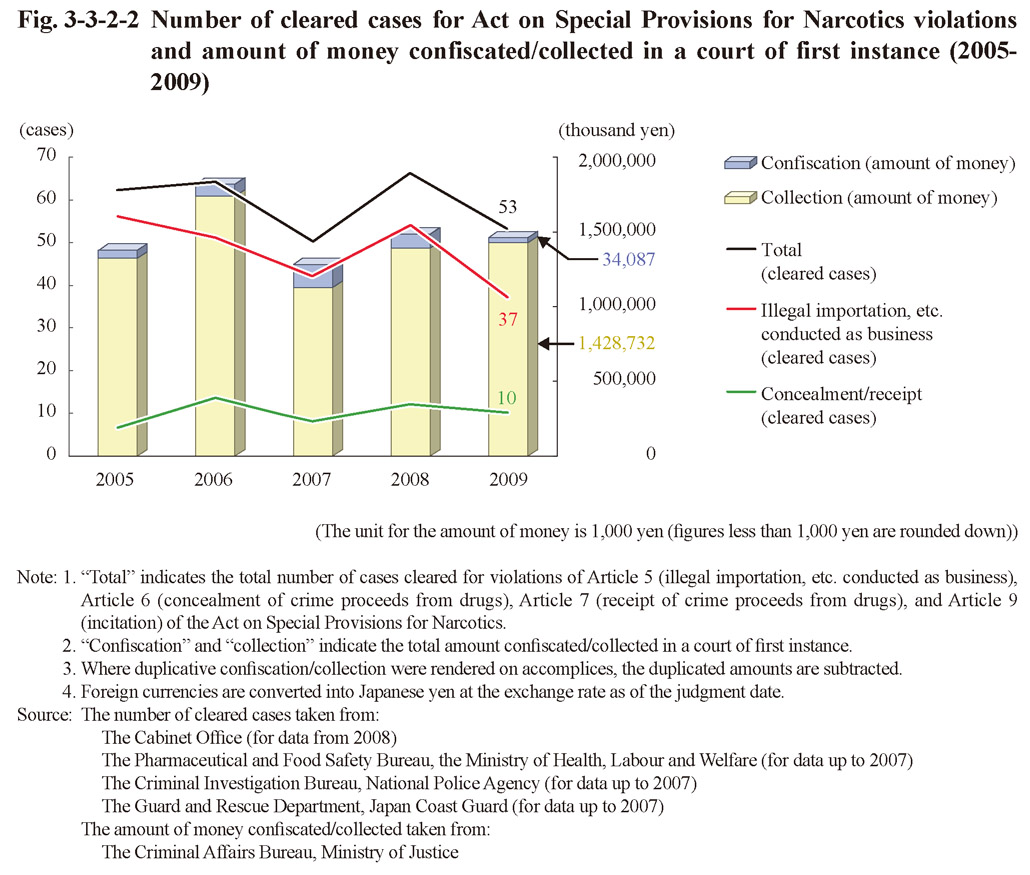
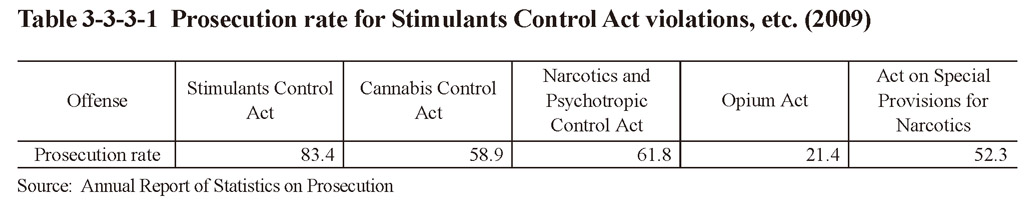 Table 3-3-3-1 Prosecution rate for Stimulants Control Act violations, etc. (2009)
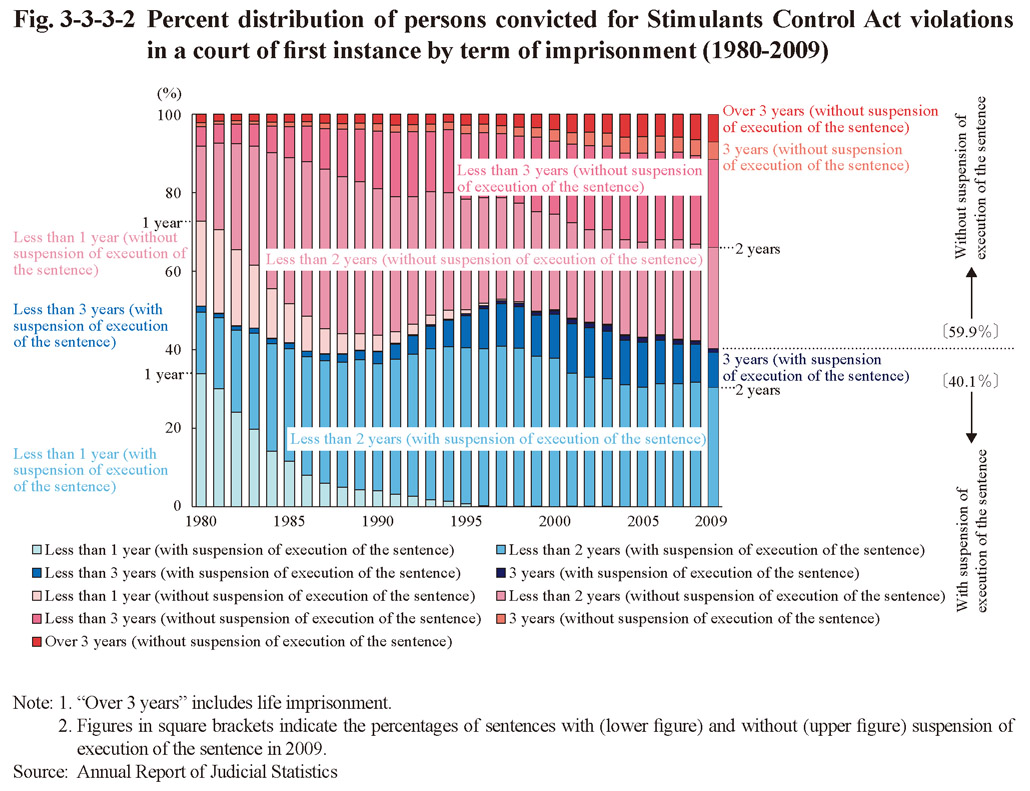
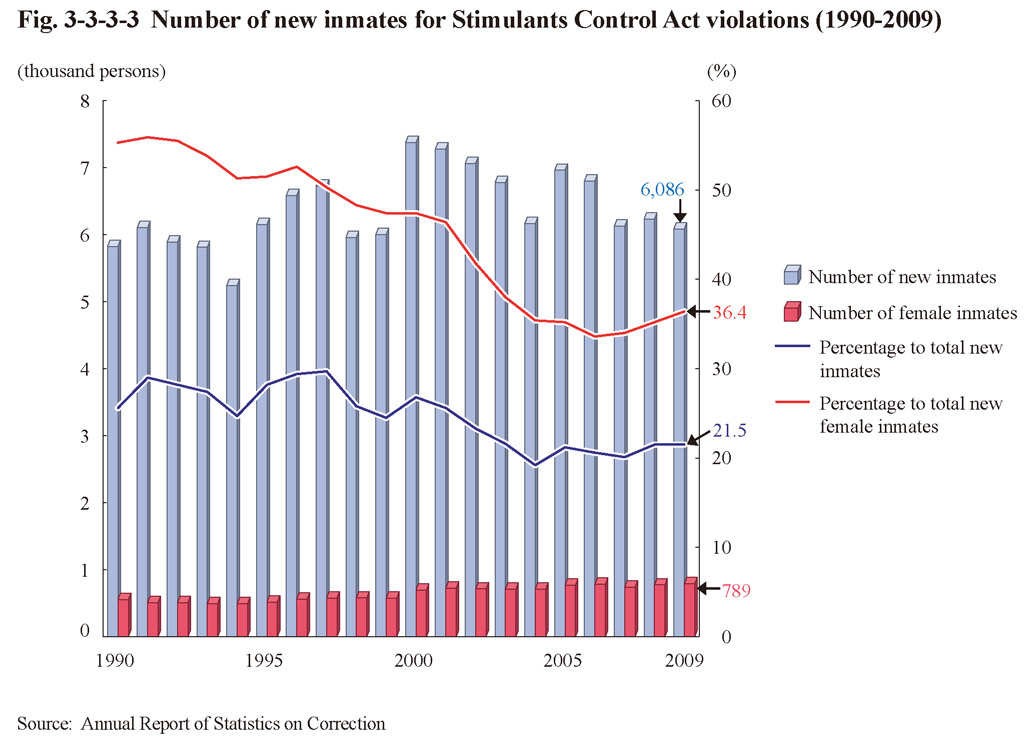 Fig. 3-3-3-3 Number of new inmates for Stimulants Control Act violations (1990-2009)
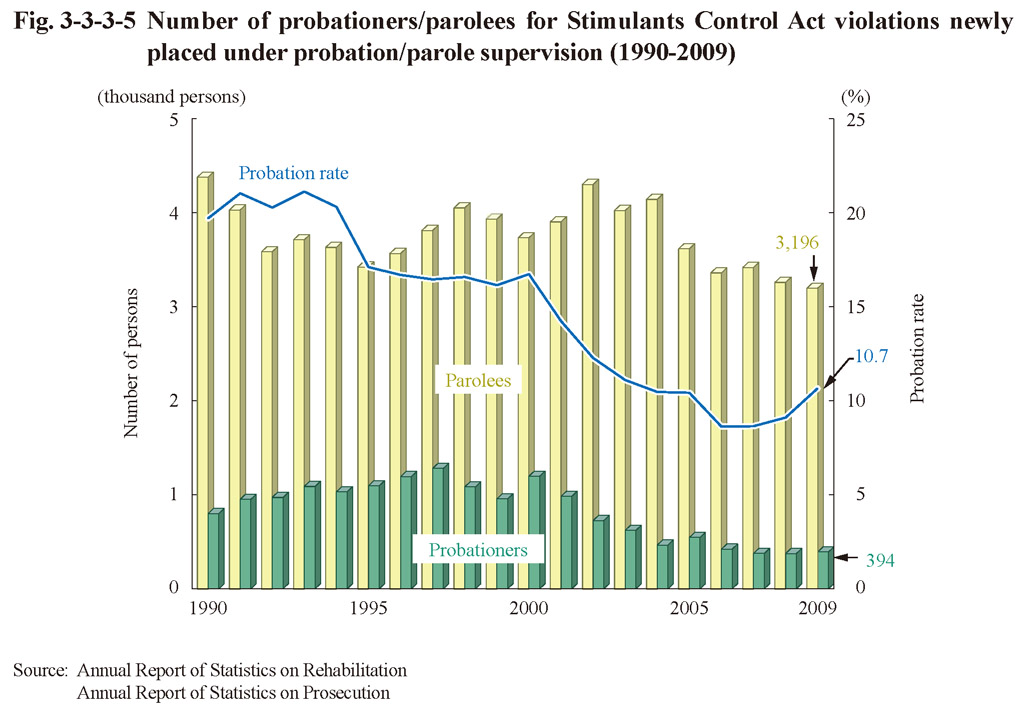
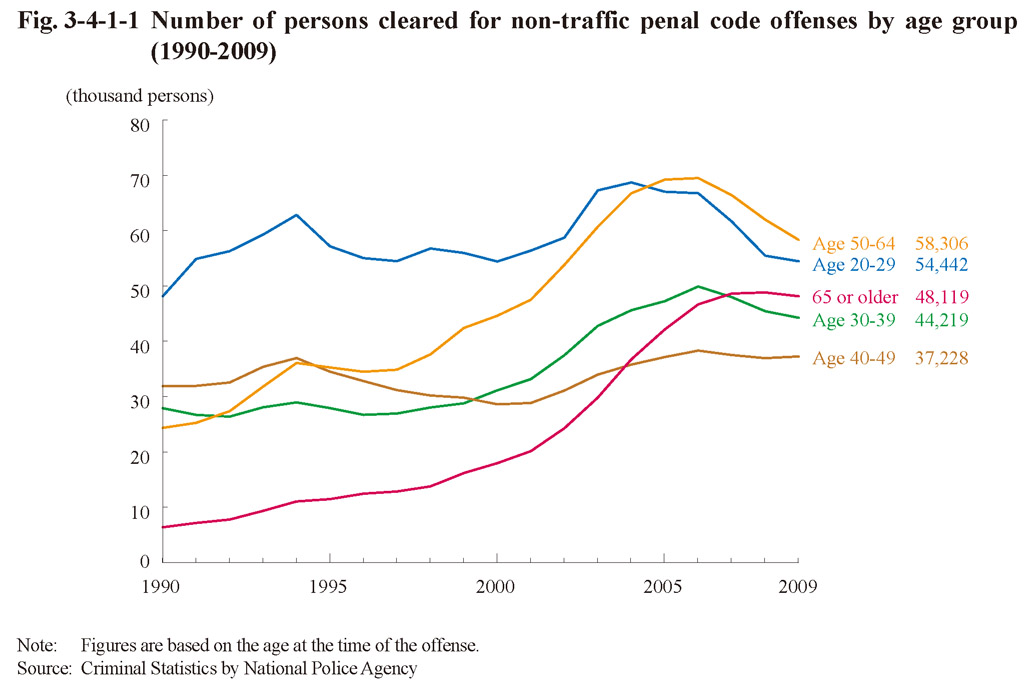 Fig. 3-4-1-1 Number of persons cleared for non-traffic penal code offenses by age group (1990-2009)
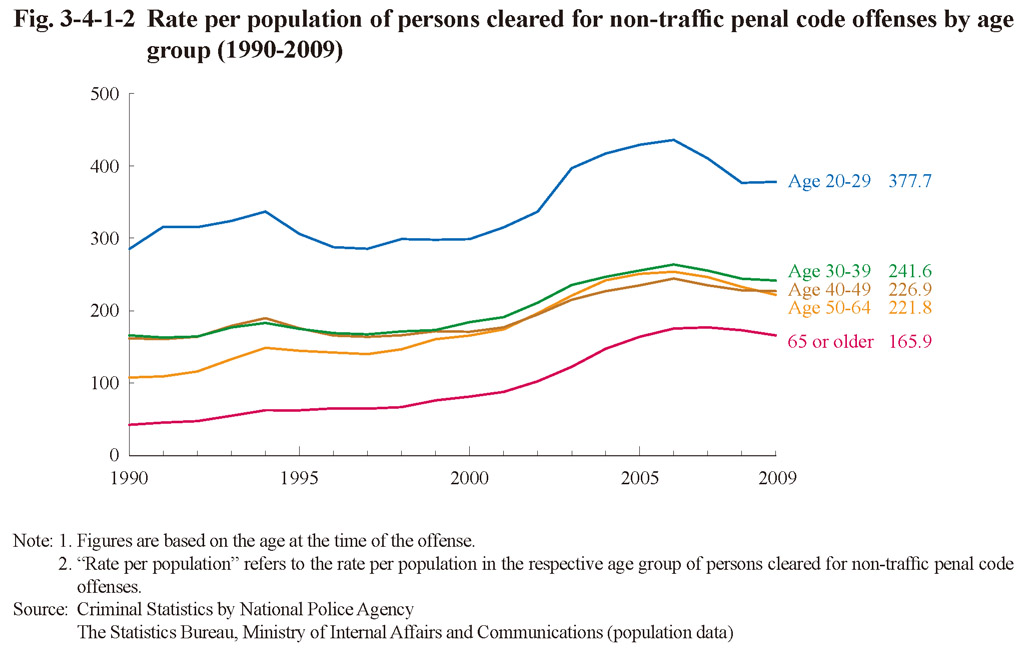
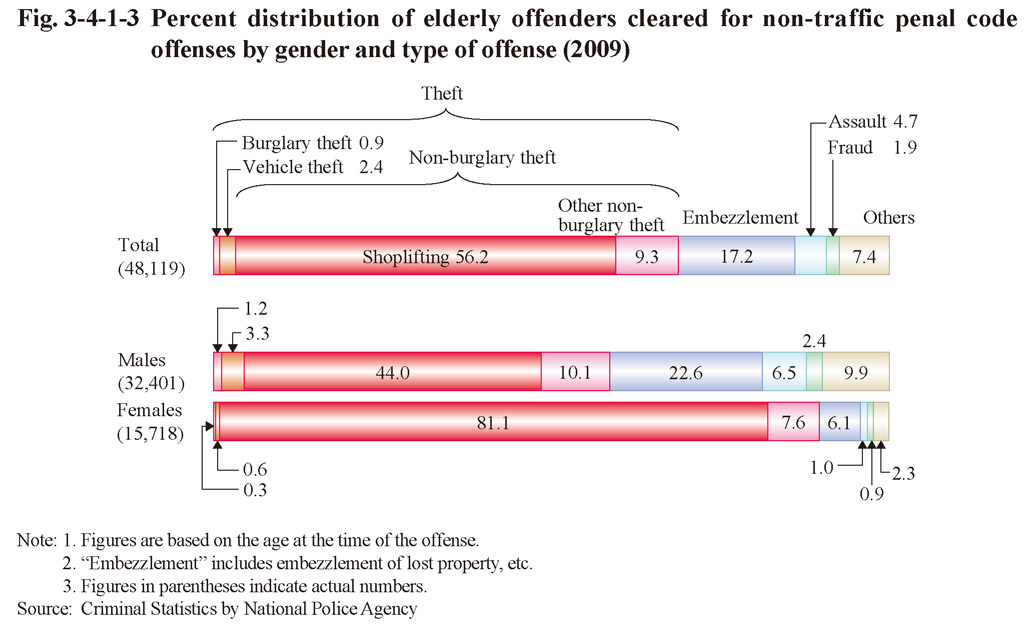
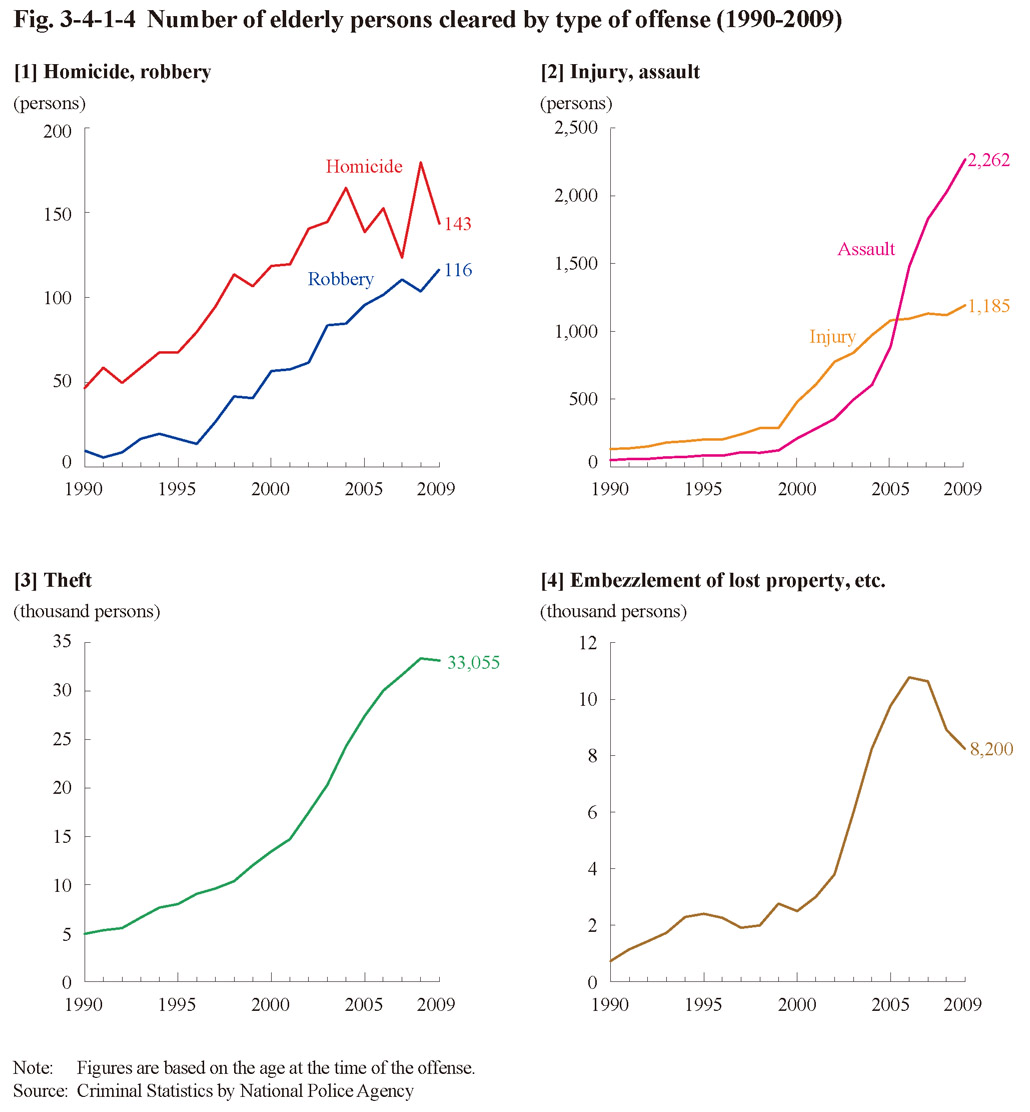 Fig. 3-4-1-4 Number of elderly persons cleared by type of offense (1990-2009)
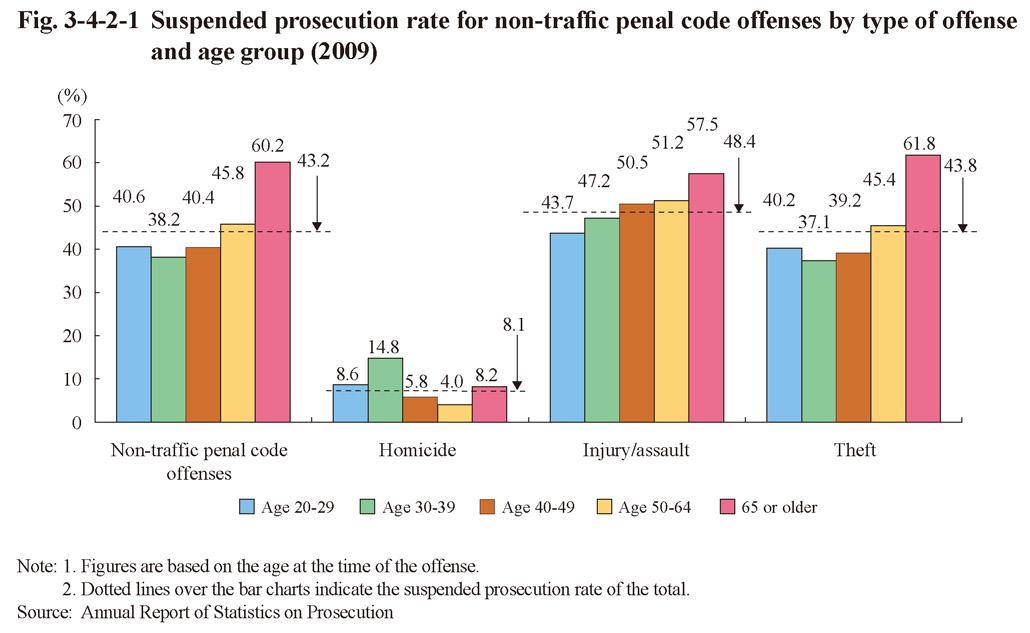
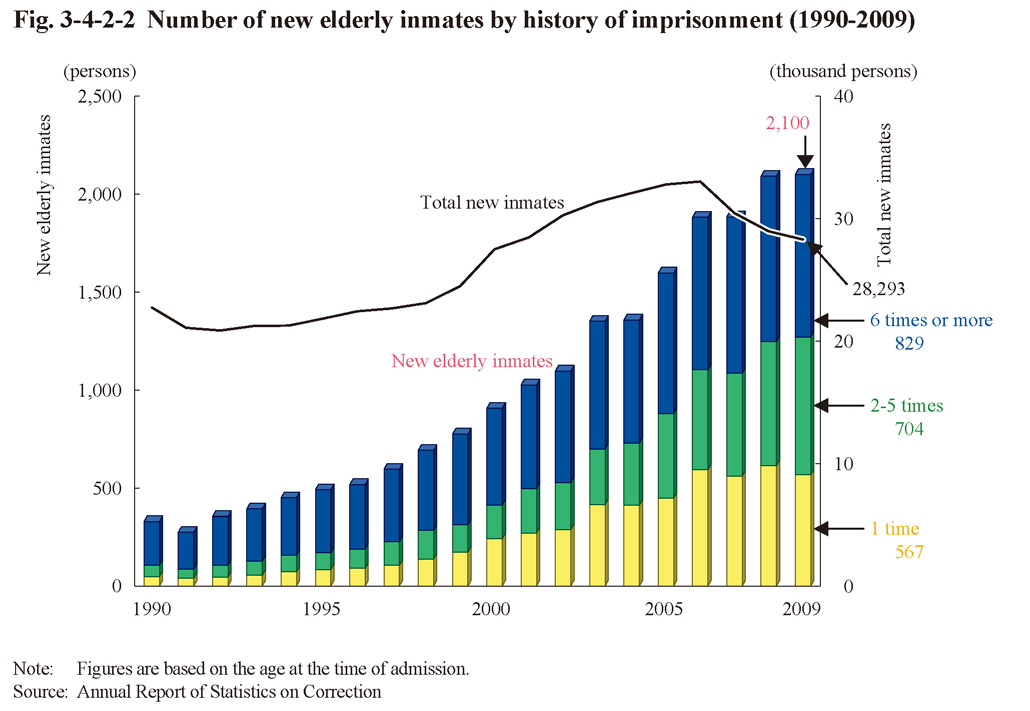 Fig. 3-4-2-2 Number of new elderly inmates by history of imprisonment (1990-2009)
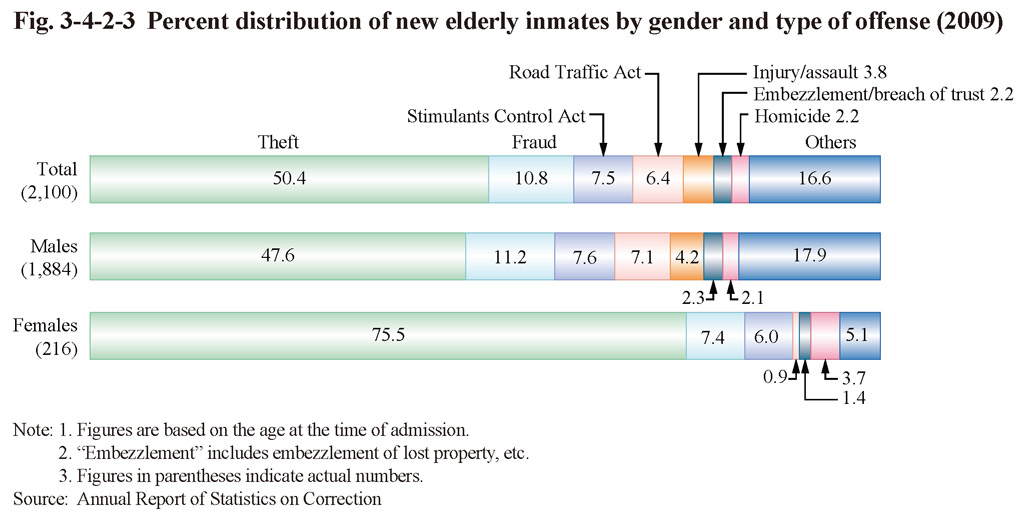 Fig. 3-4-2-3 Percent distribution of new elderly inmates by gender and type of offense (2009)
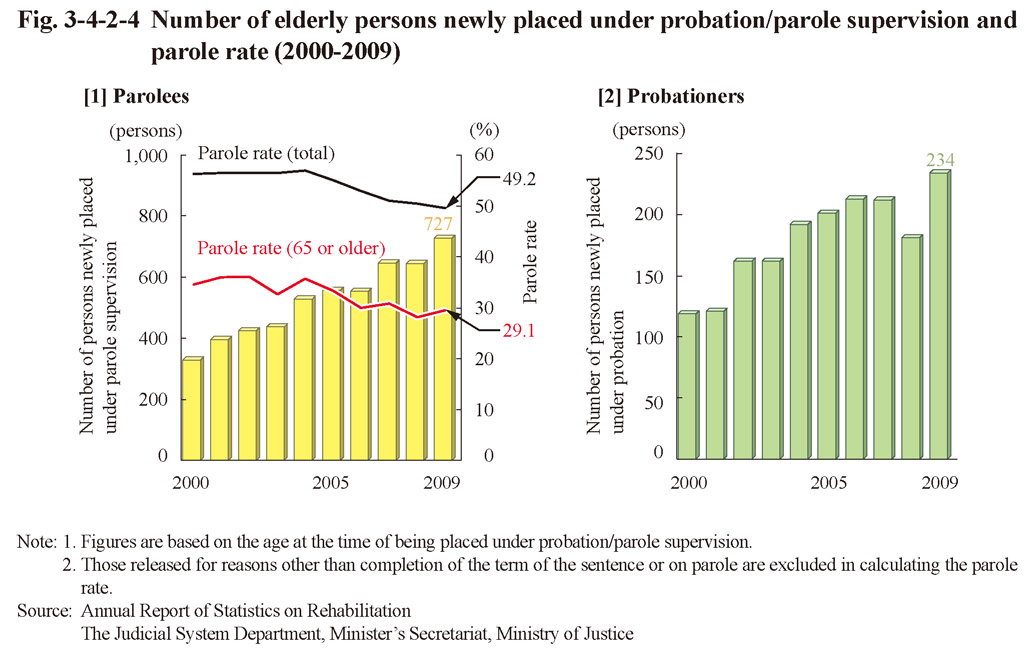
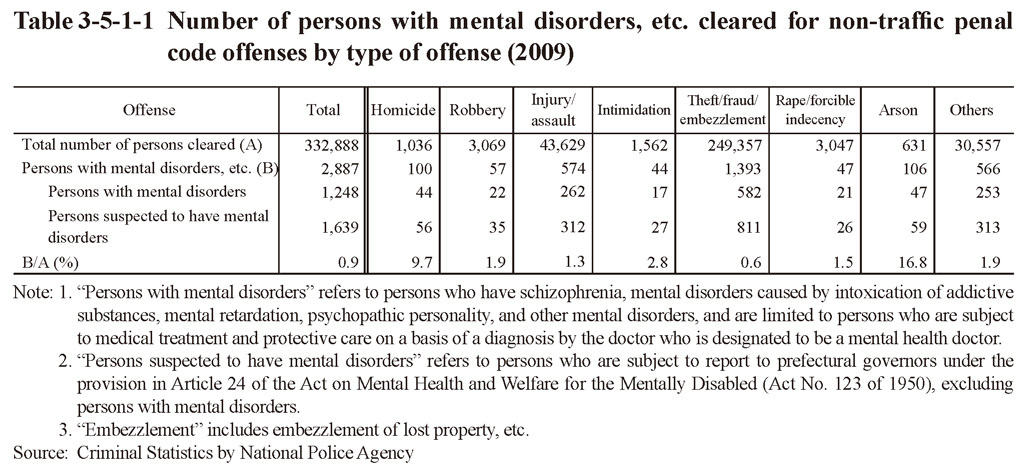

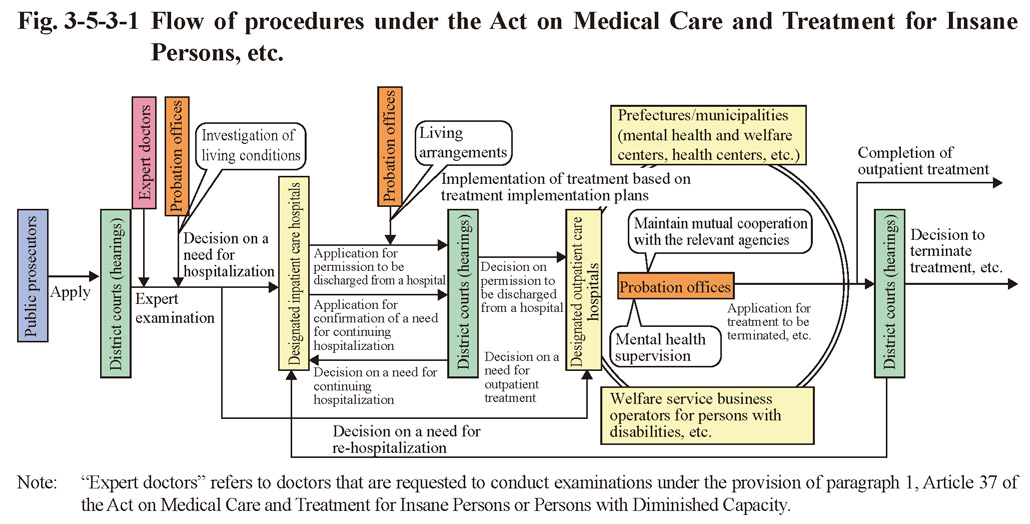 Fig. 3-5-3-1 Flow of procedures under the Act on Medical Care and Treatment for Insane Persons, etc.
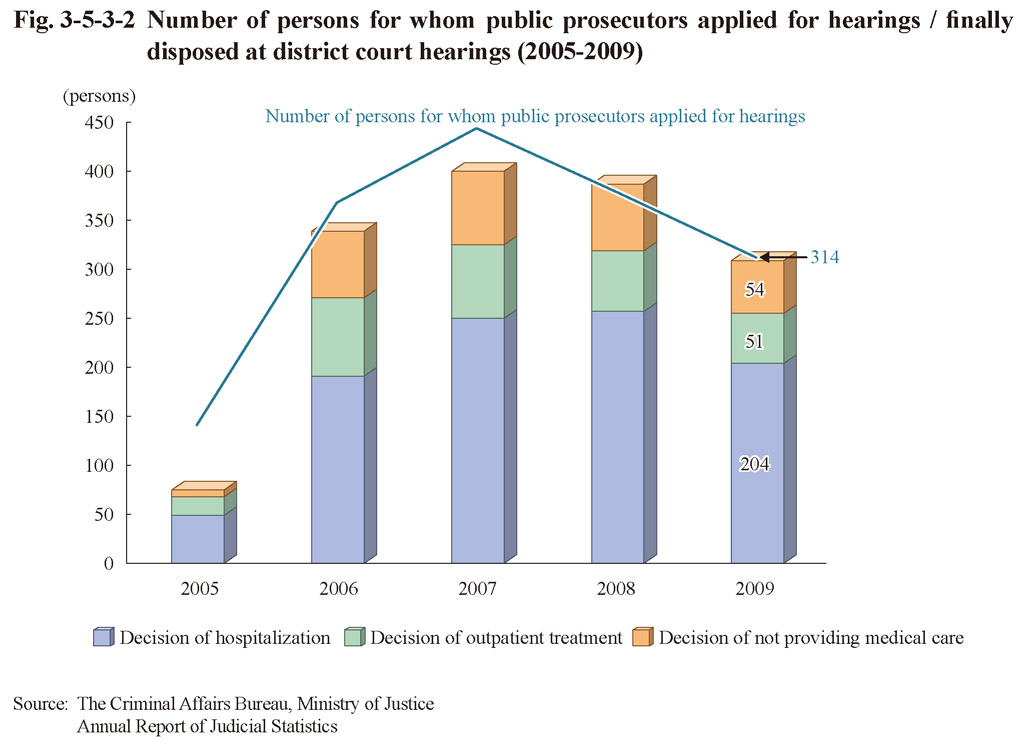
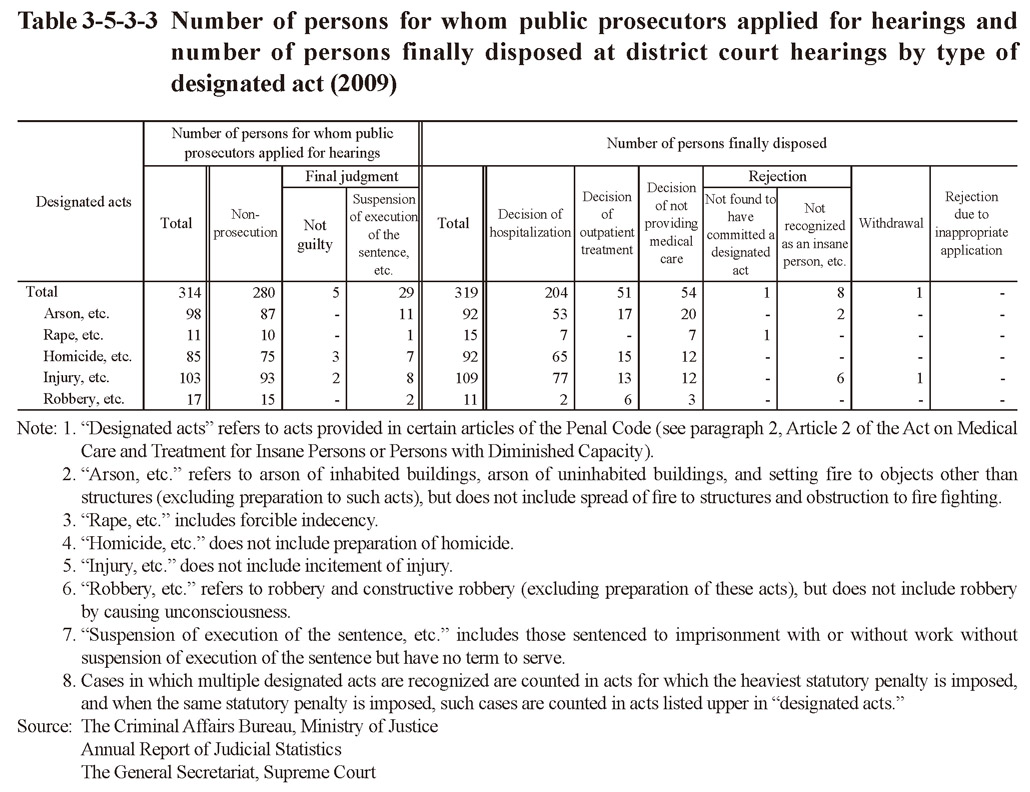
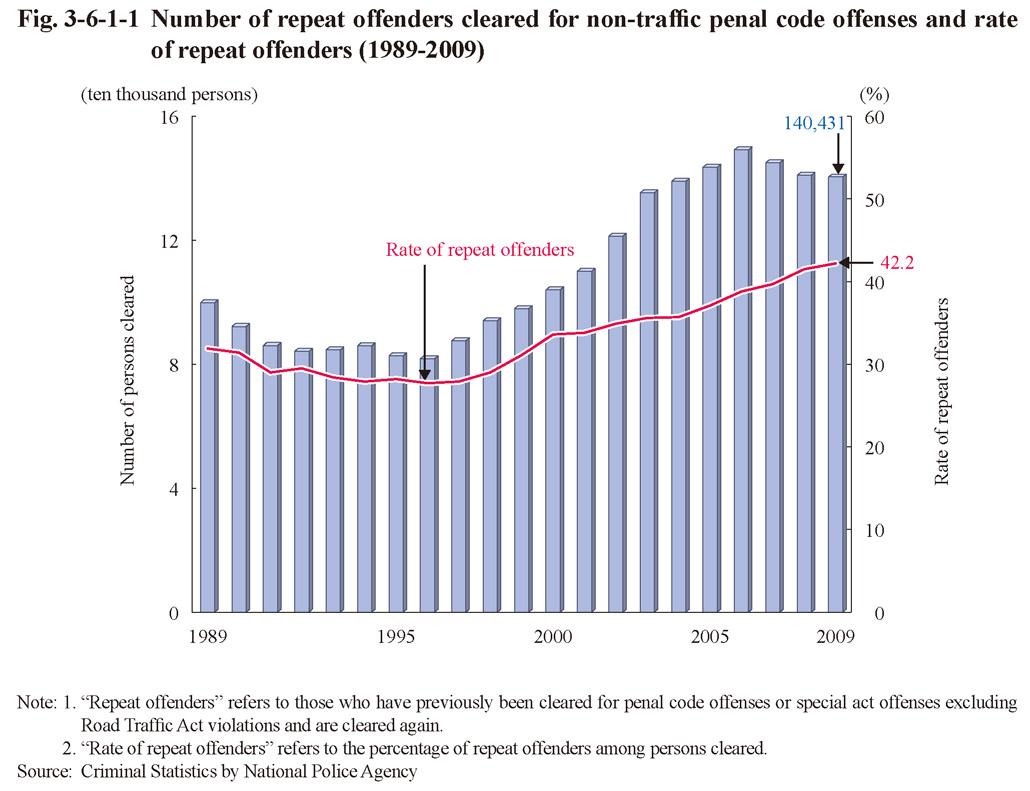
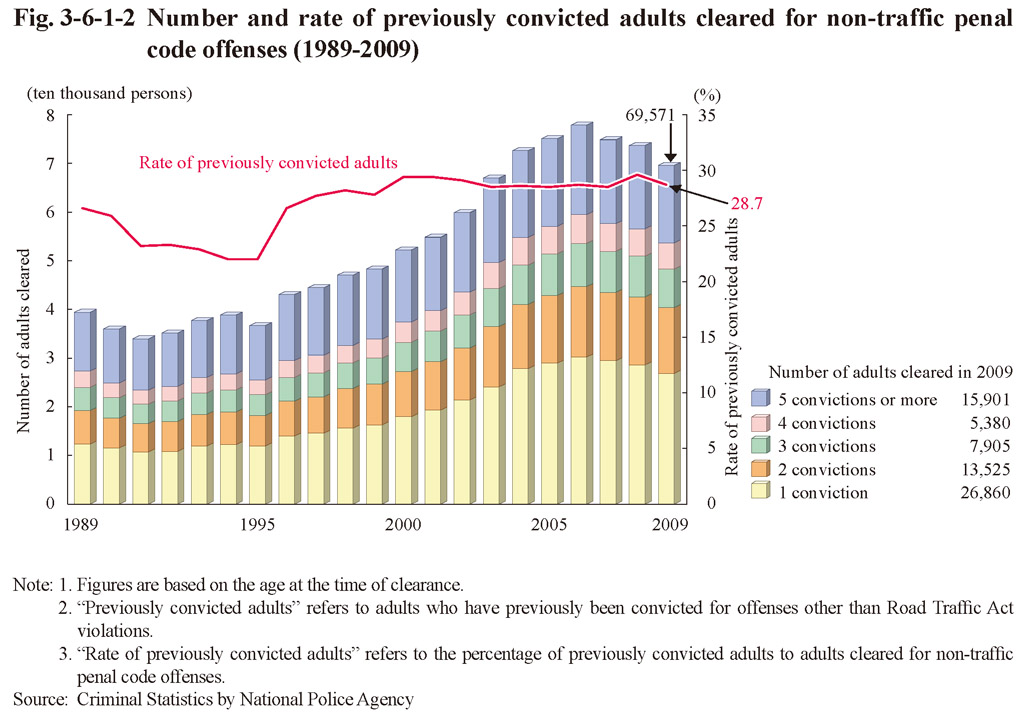
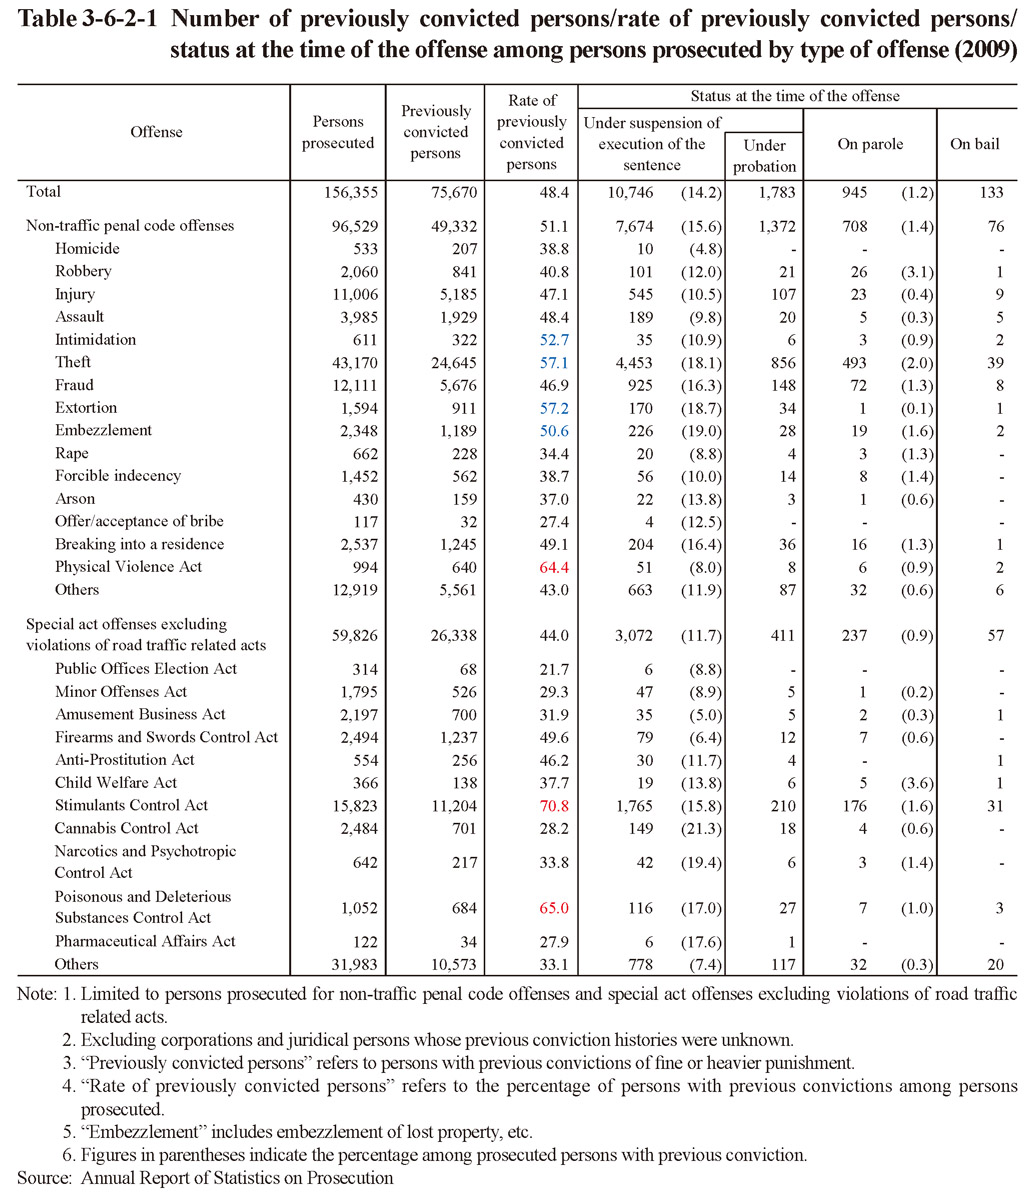
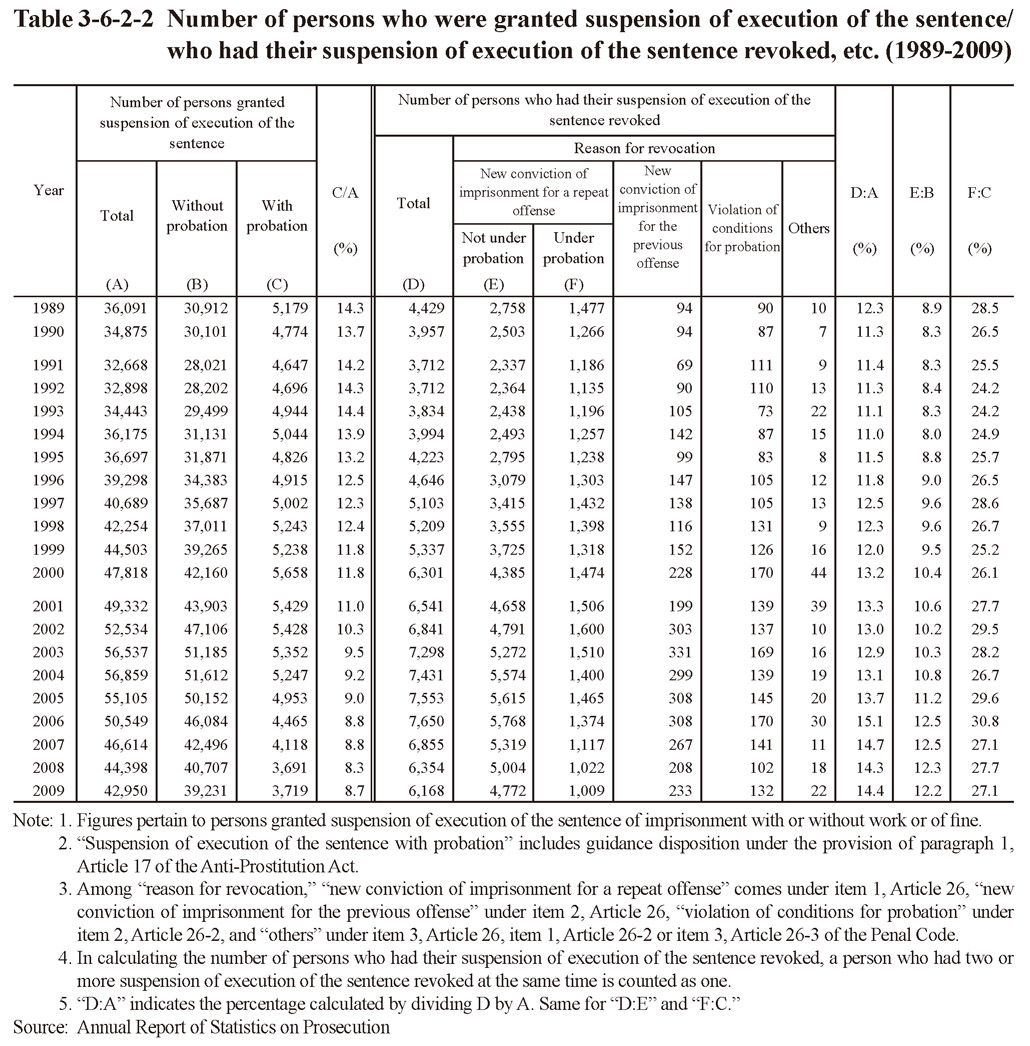
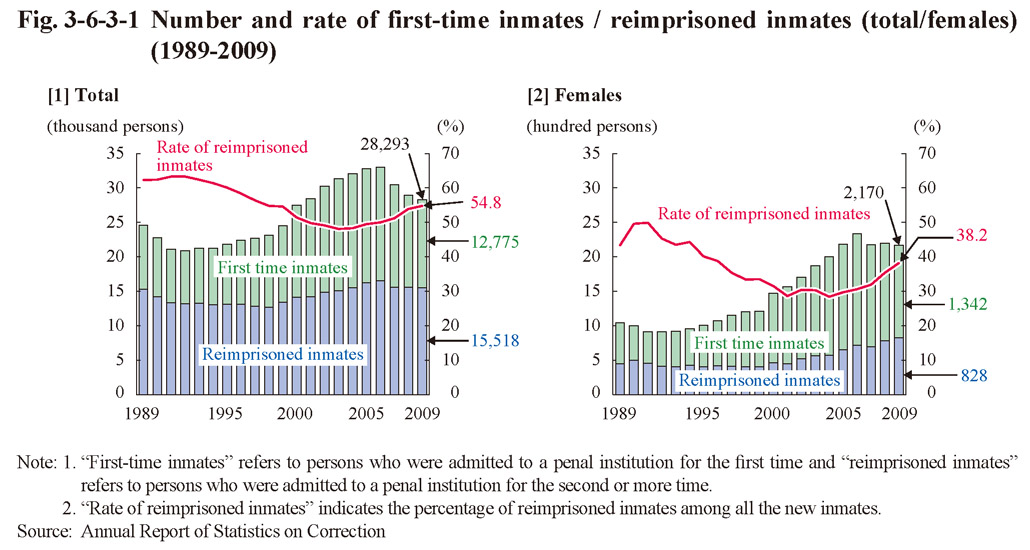
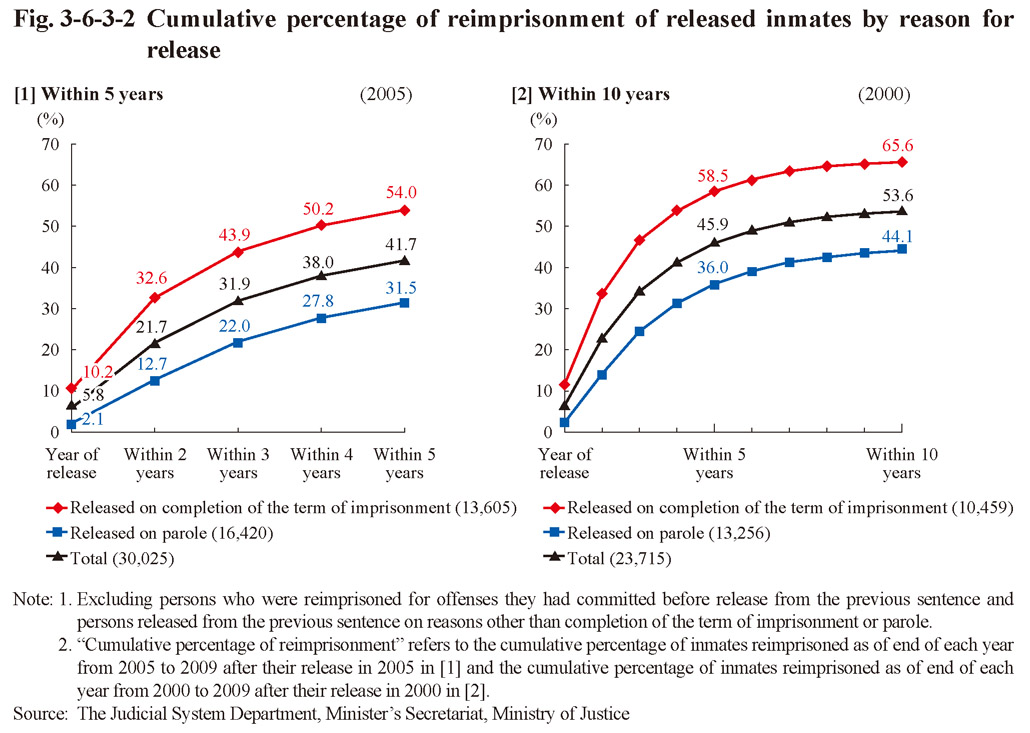 Fig. 3-6-3-2 Cumulative percentage of reimprisonment of released inmates by reason for release
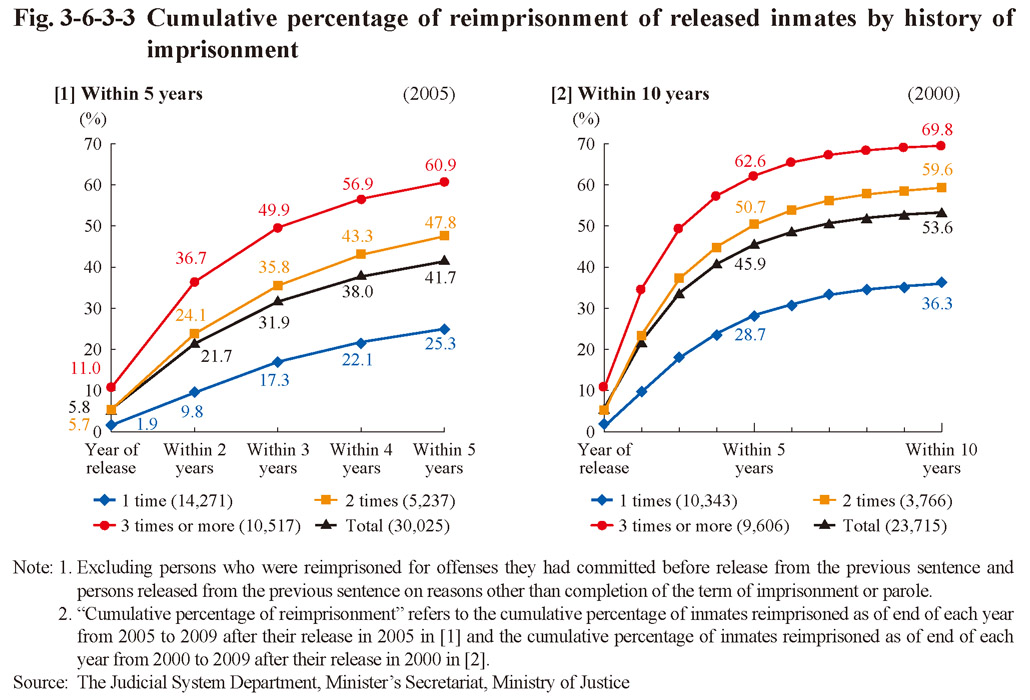 Fig. 3-6-3-3 Cumulative percentage of reimprisonment of released inmates by history of imprisonment
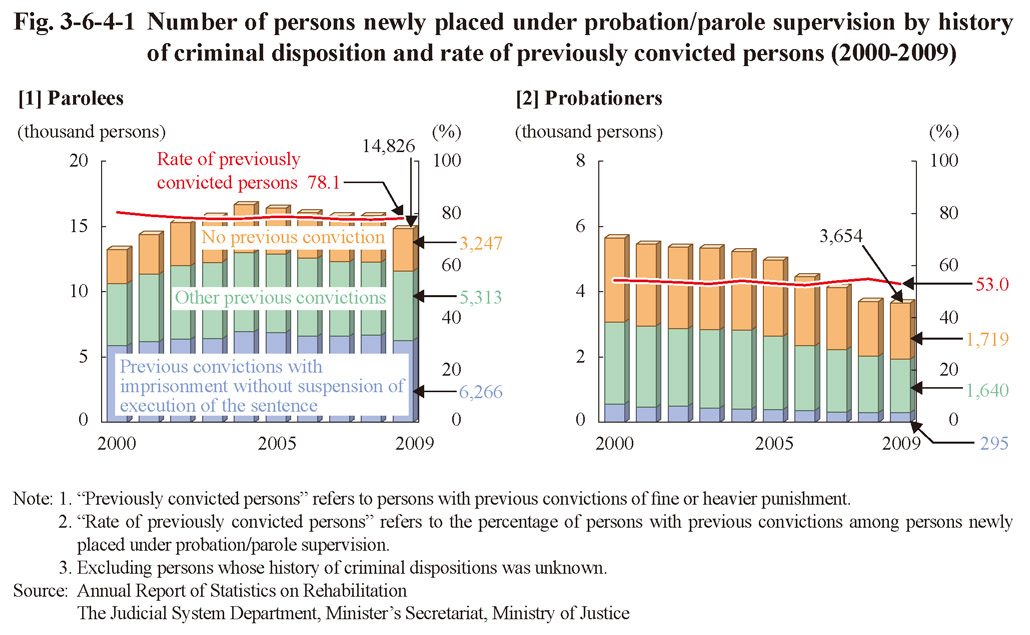
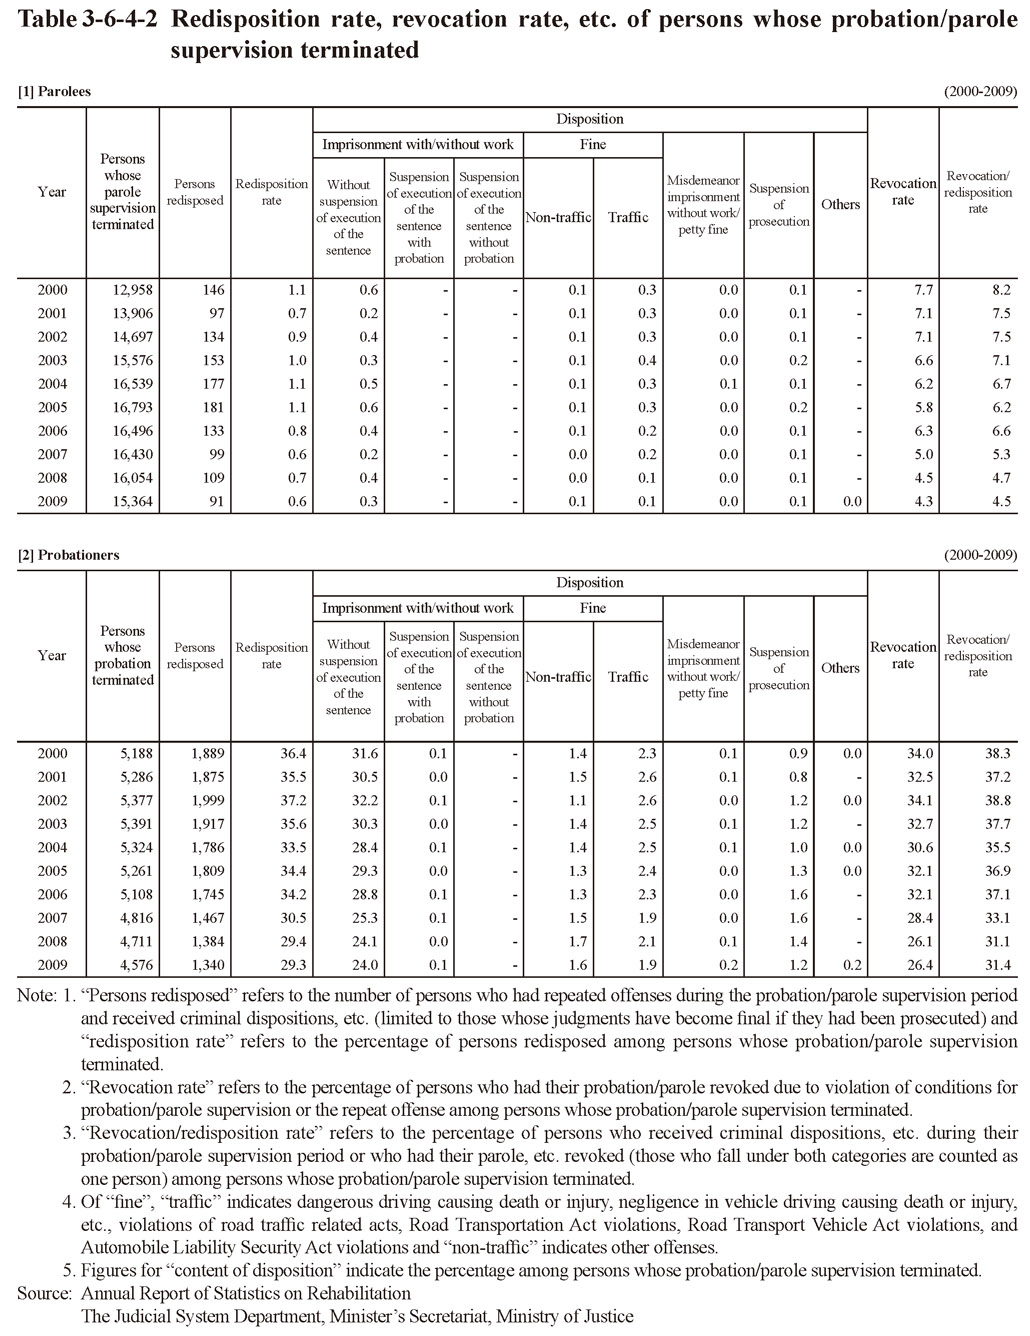
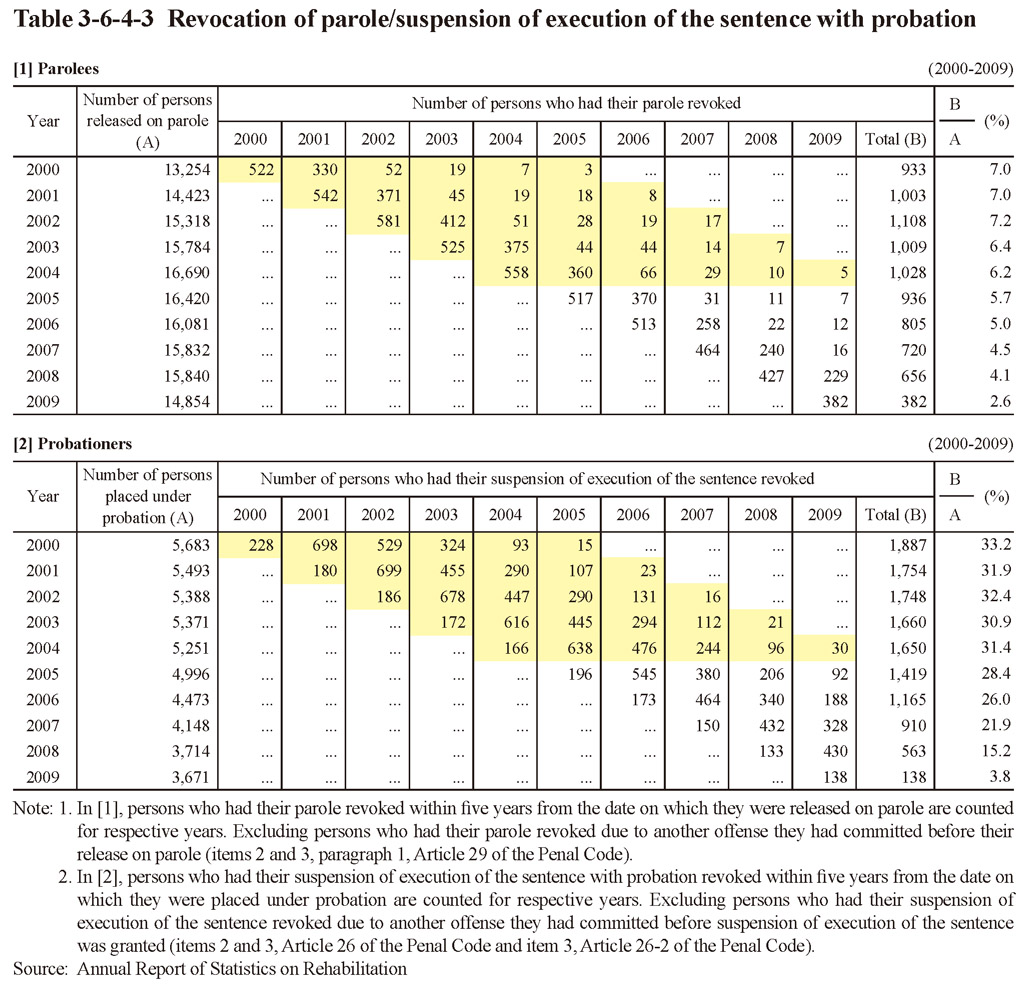 Table 3-6-4-3 Revocation of parole/suspension of execution of the sentence with probation
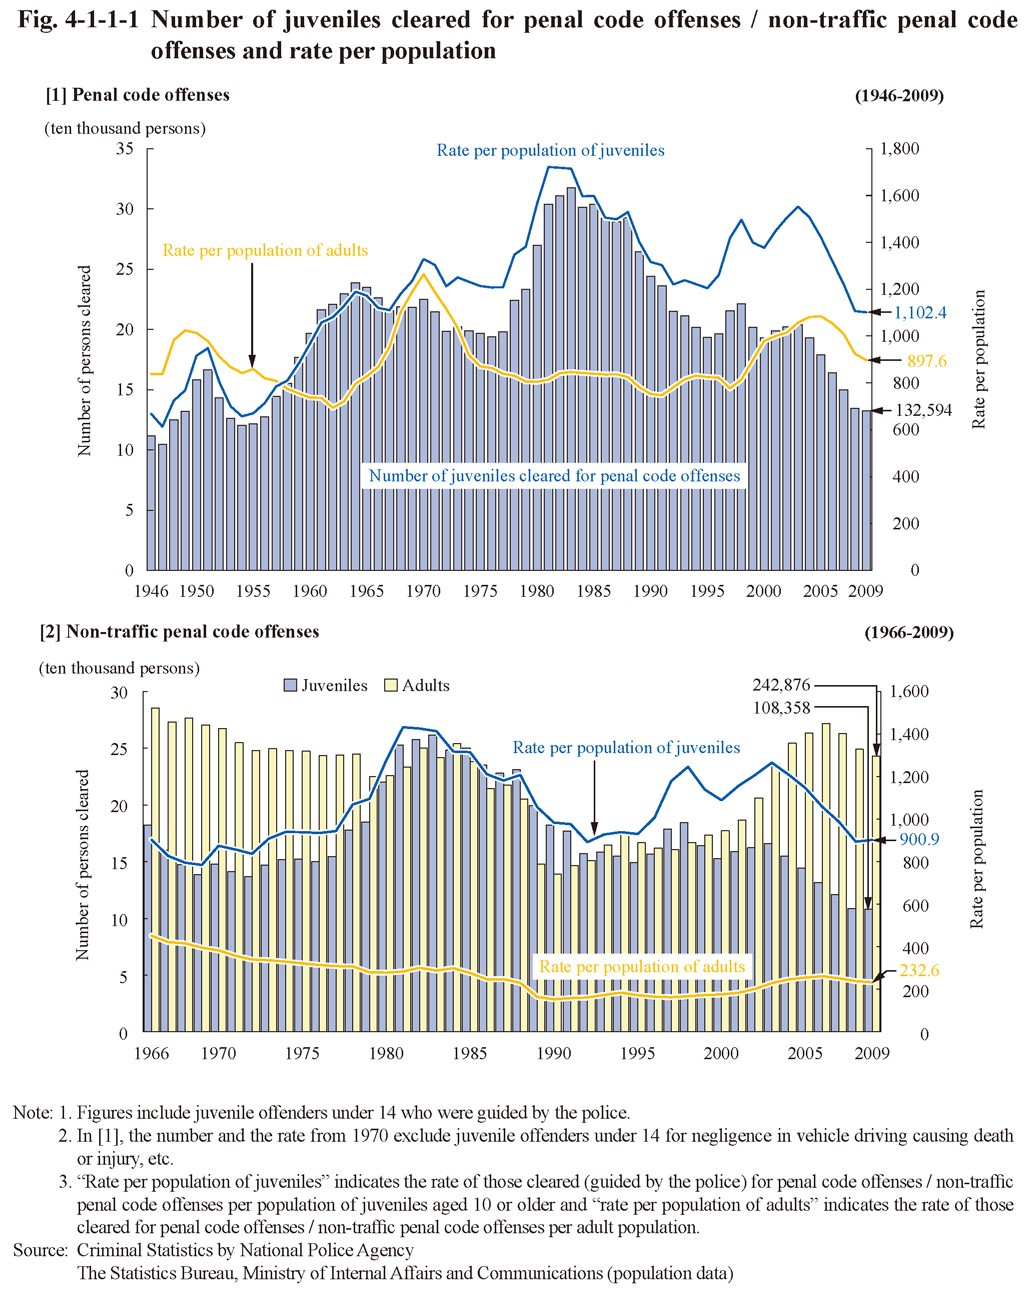
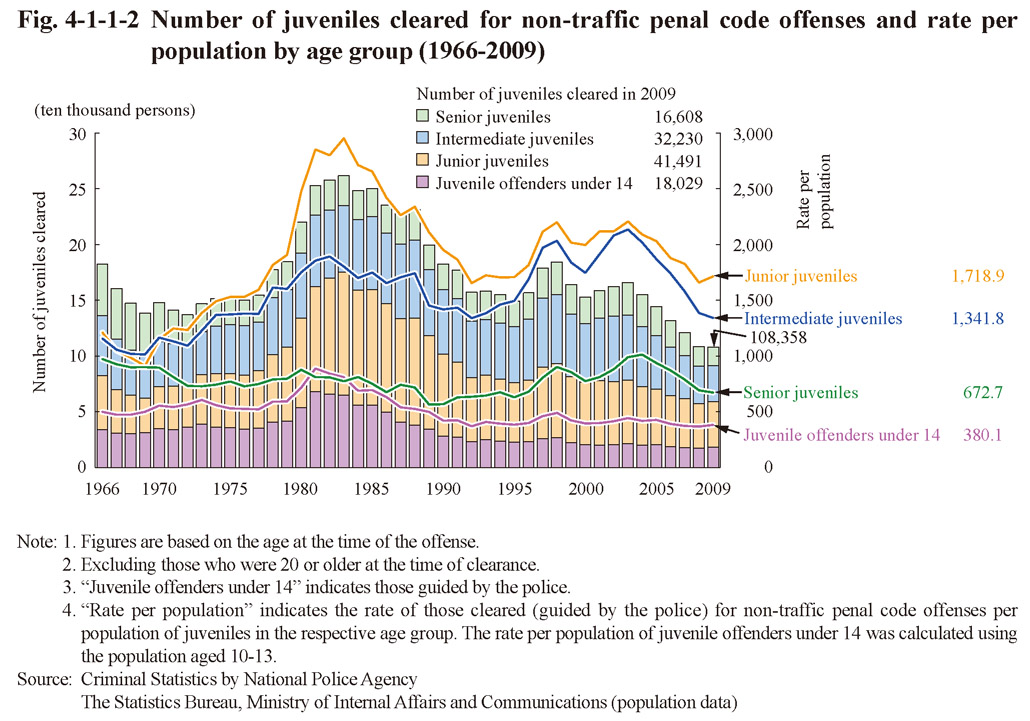
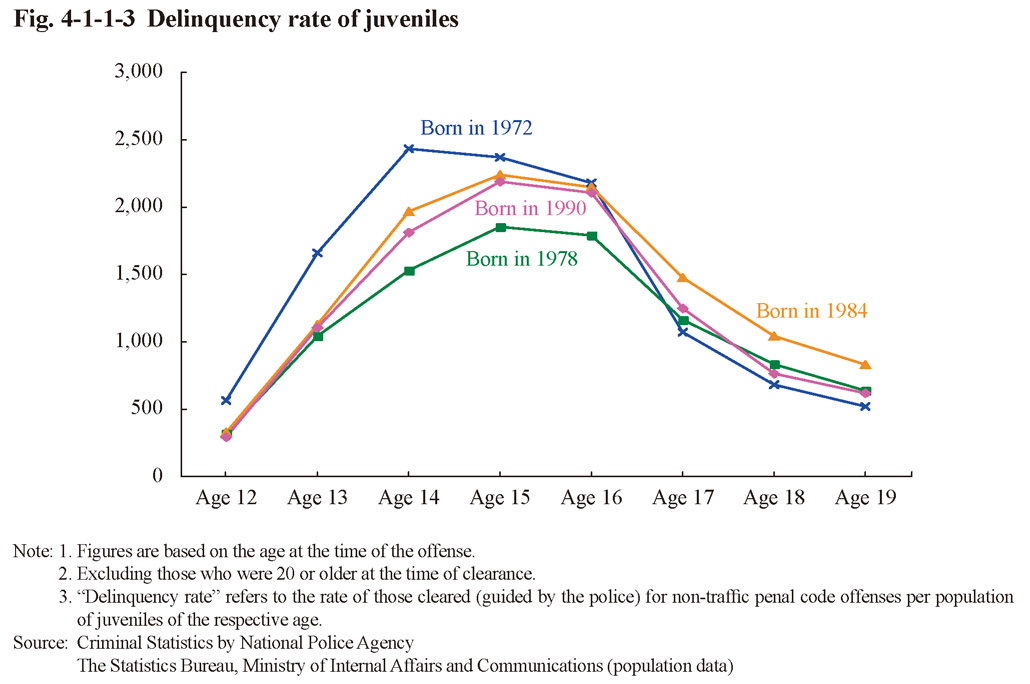 Fig. 4-1-1-3 Delinquency rate of juveniles
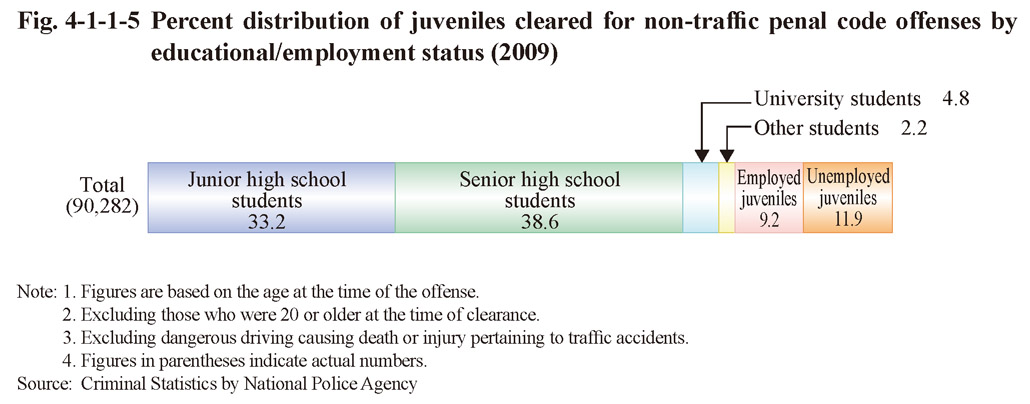

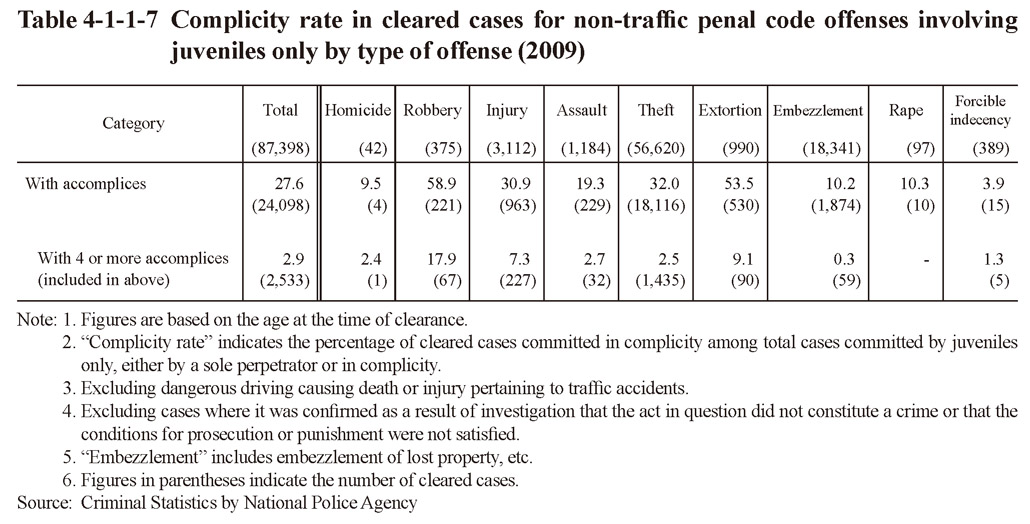
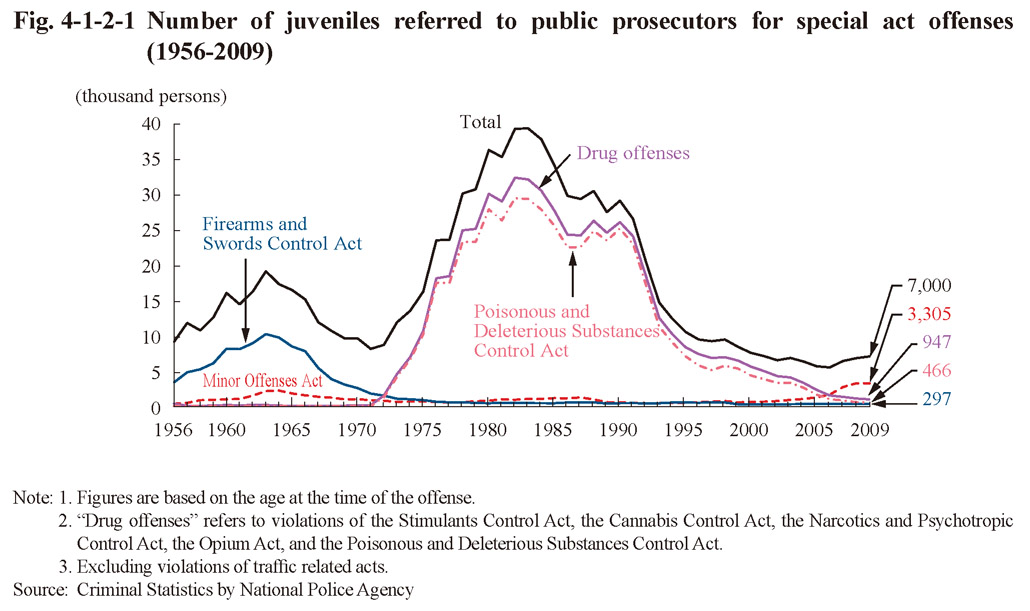 Fig. 4-1-2-1 Number of juveniles referred to public prosecutors for special act offenses (1956-2009)
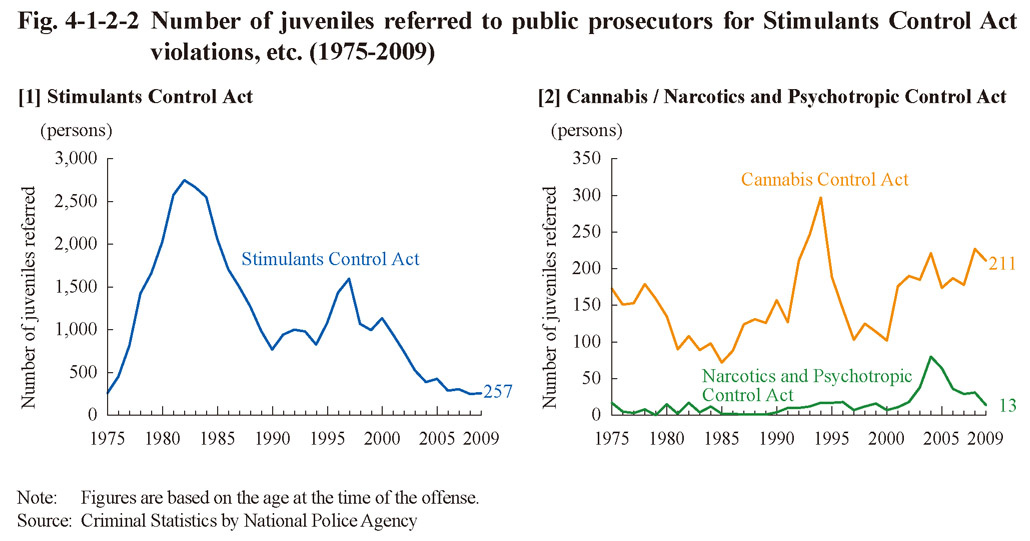
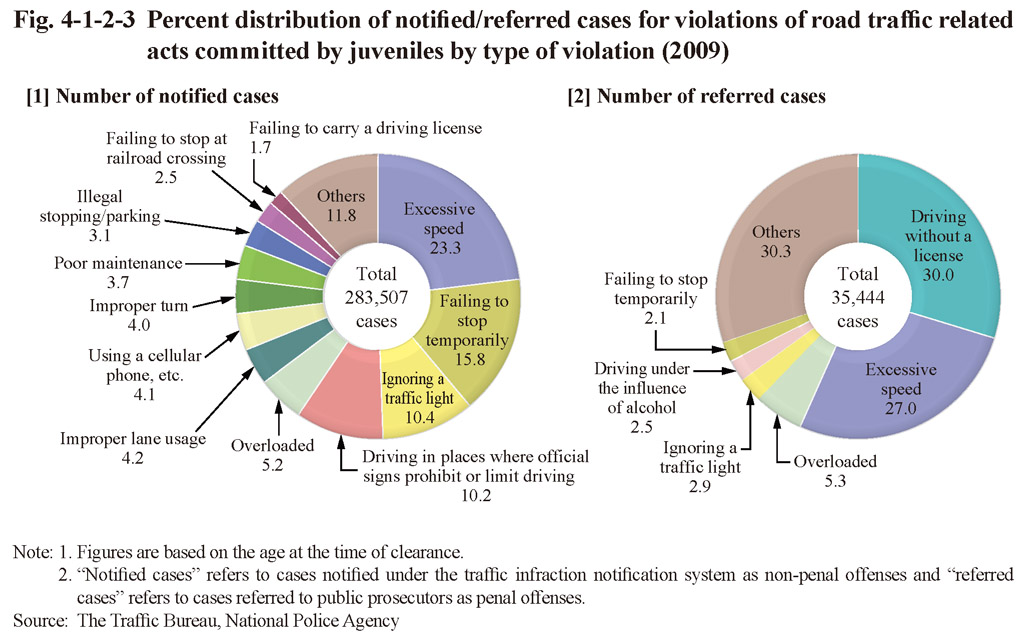
 Fig. 4-1-2-4 Number of hot rodders and hot rodder groups (2000-2009)
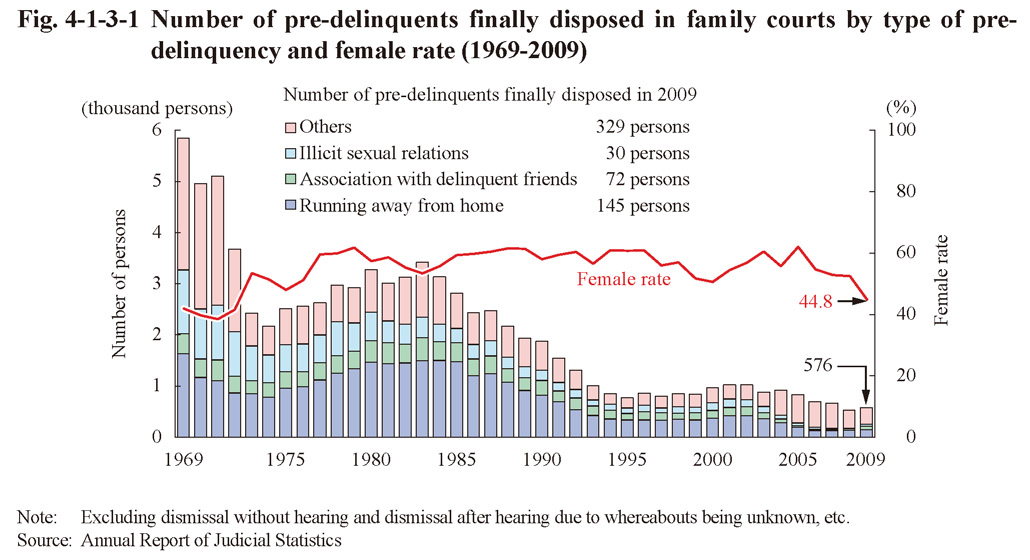
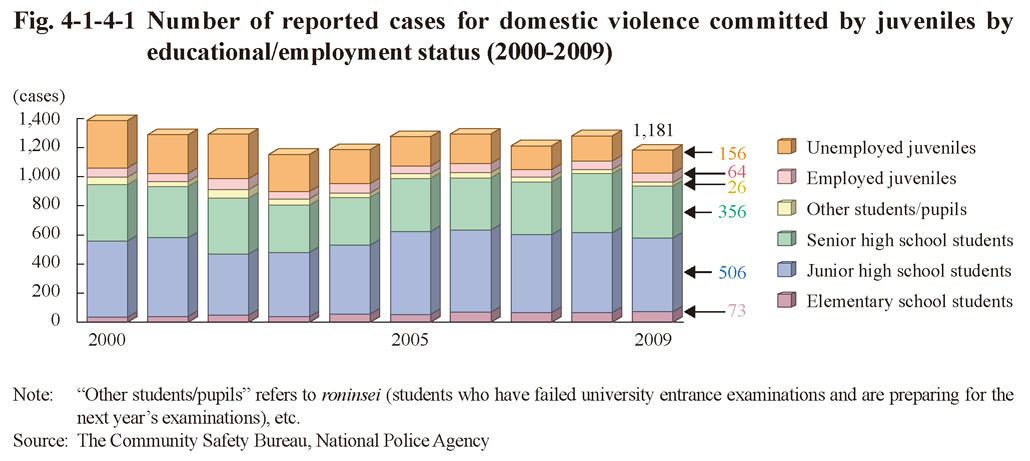
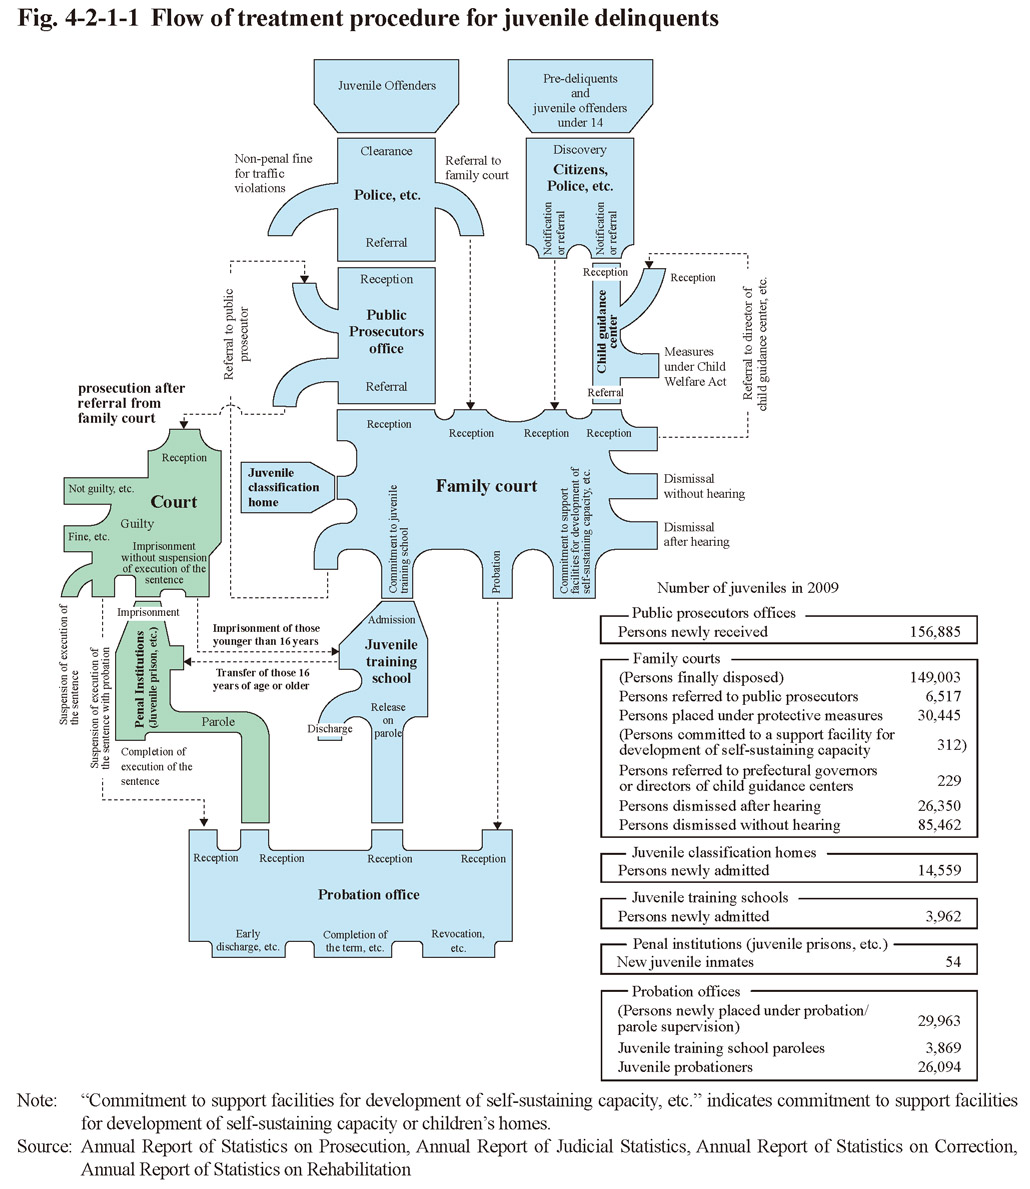 Fig. 4-2-1-1 Flow of treatment procedure for juvenile delinquents
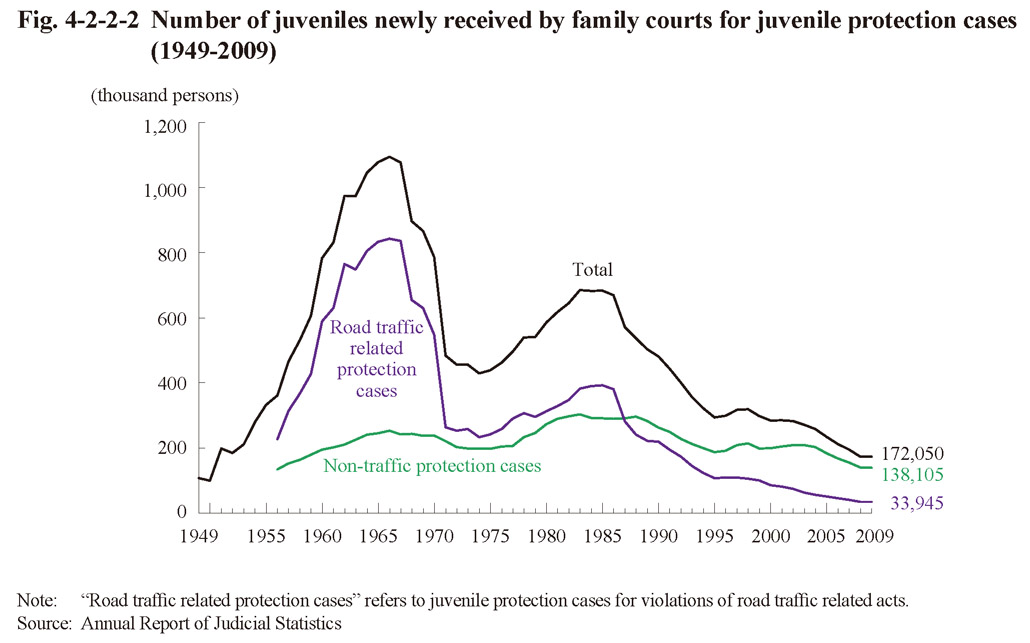
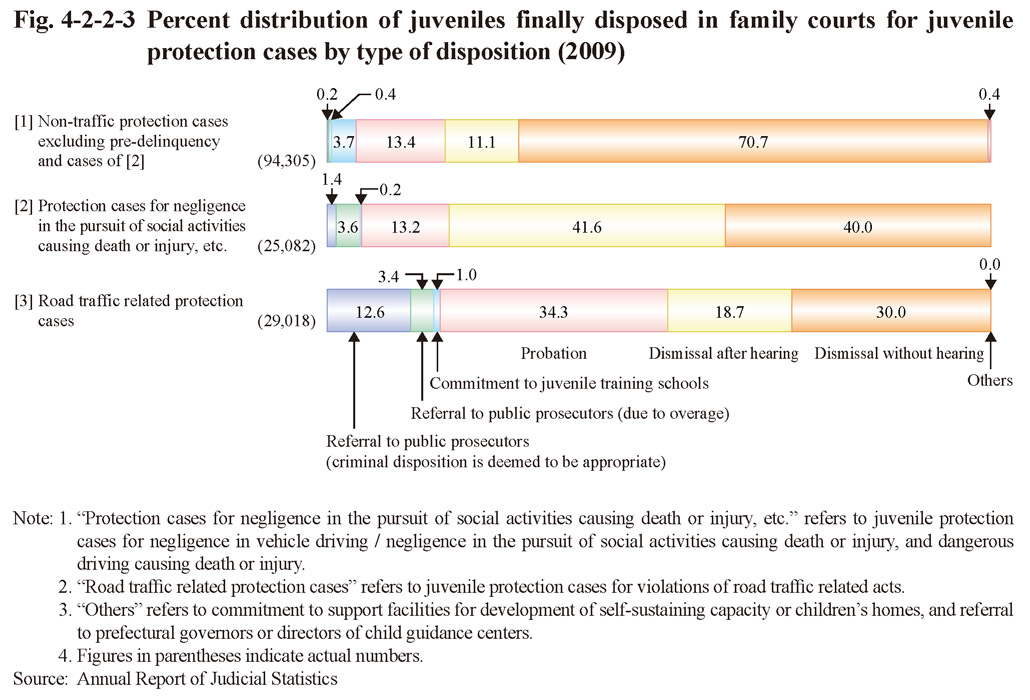
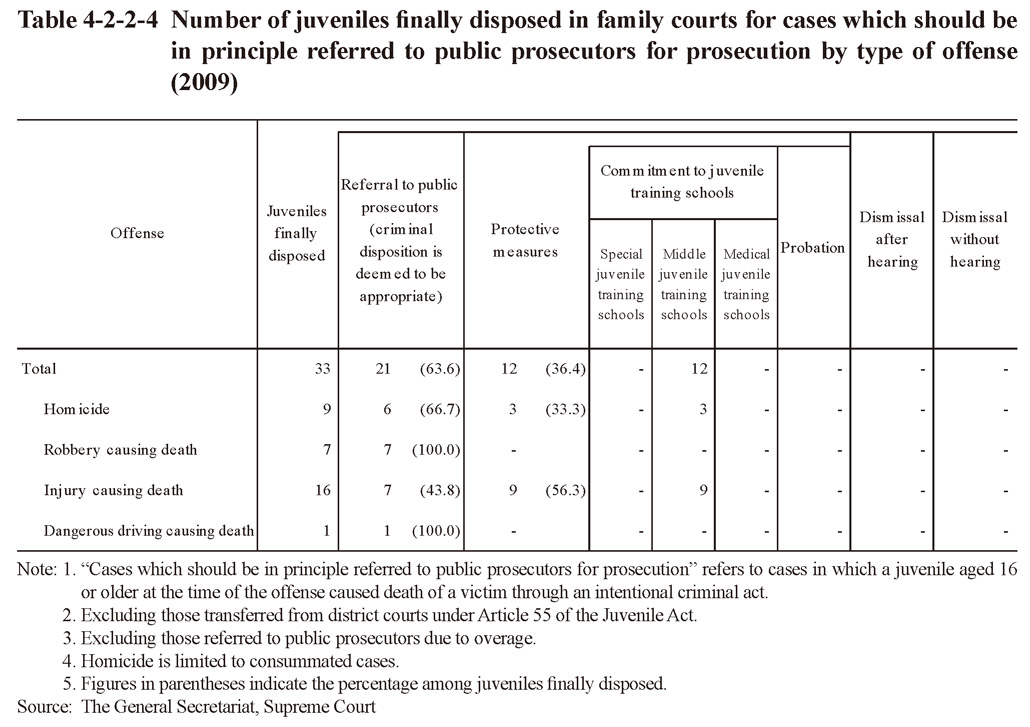
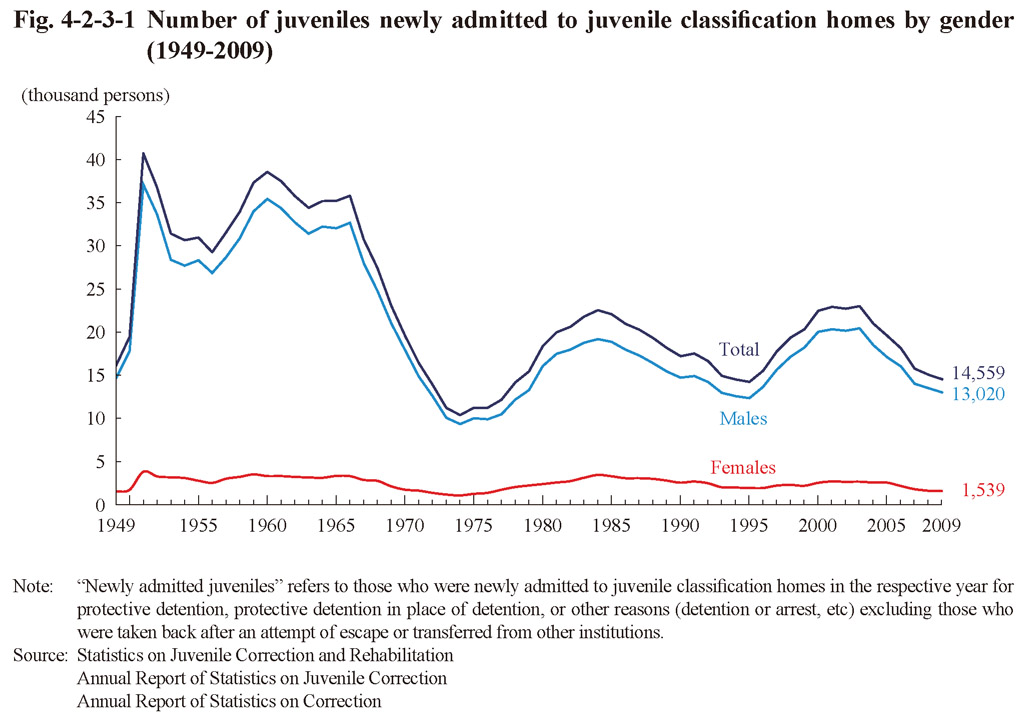
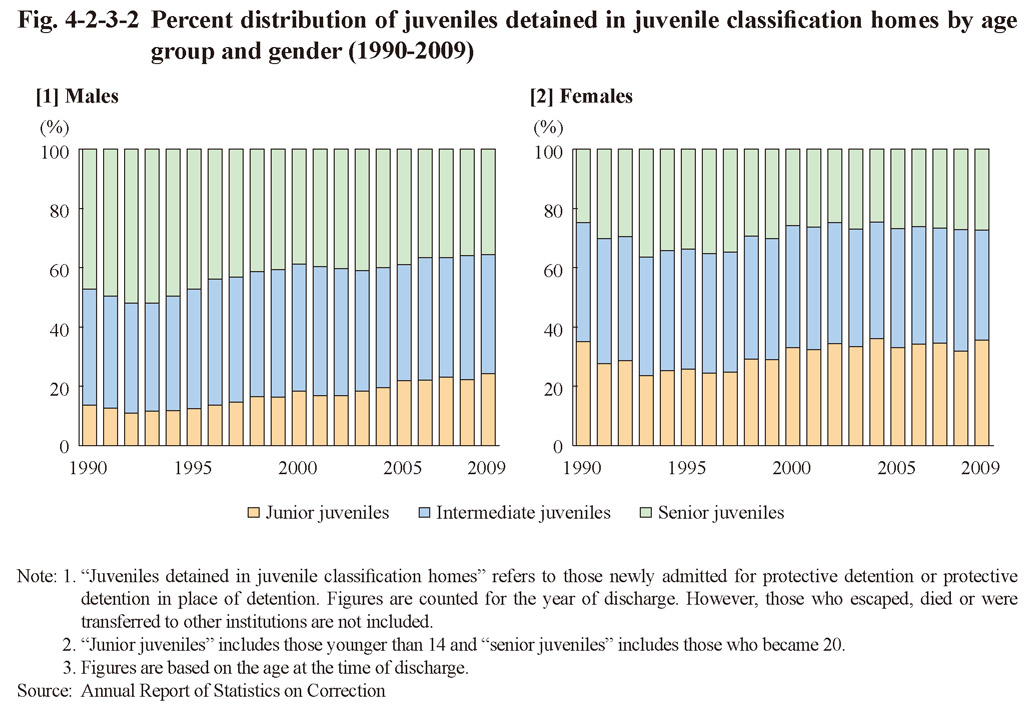
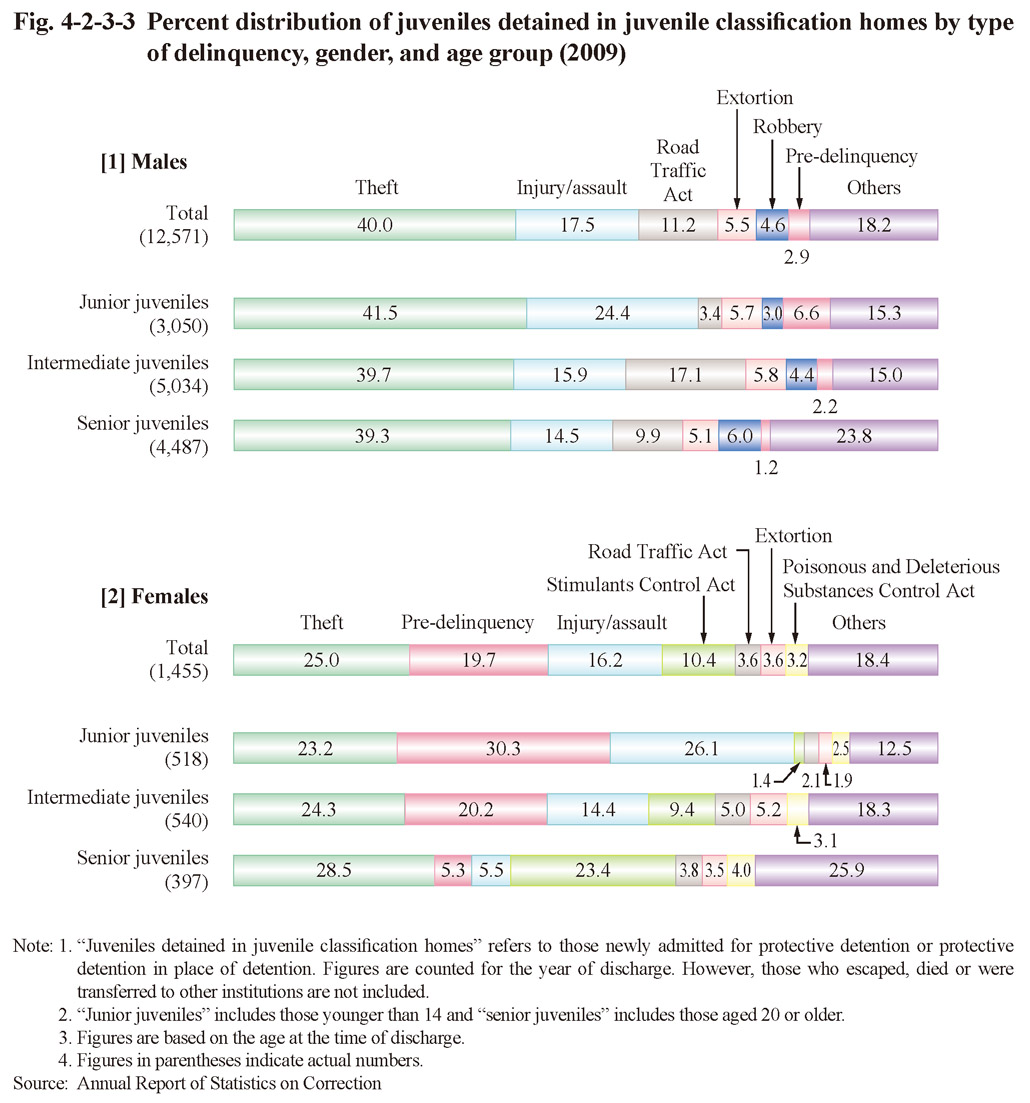
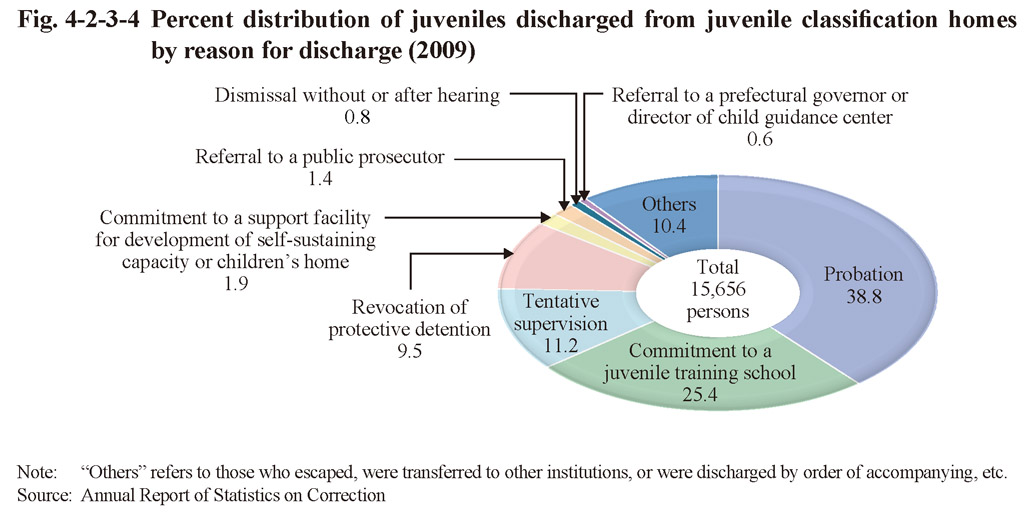
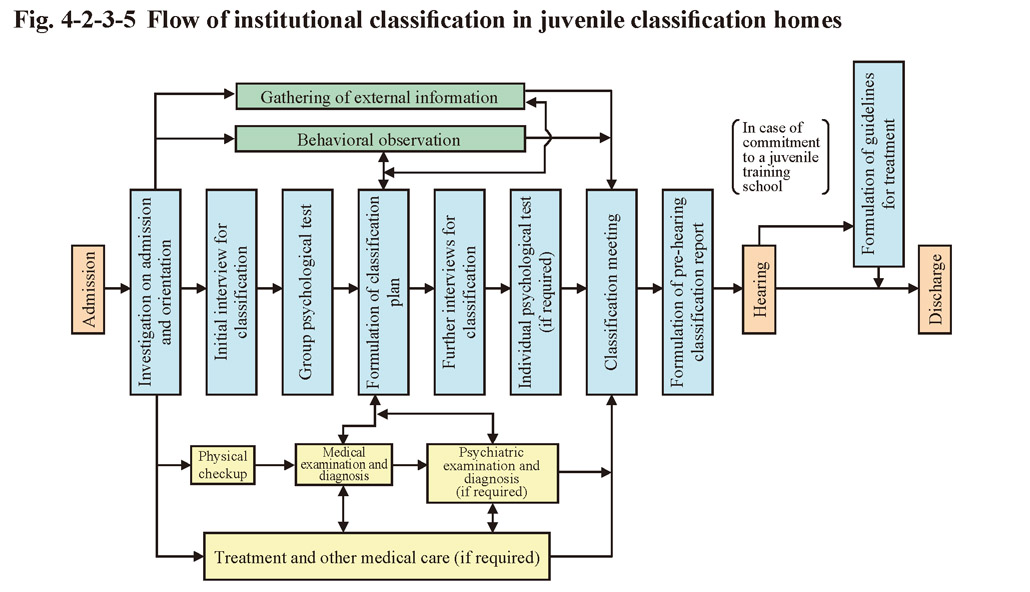 Fig. 4-2-3-5 Flow of institutional classification in juvenile classification homes
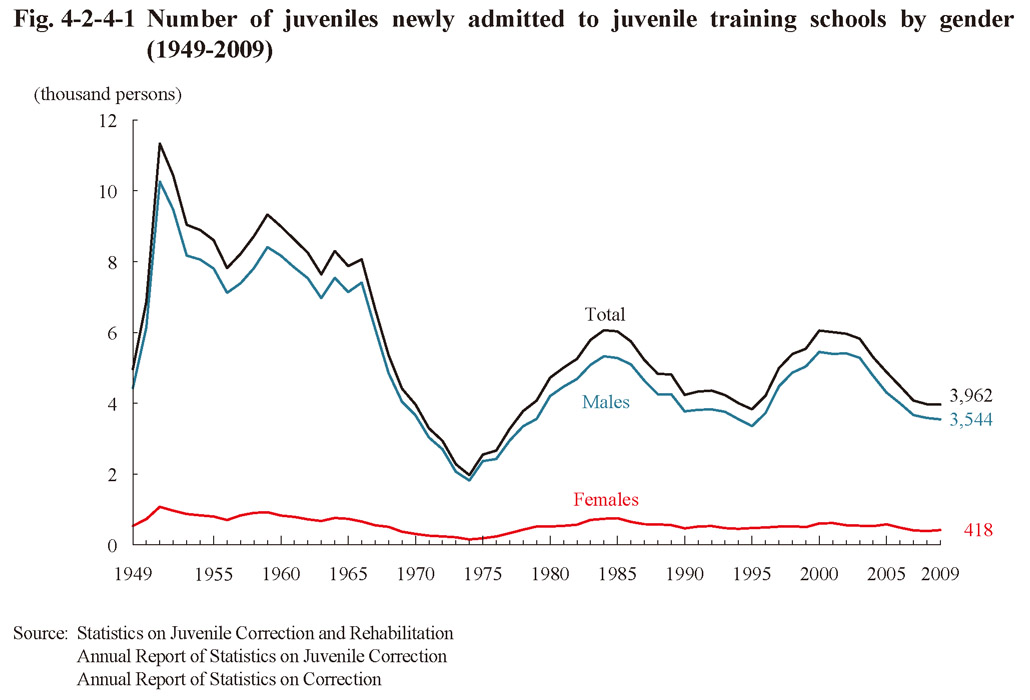 Fig. 4-2-4-1 Number of juveniles newly admitted to juvenile training schools by gender (1949-2009)
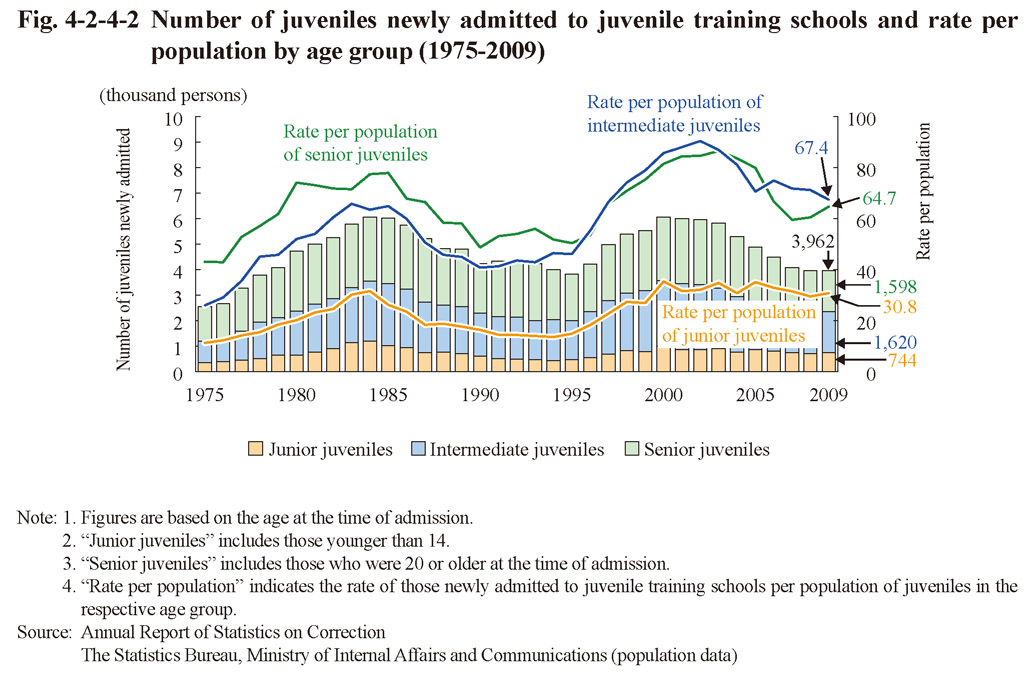
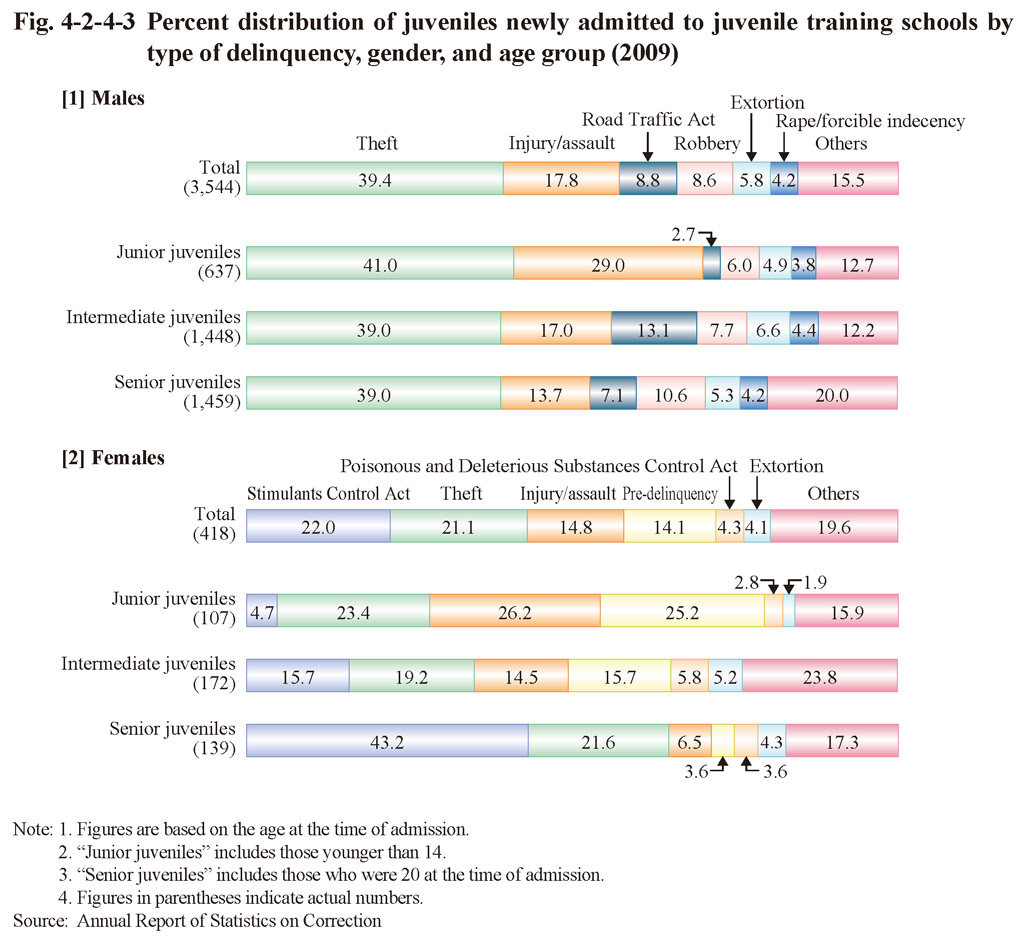

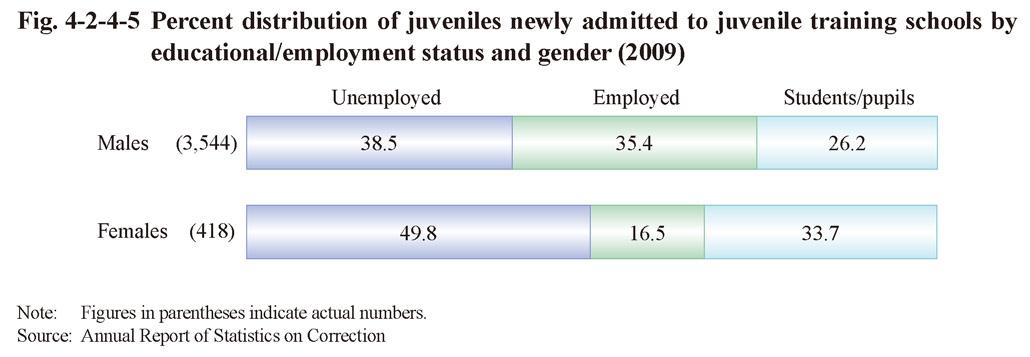
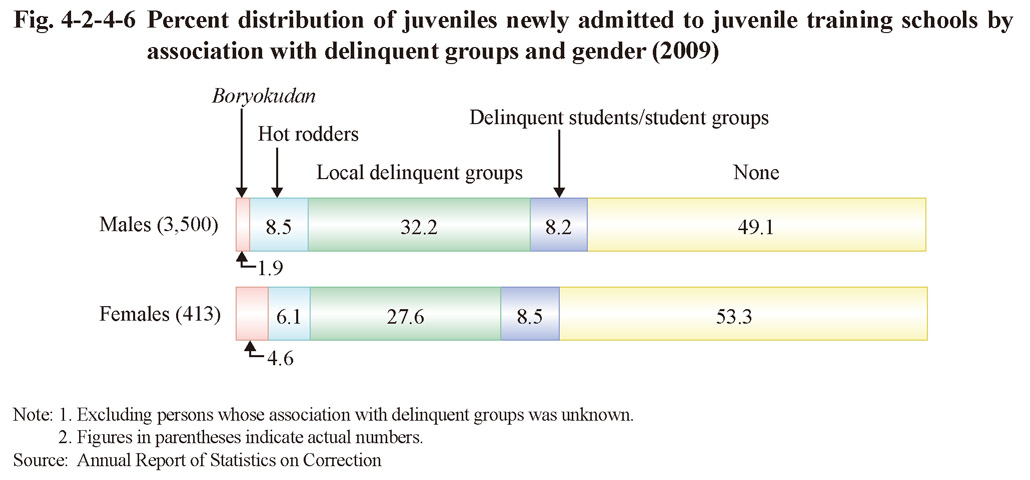
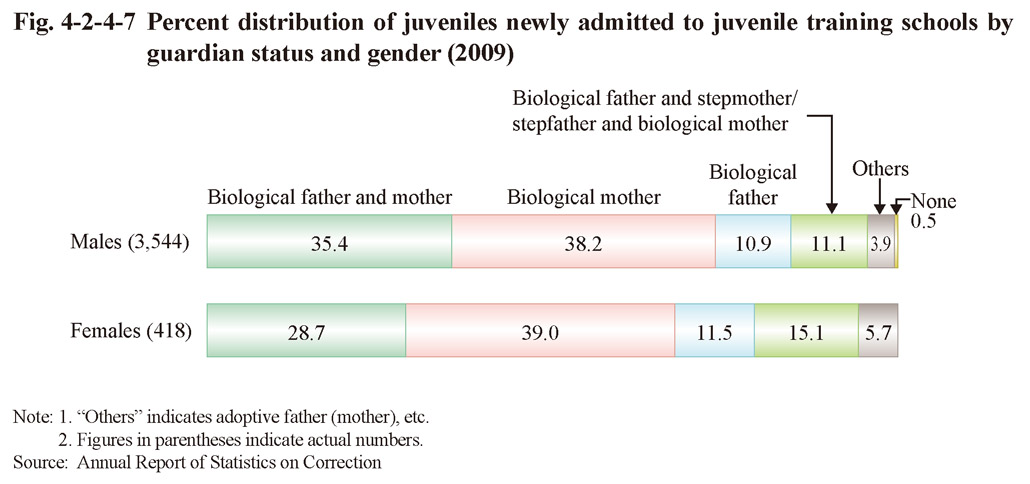
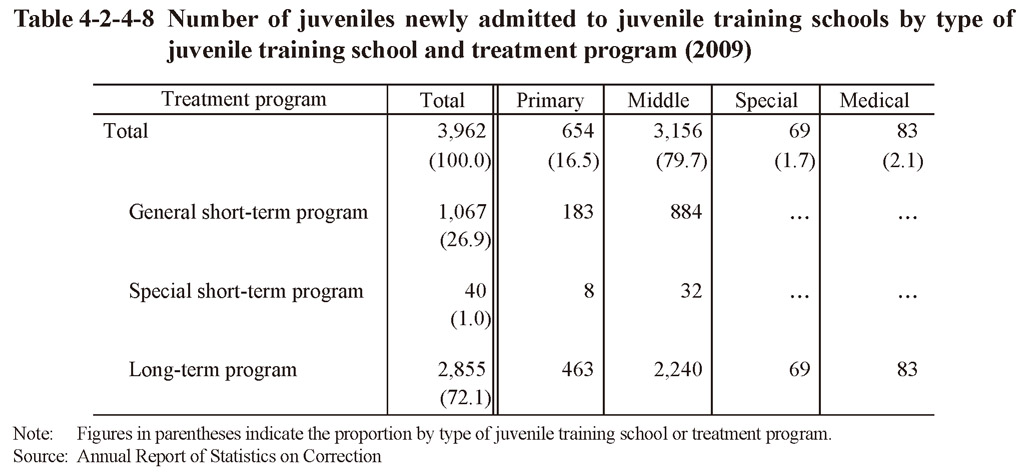
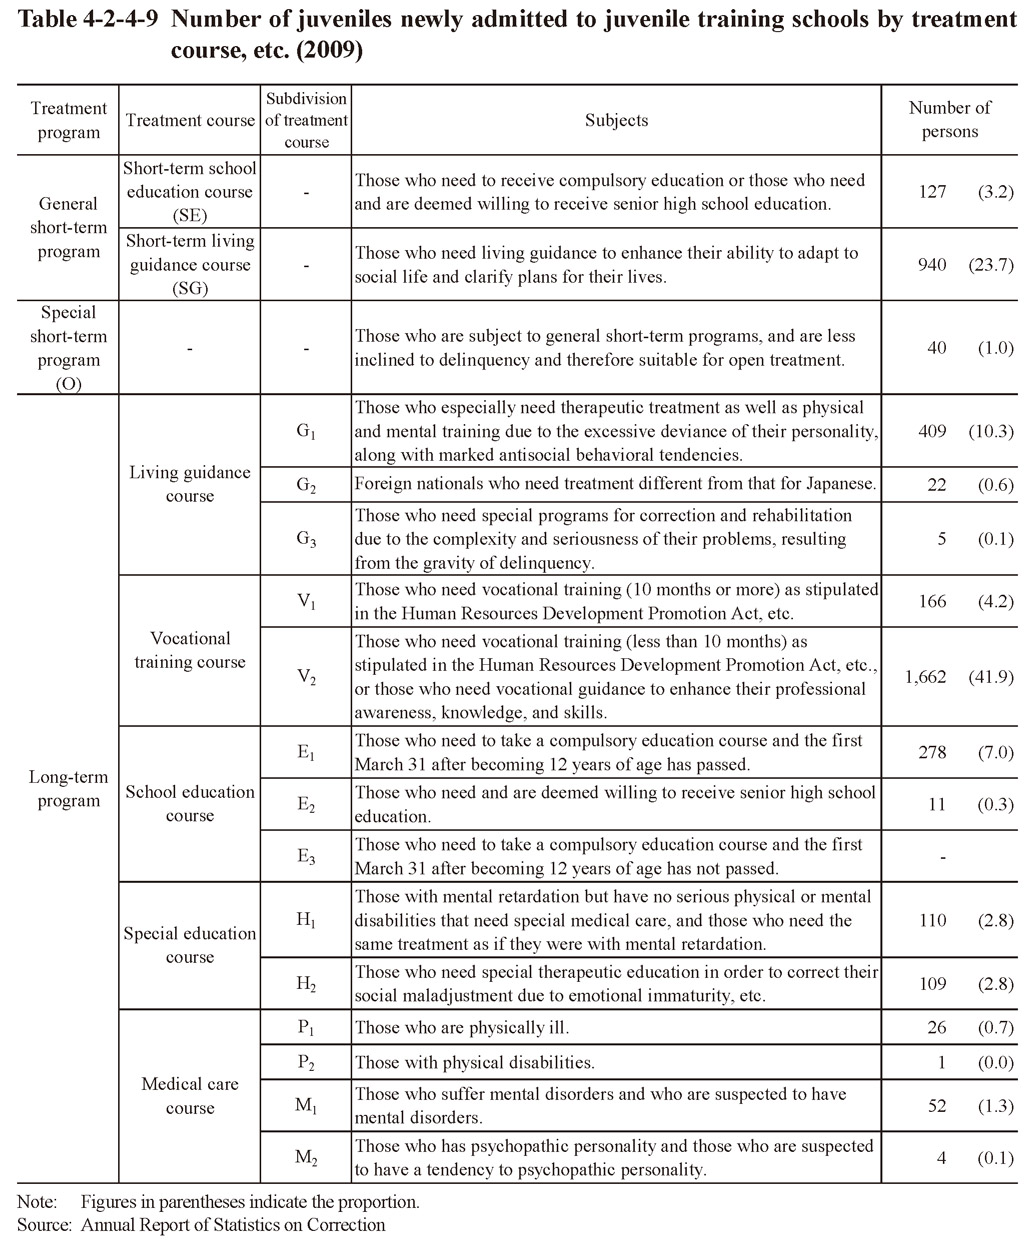

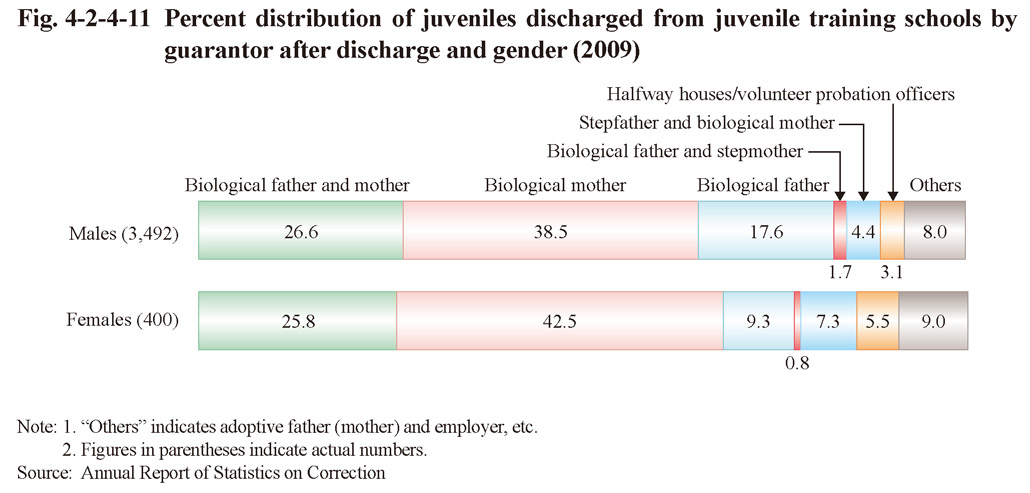
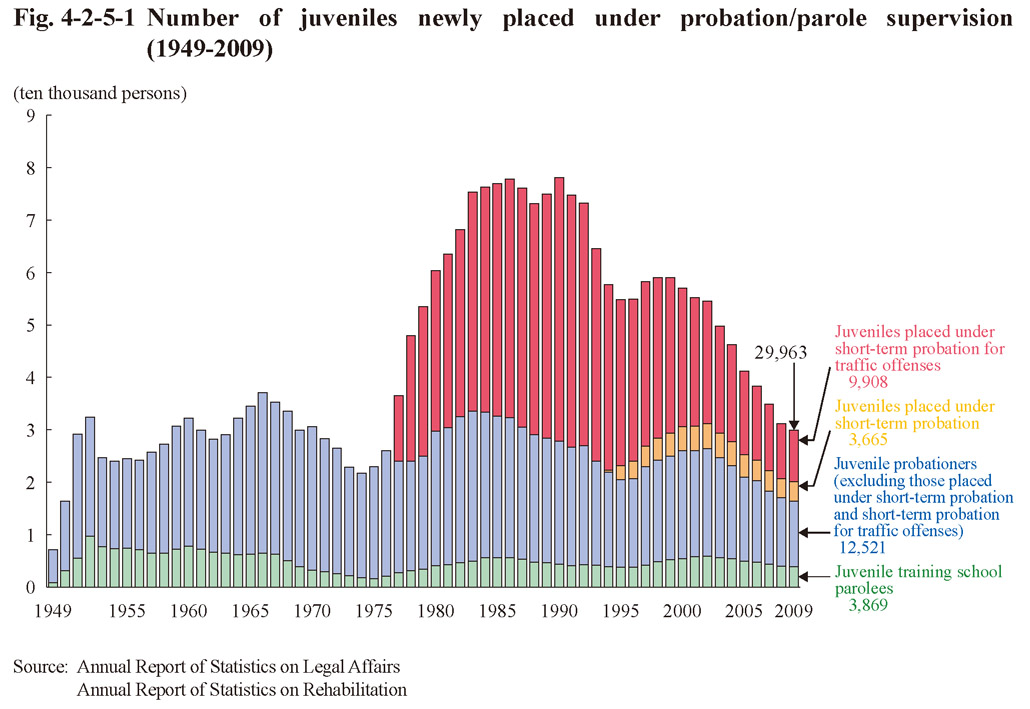 Fig. 4-2-5-1 Number of juveniles newly placed under probation/parole supervision (1949-2009)
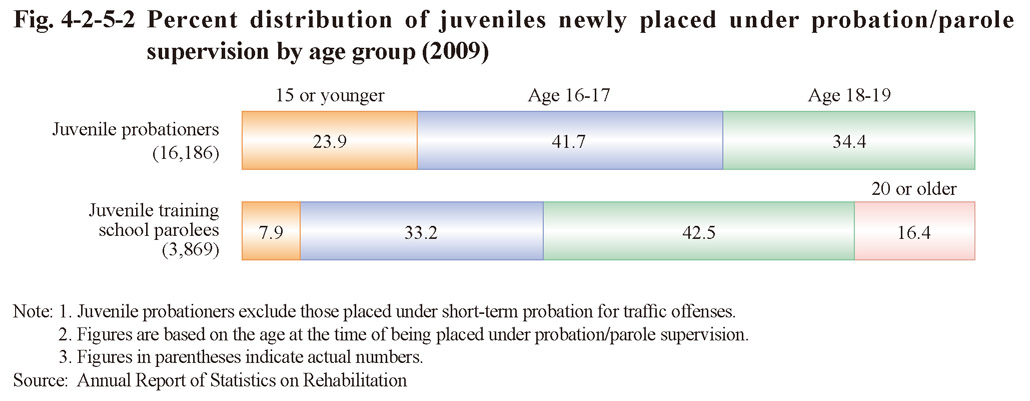
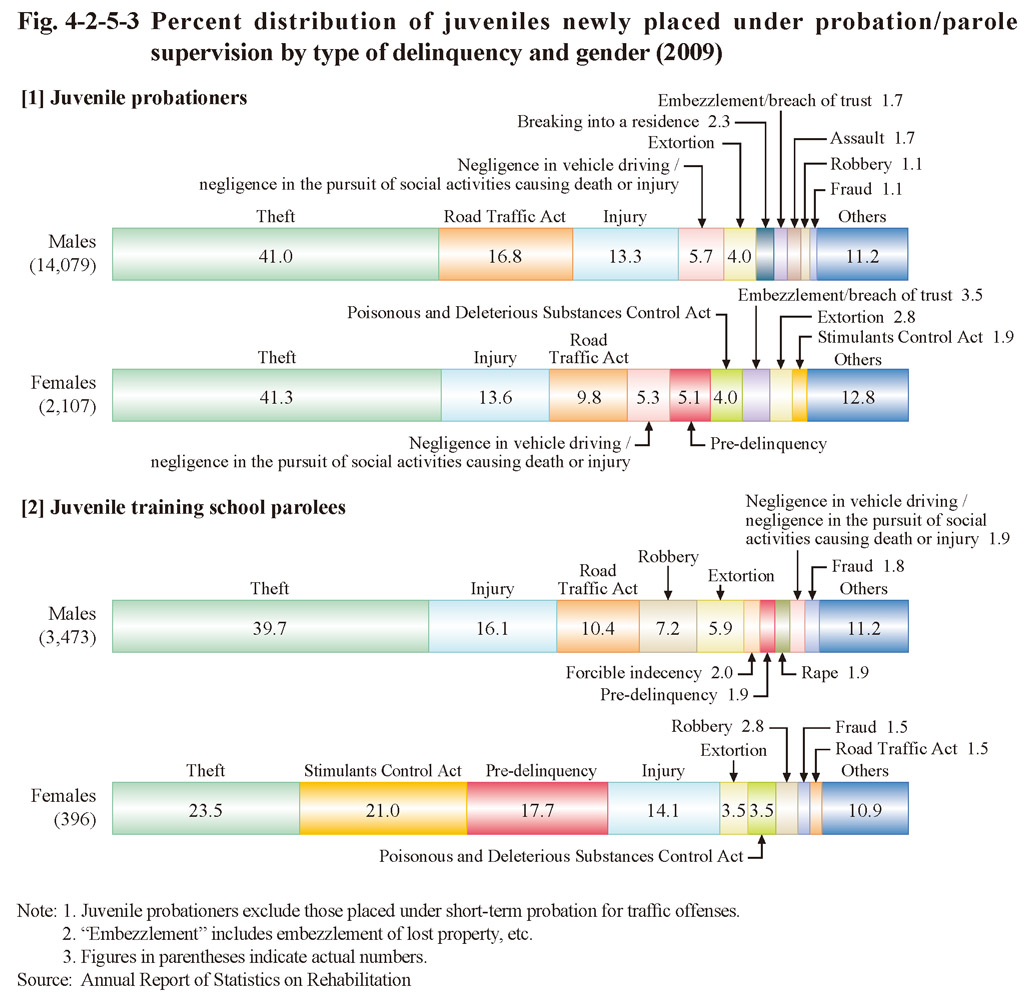
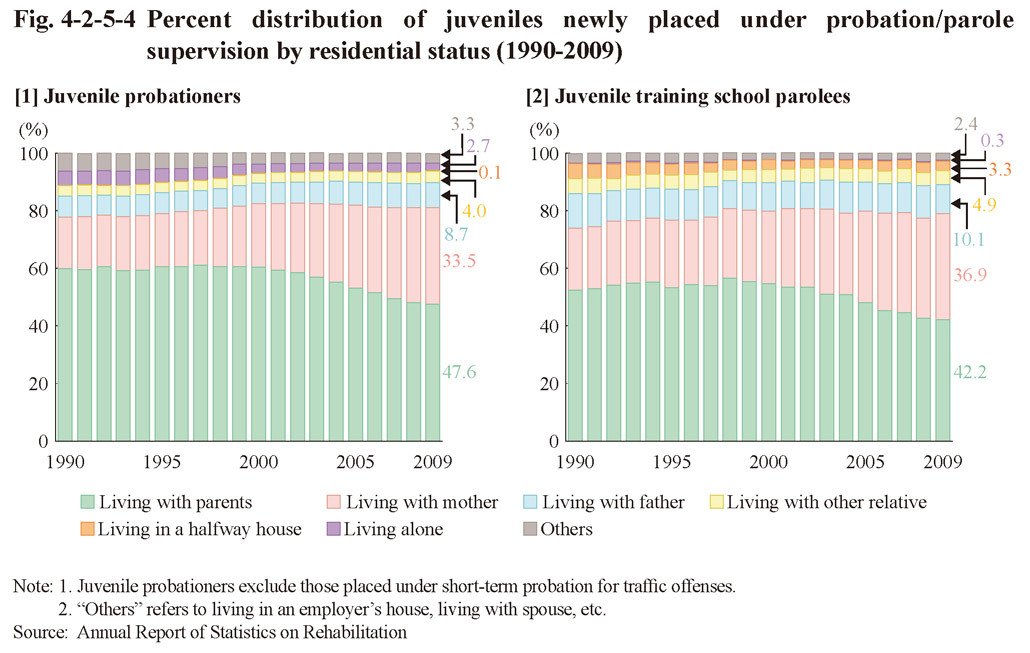
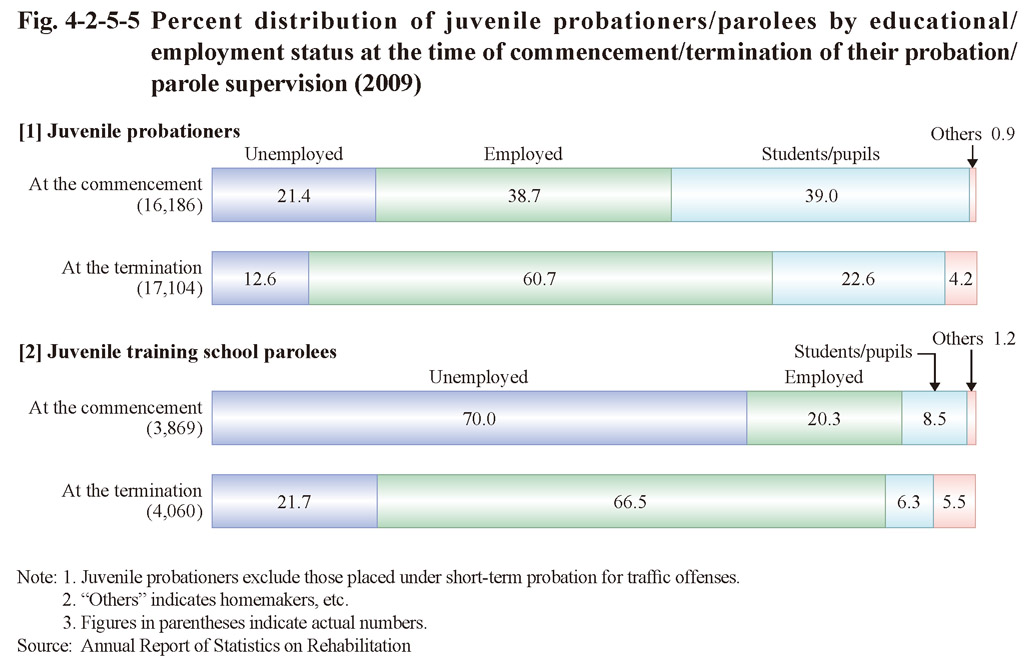
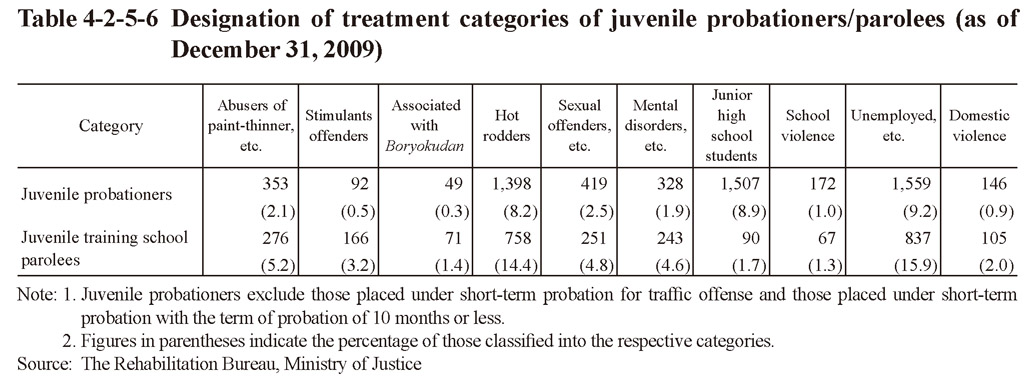
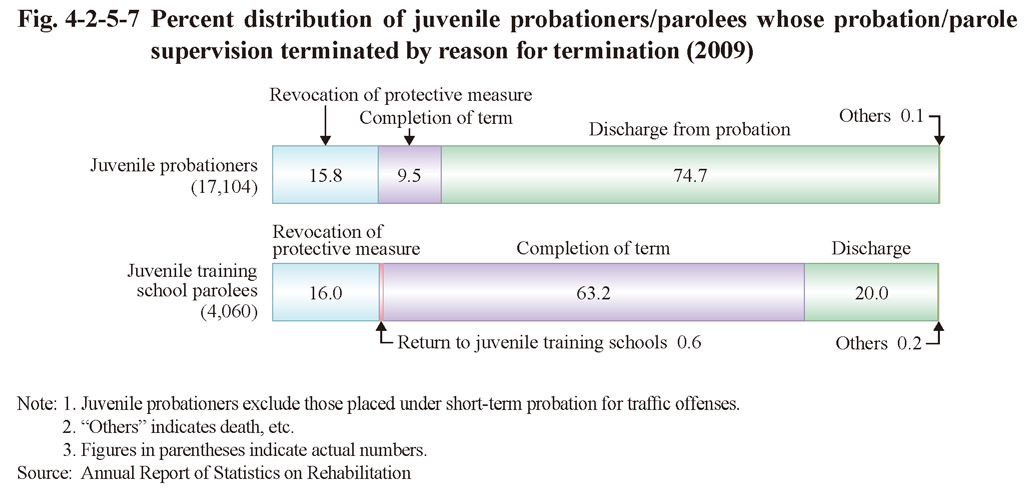
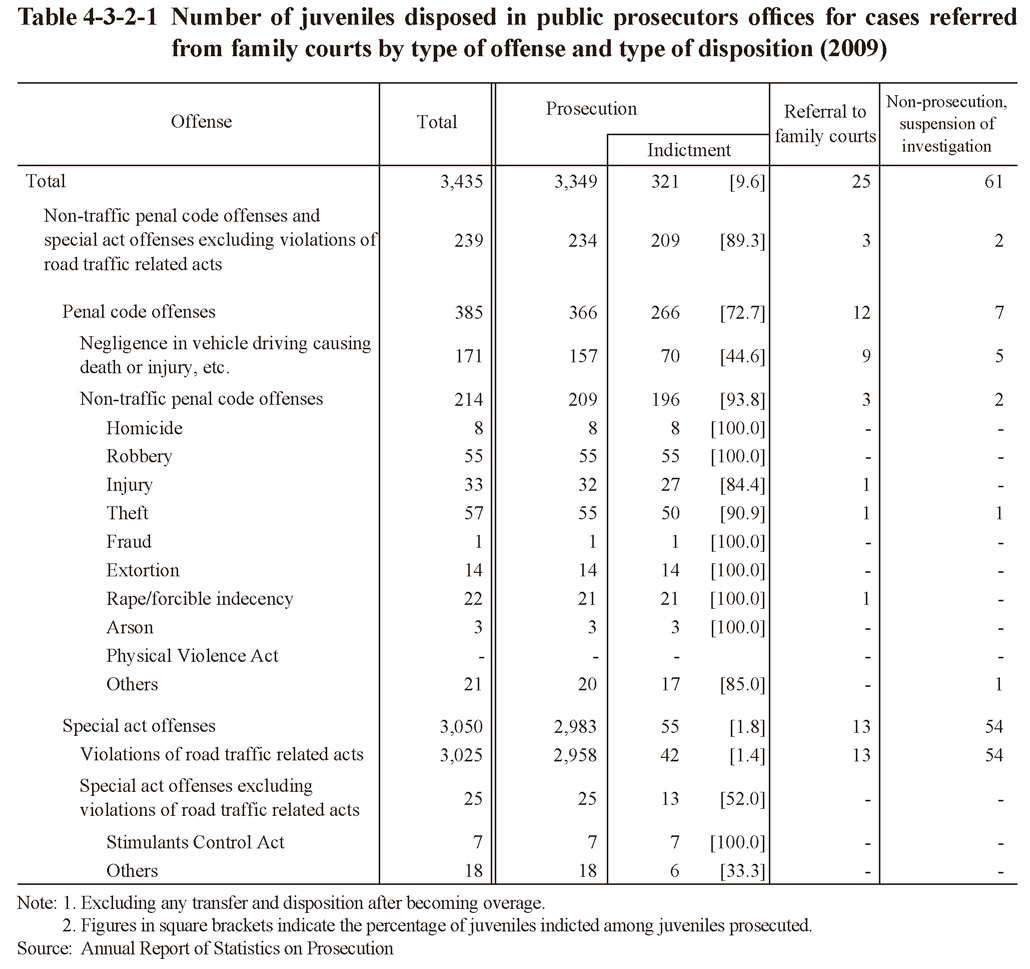

 Fig. 4-3-3-1 Number of juvenile inmates (1966-2009)
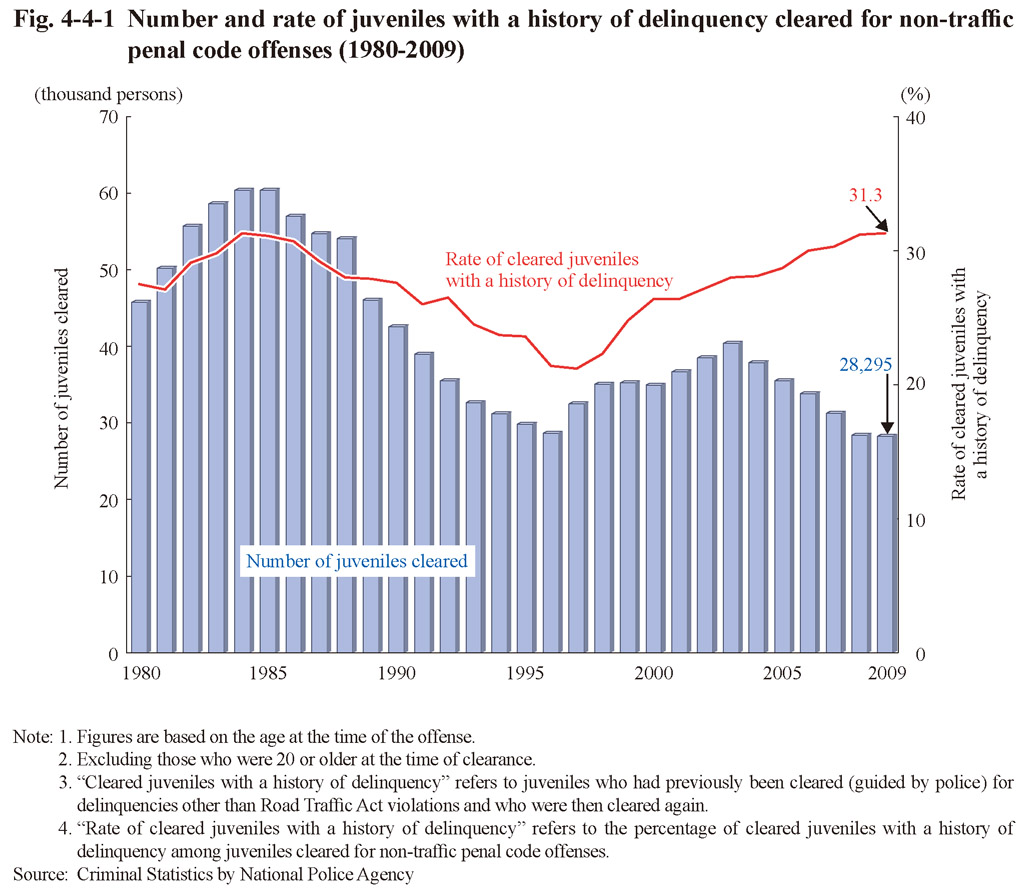
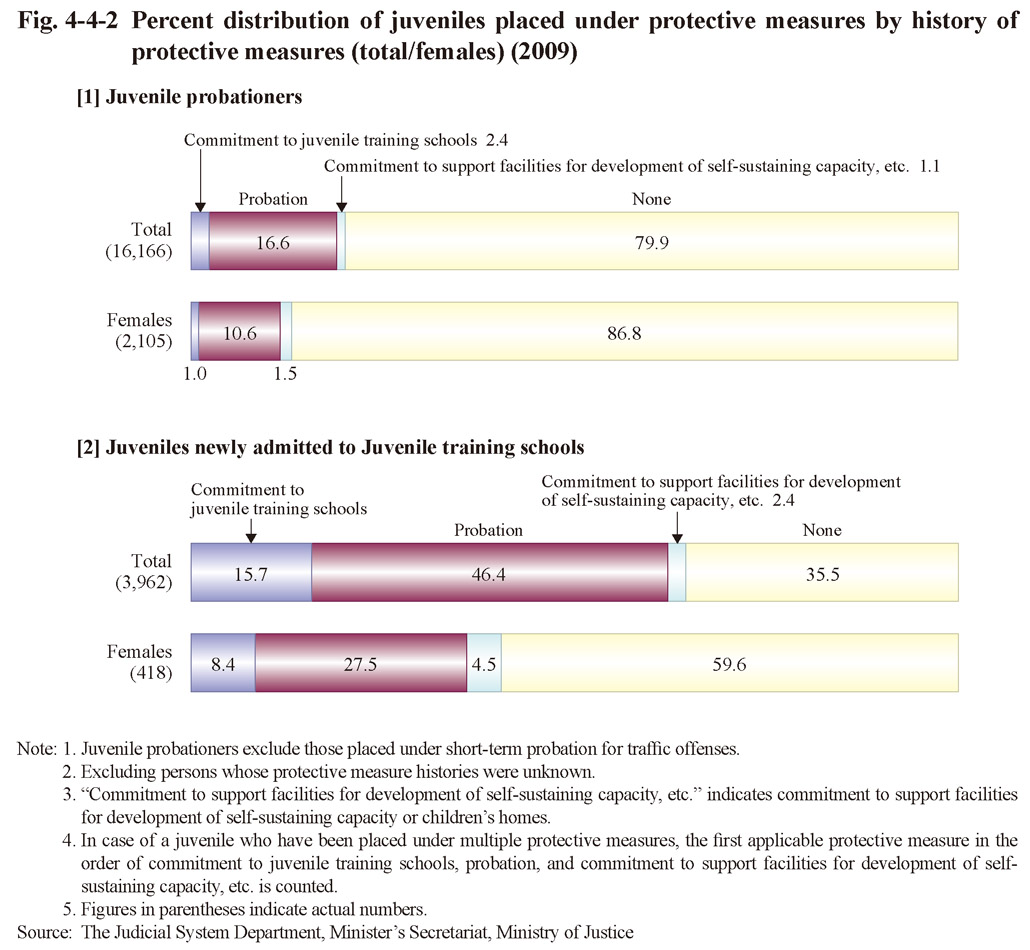
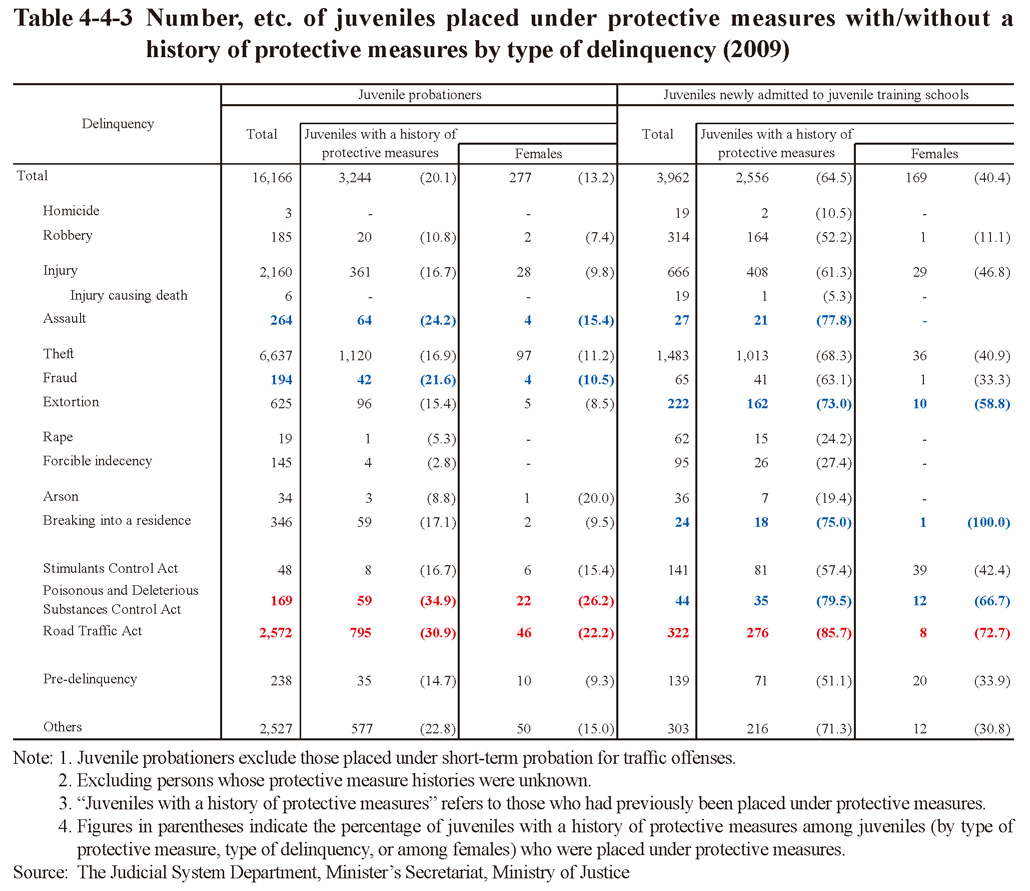
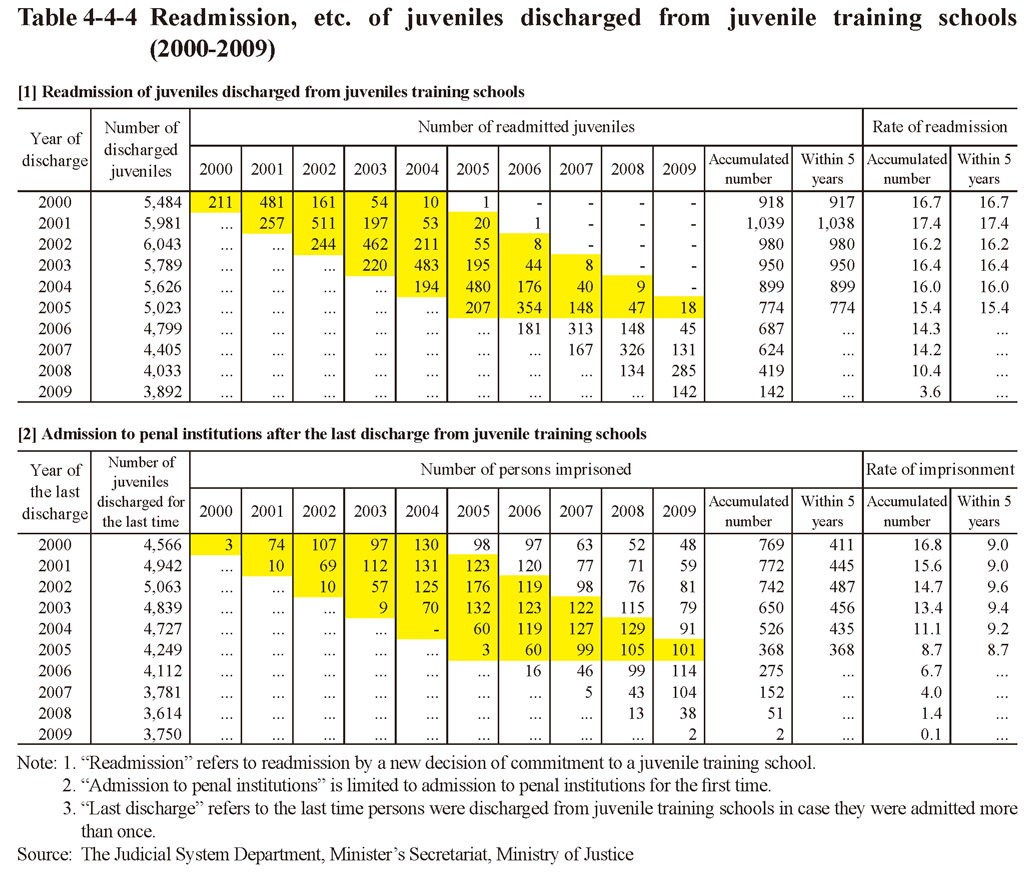 Table 4-4-4 Readmission, etc. of juveniles discharged from juvenile training schools (2000-2009)
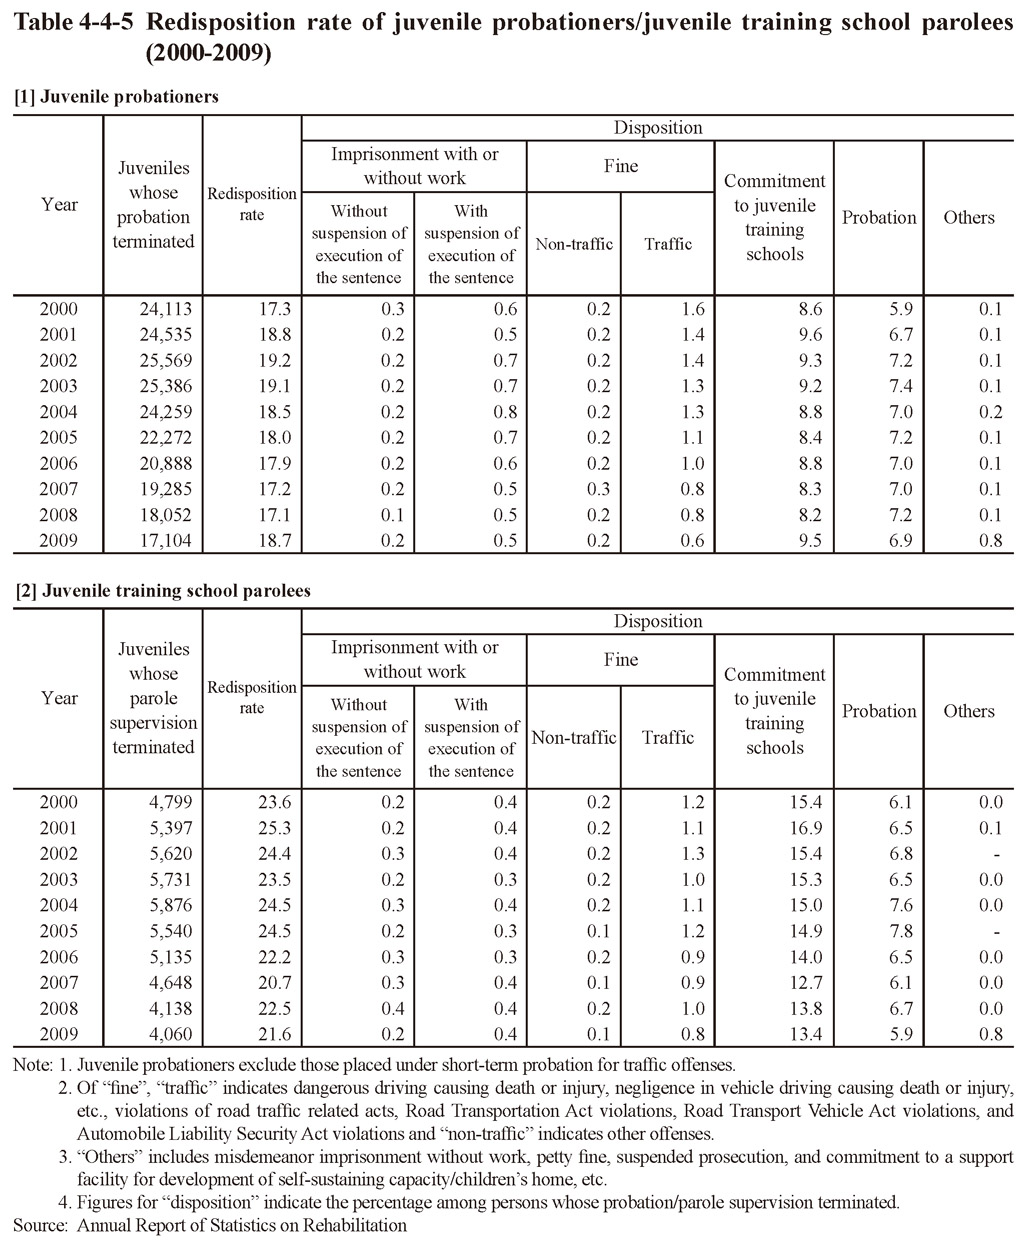
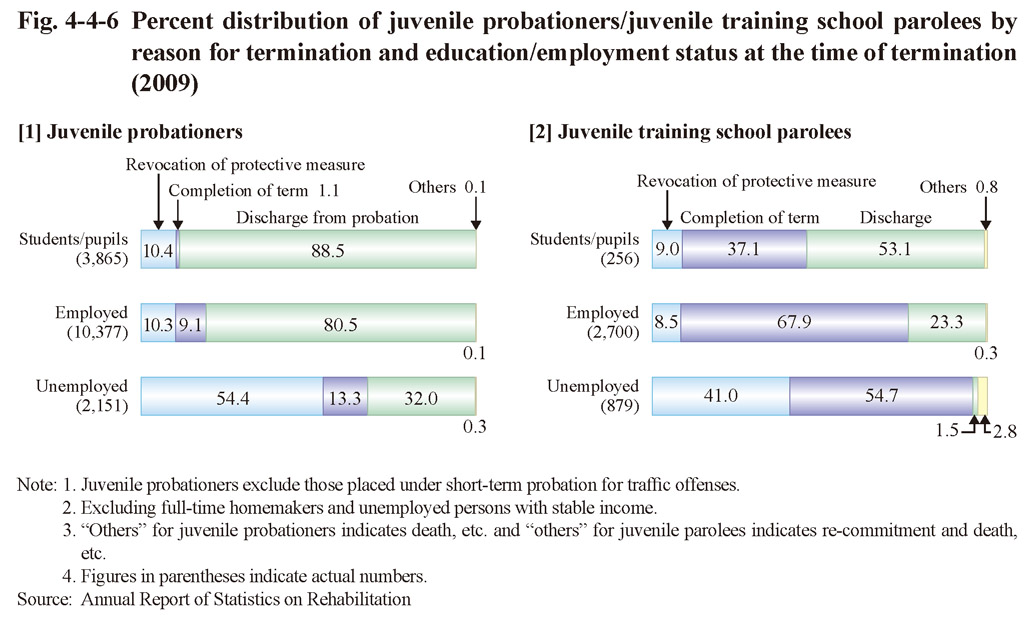
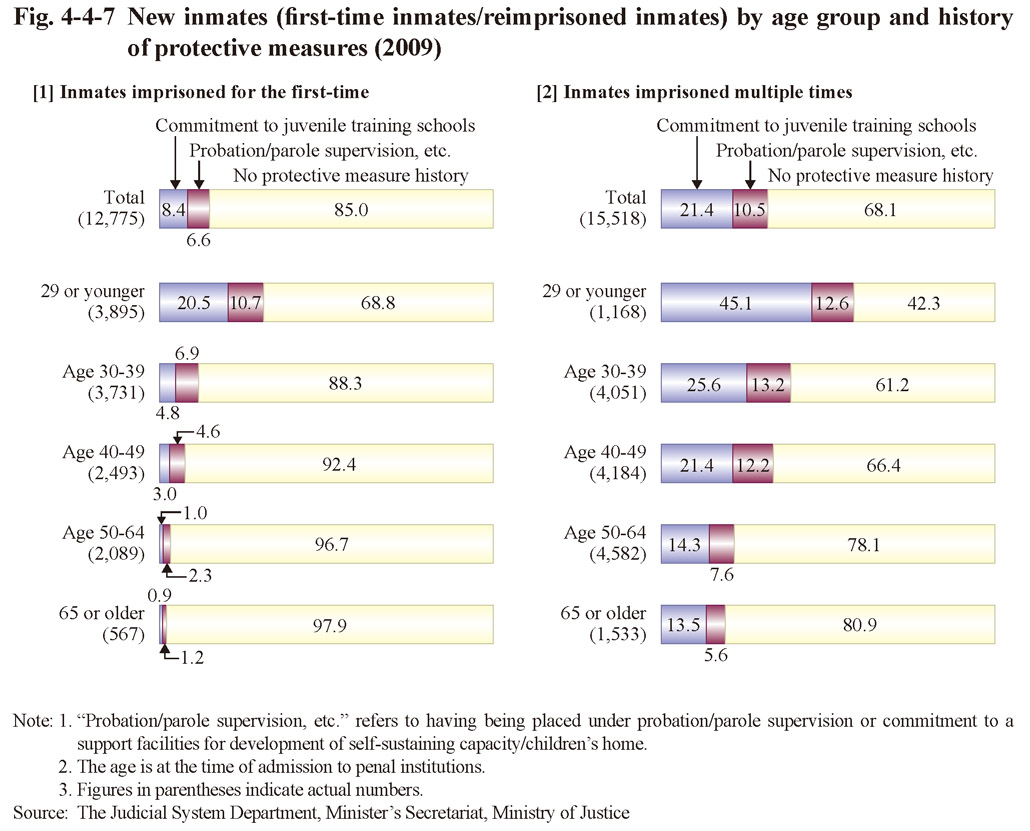
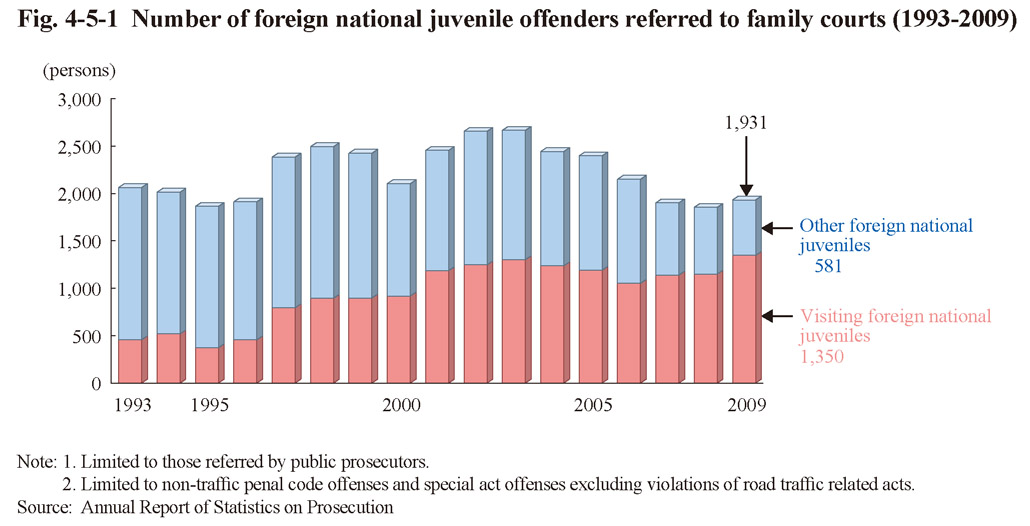 Fig. 4-5-1 Number of foreign national juvenile offenders referred to family courts (1993-2009)
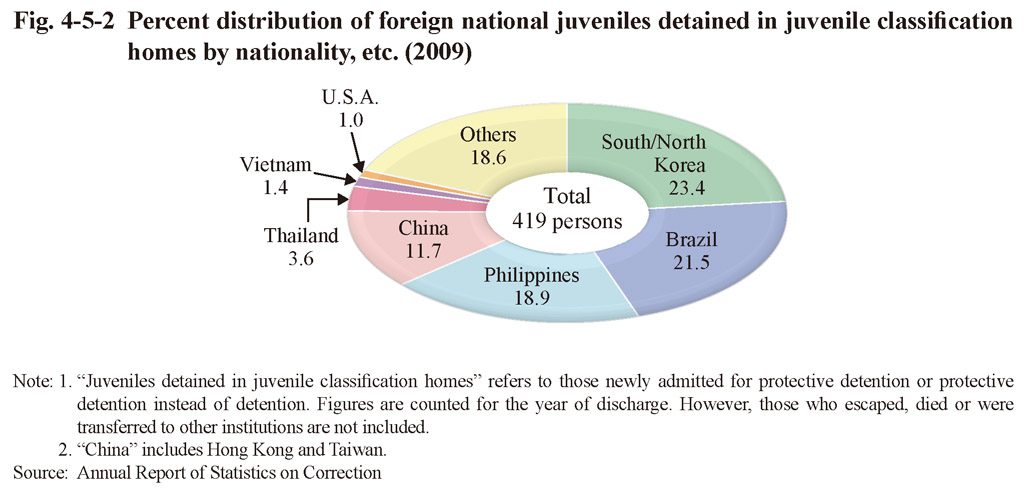
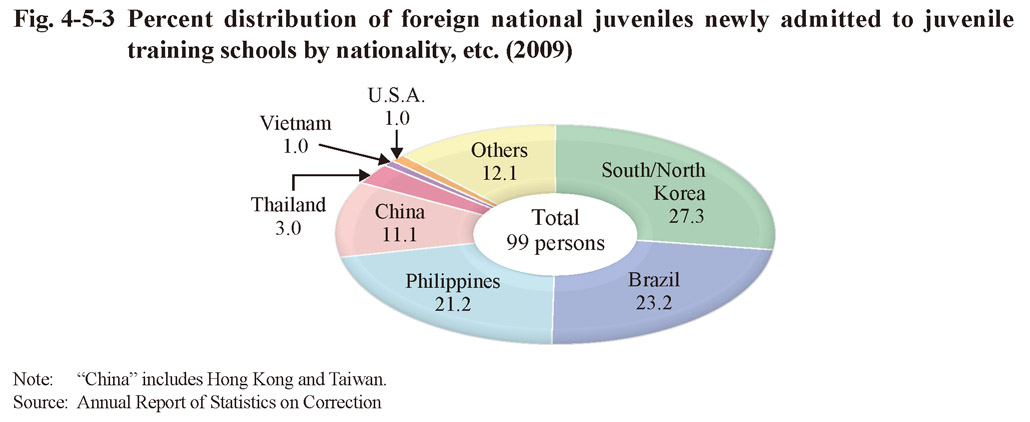
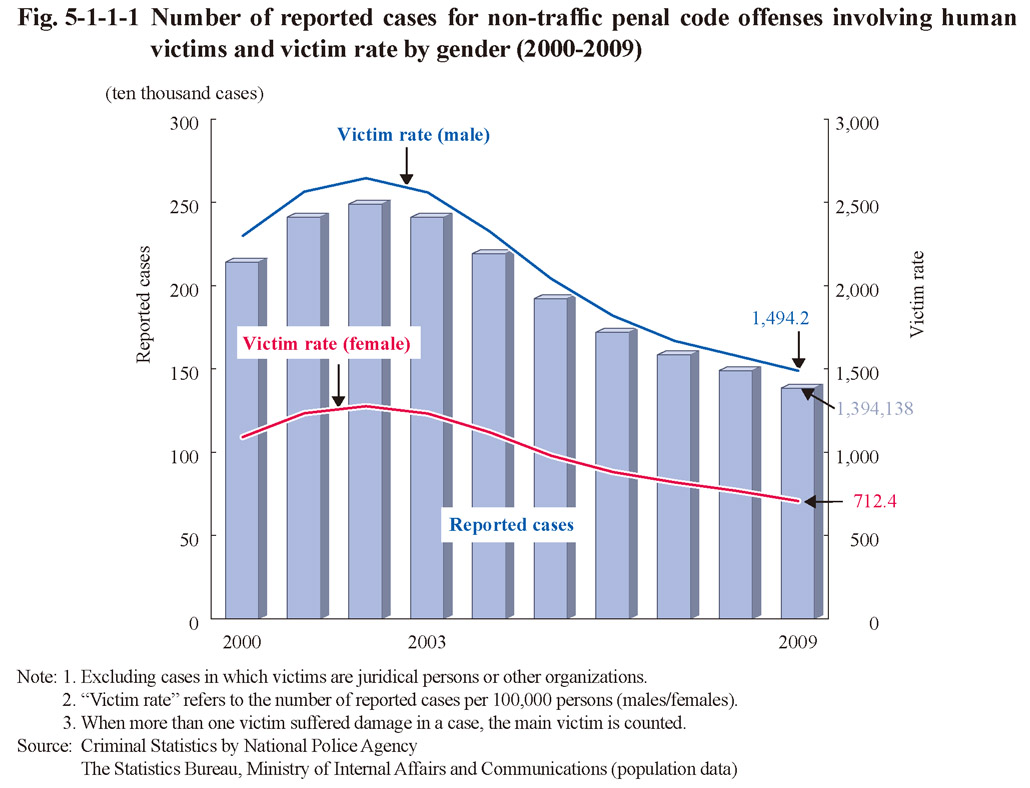
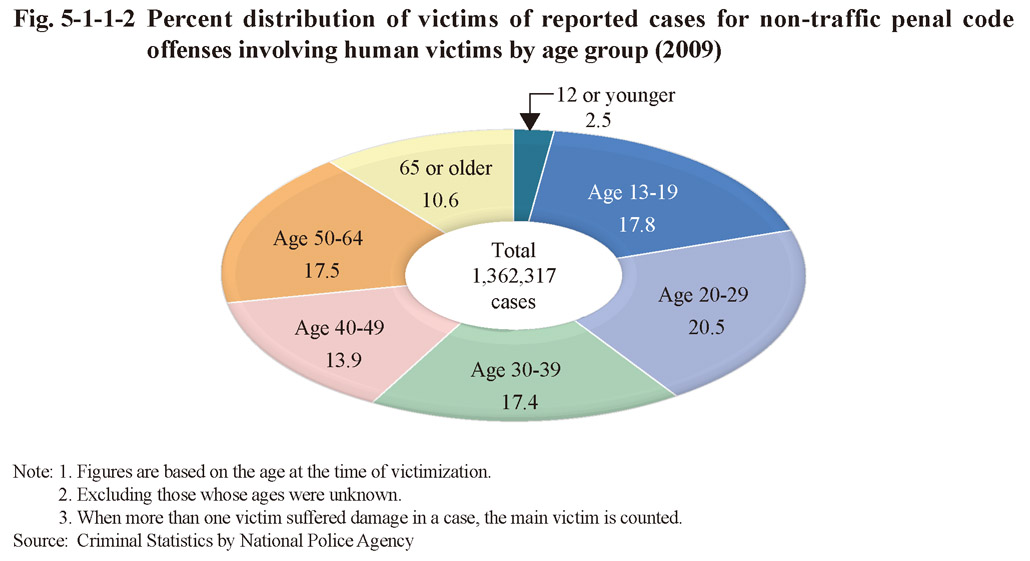
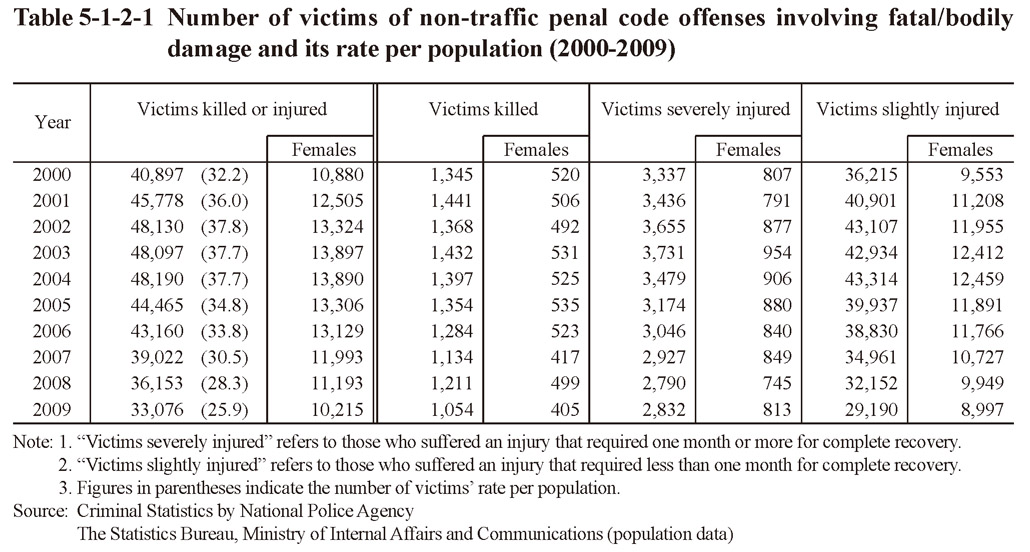
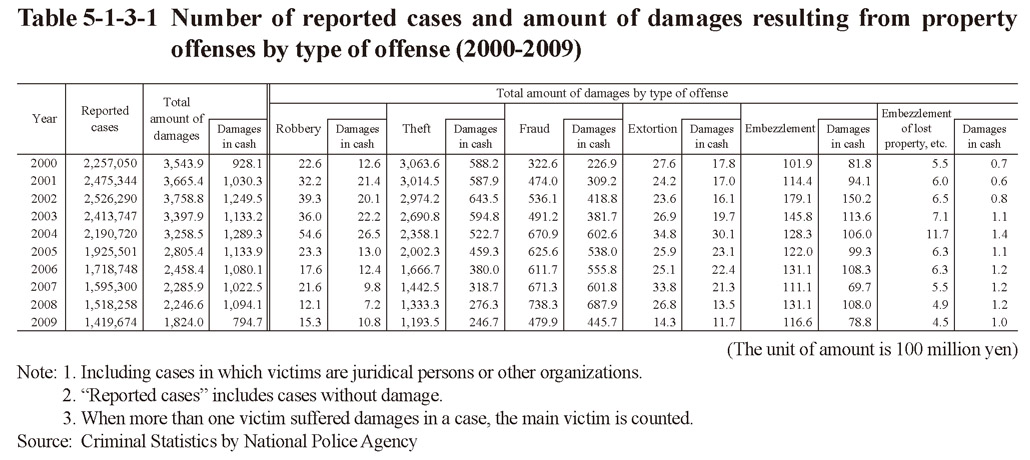
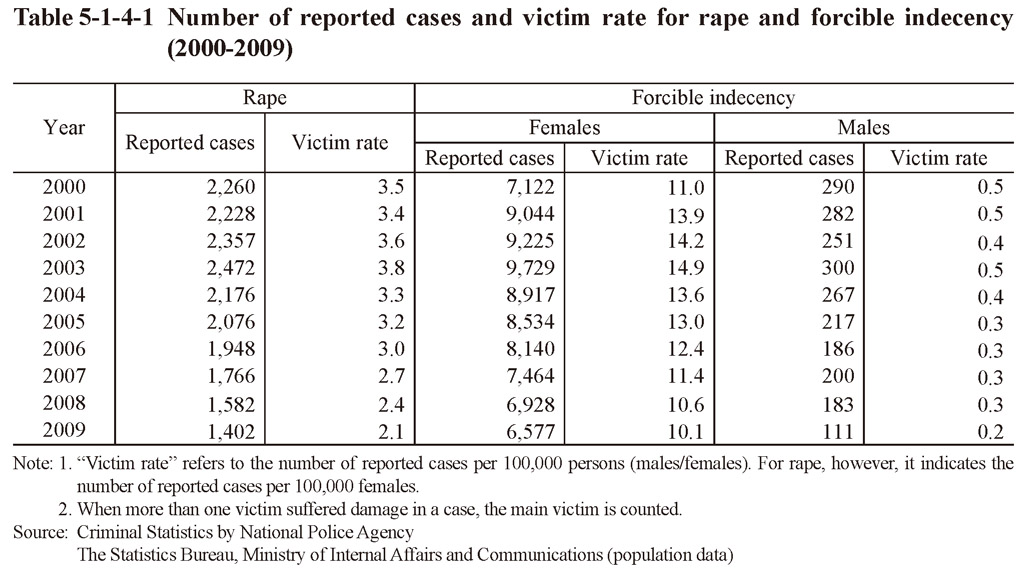 Table 5-1-4-1 Number of reported cases and victim rate for rape and forcible indecency (2000-2009)
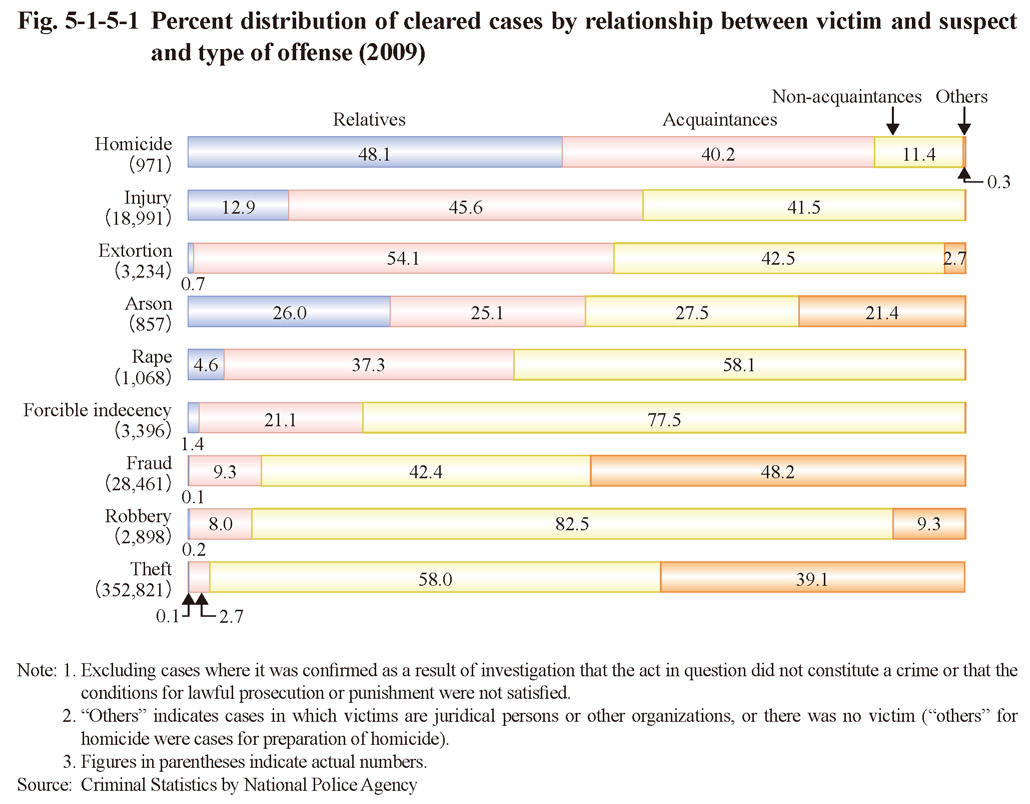
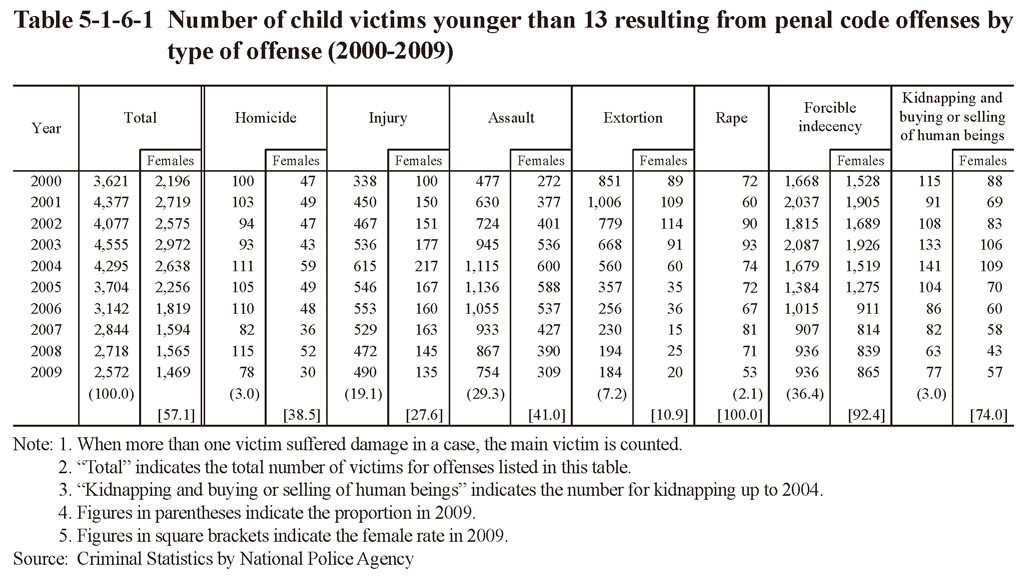
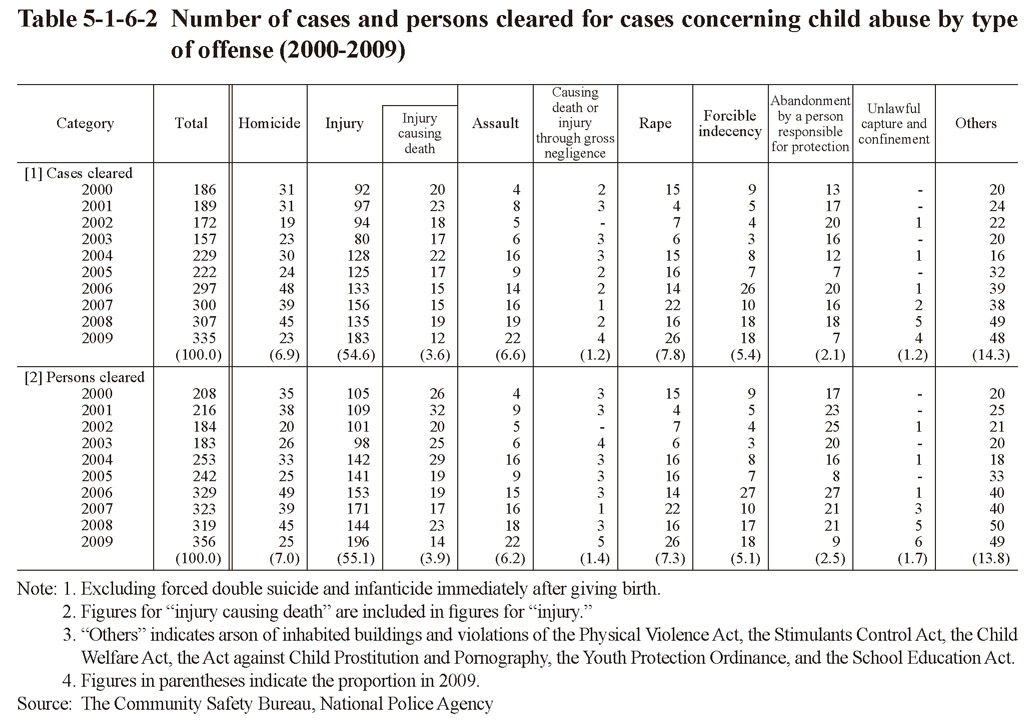
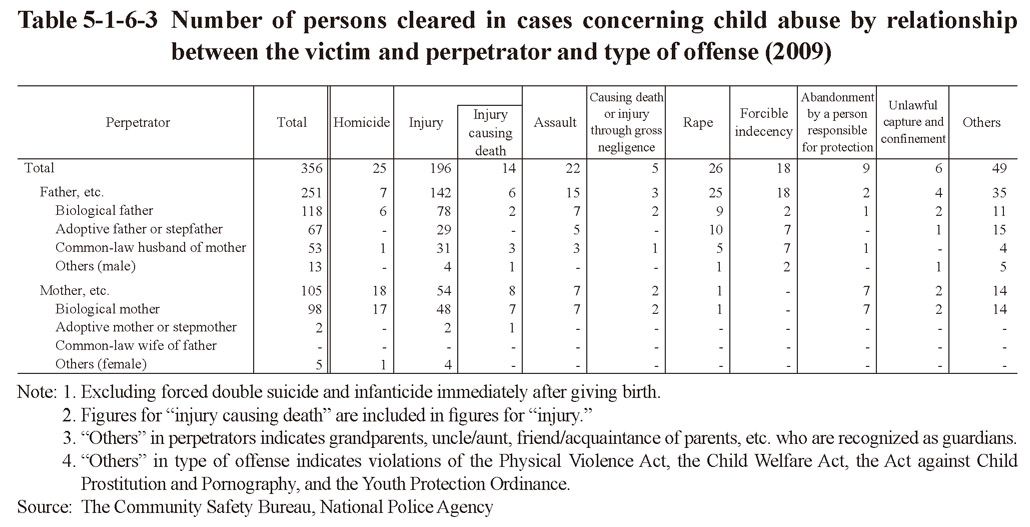
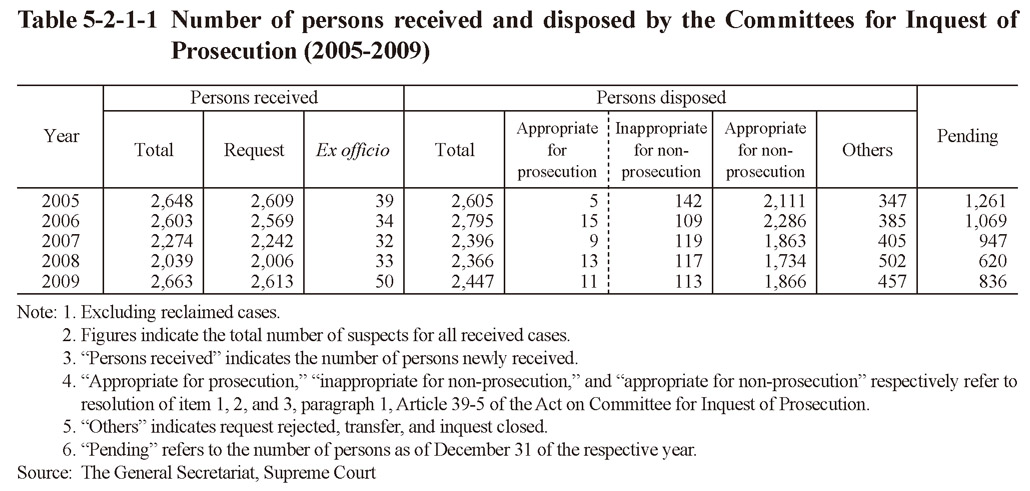
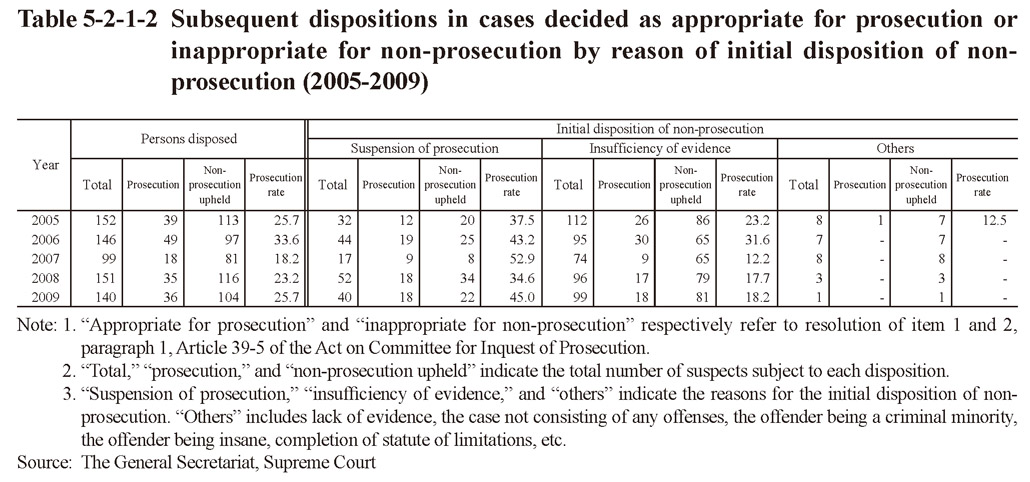
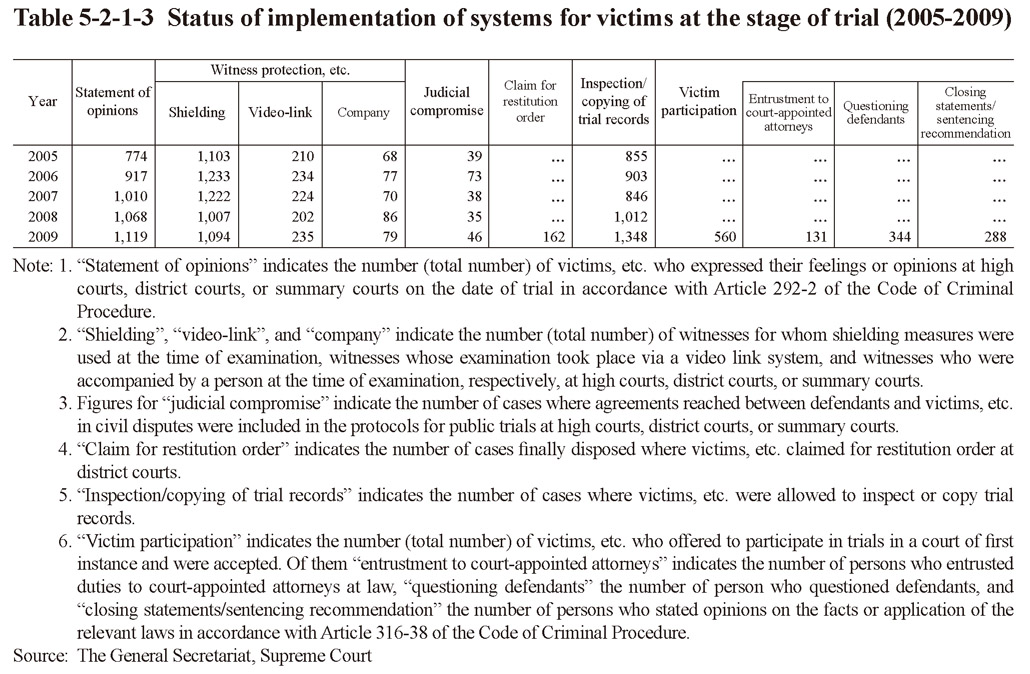 Table 5-2-1-3 Status of implementation of systems for victims at the stage of trial (2005-2009)
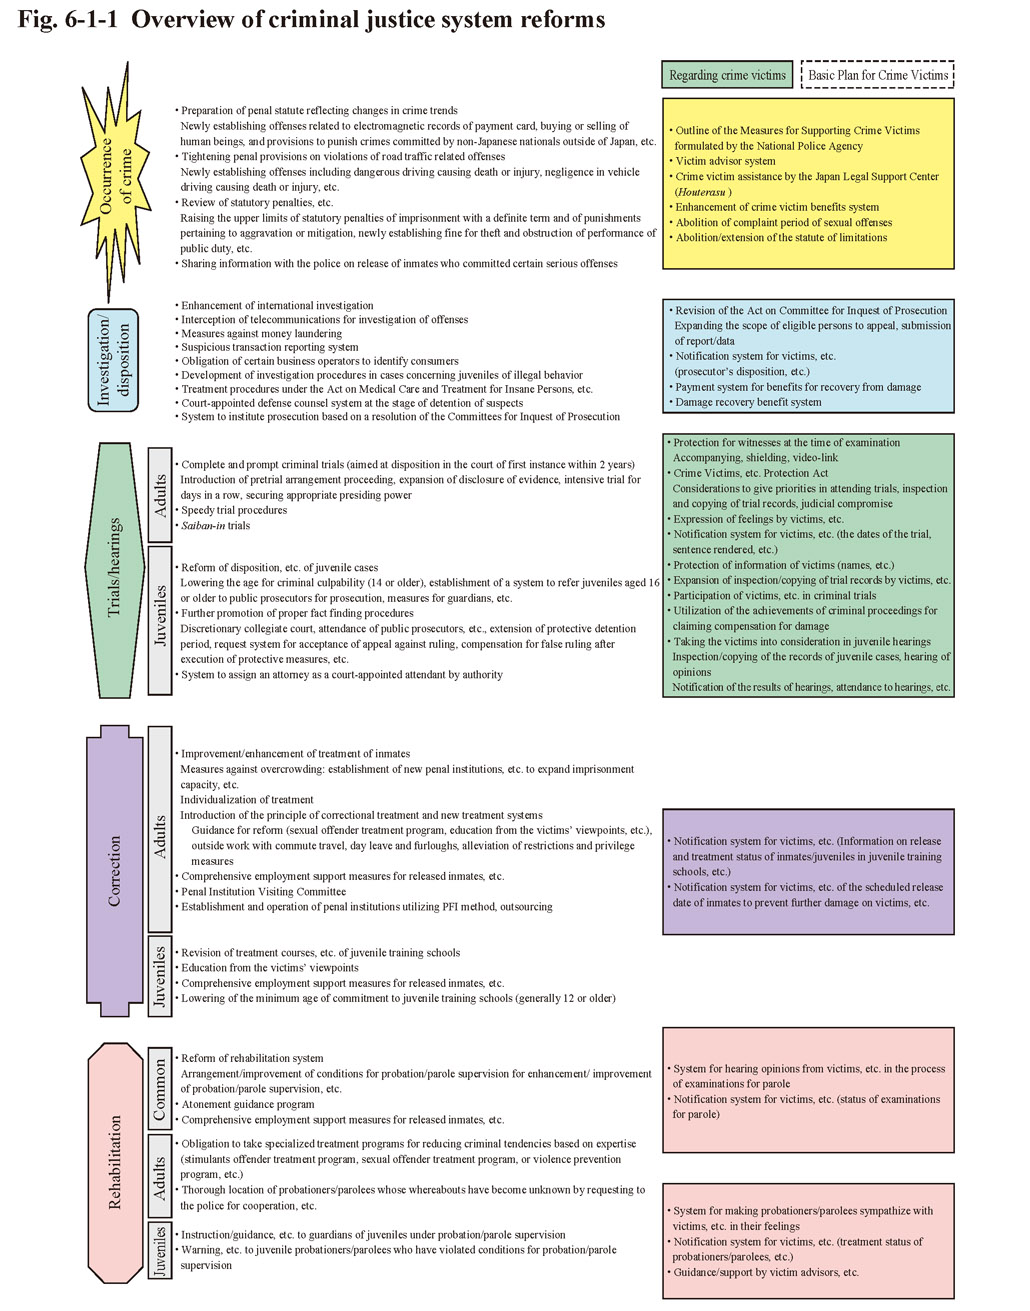 Fig. 6-1-1 Overview of criminal justice system reforms
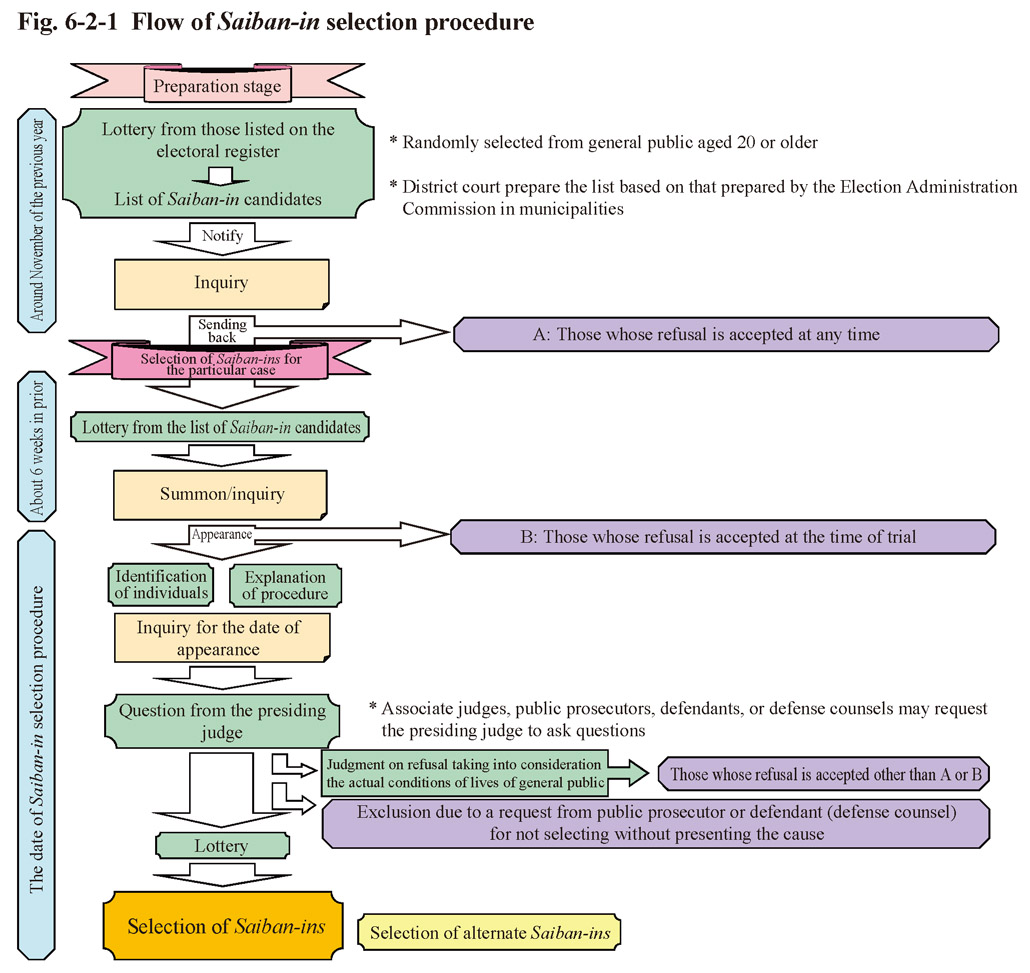 Fig. 6-2-1 Flow of Saiban-in selection procedure
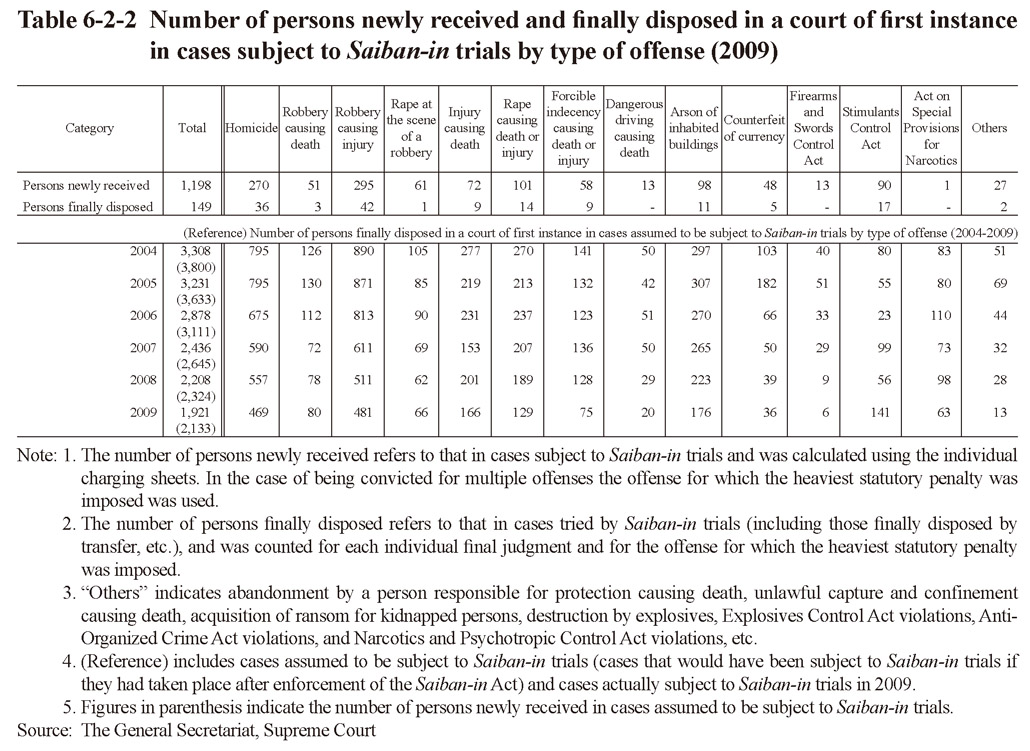
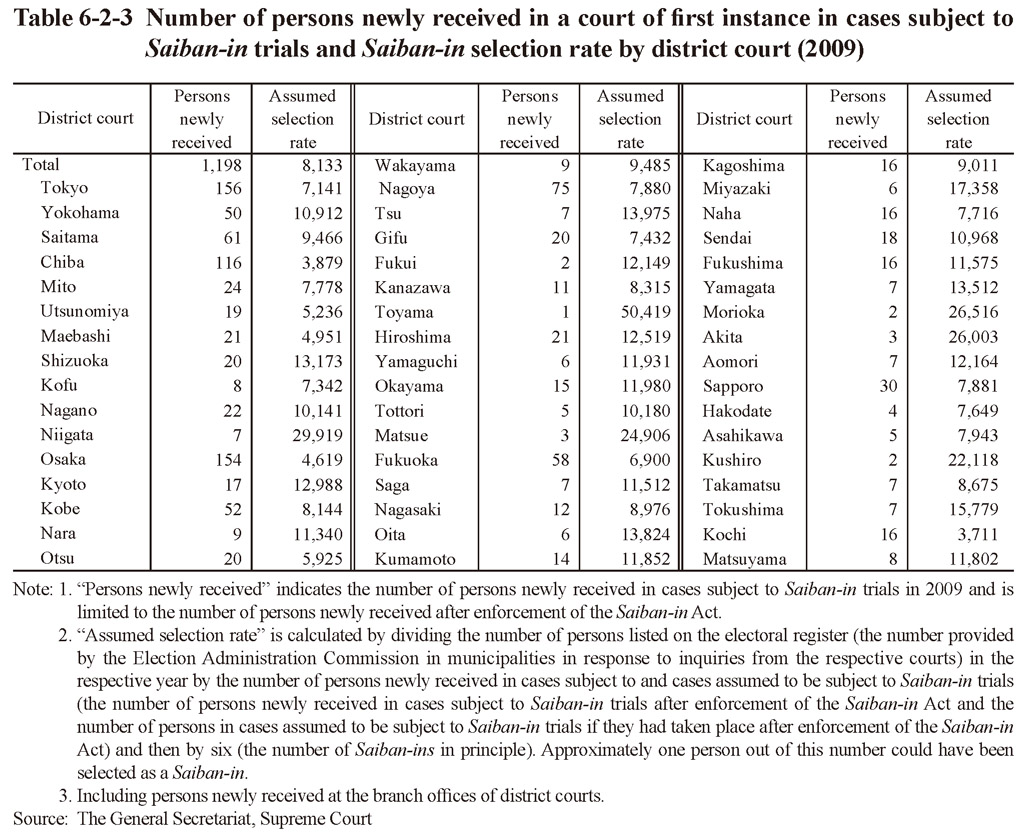
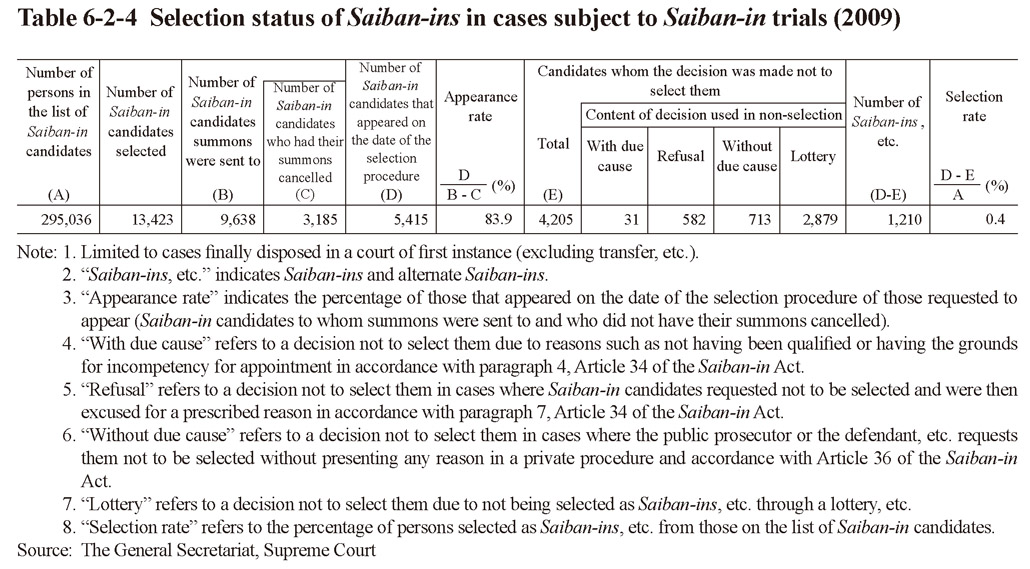 Table 6-2-4 Selection status of Saiban-ins in cases subject to Saiban-in trials (2009)
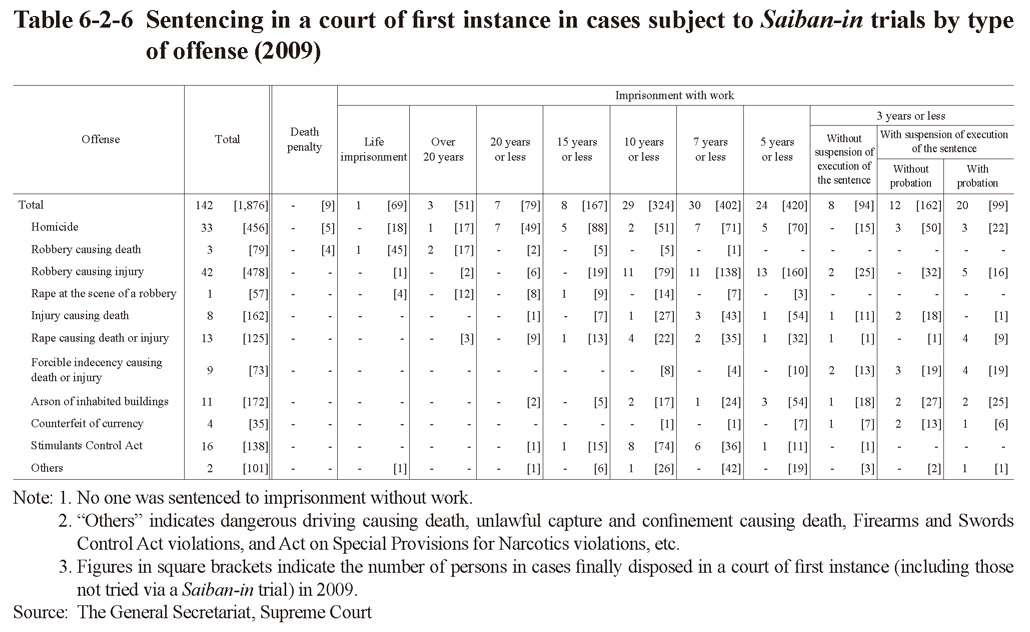
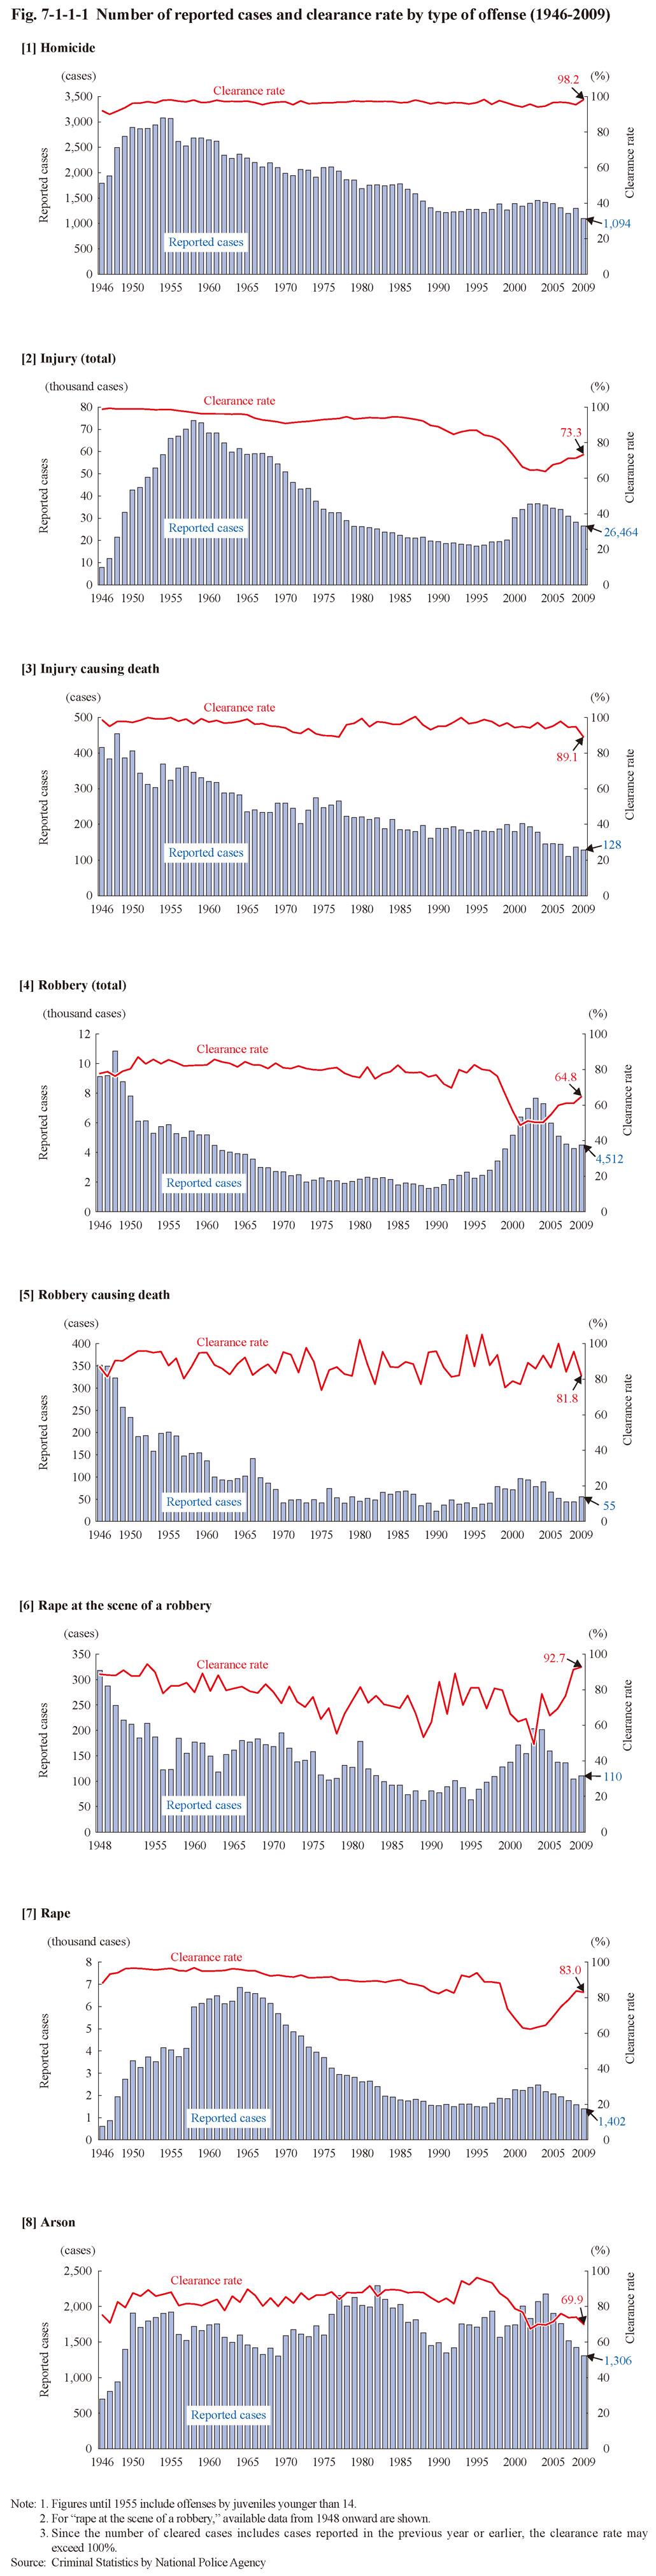 Fig. 7-1-1-1 Number of reported cases and clearance rate by type of offense (1946-2009)
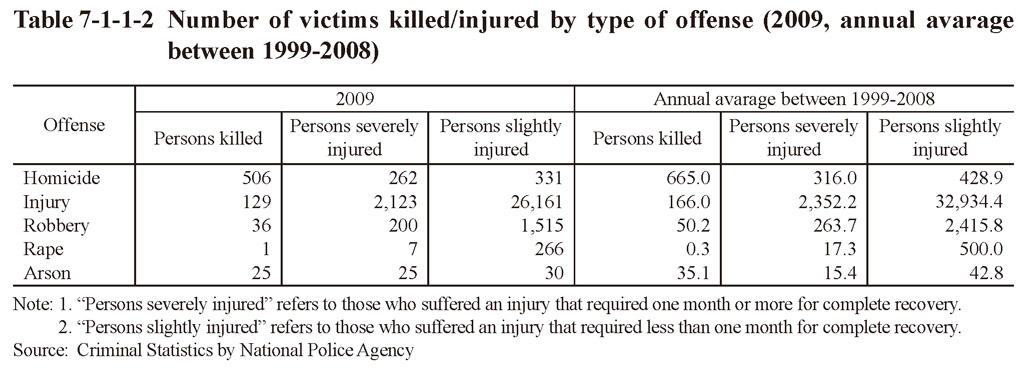
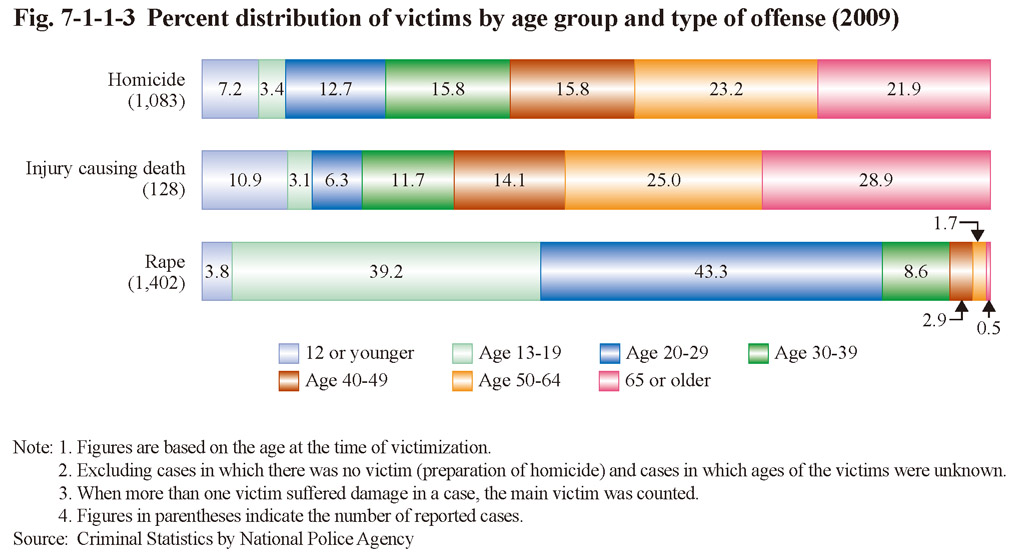 Fig. 7-1-1-3 Percent distribution of victims by age group and type of offense (2009)
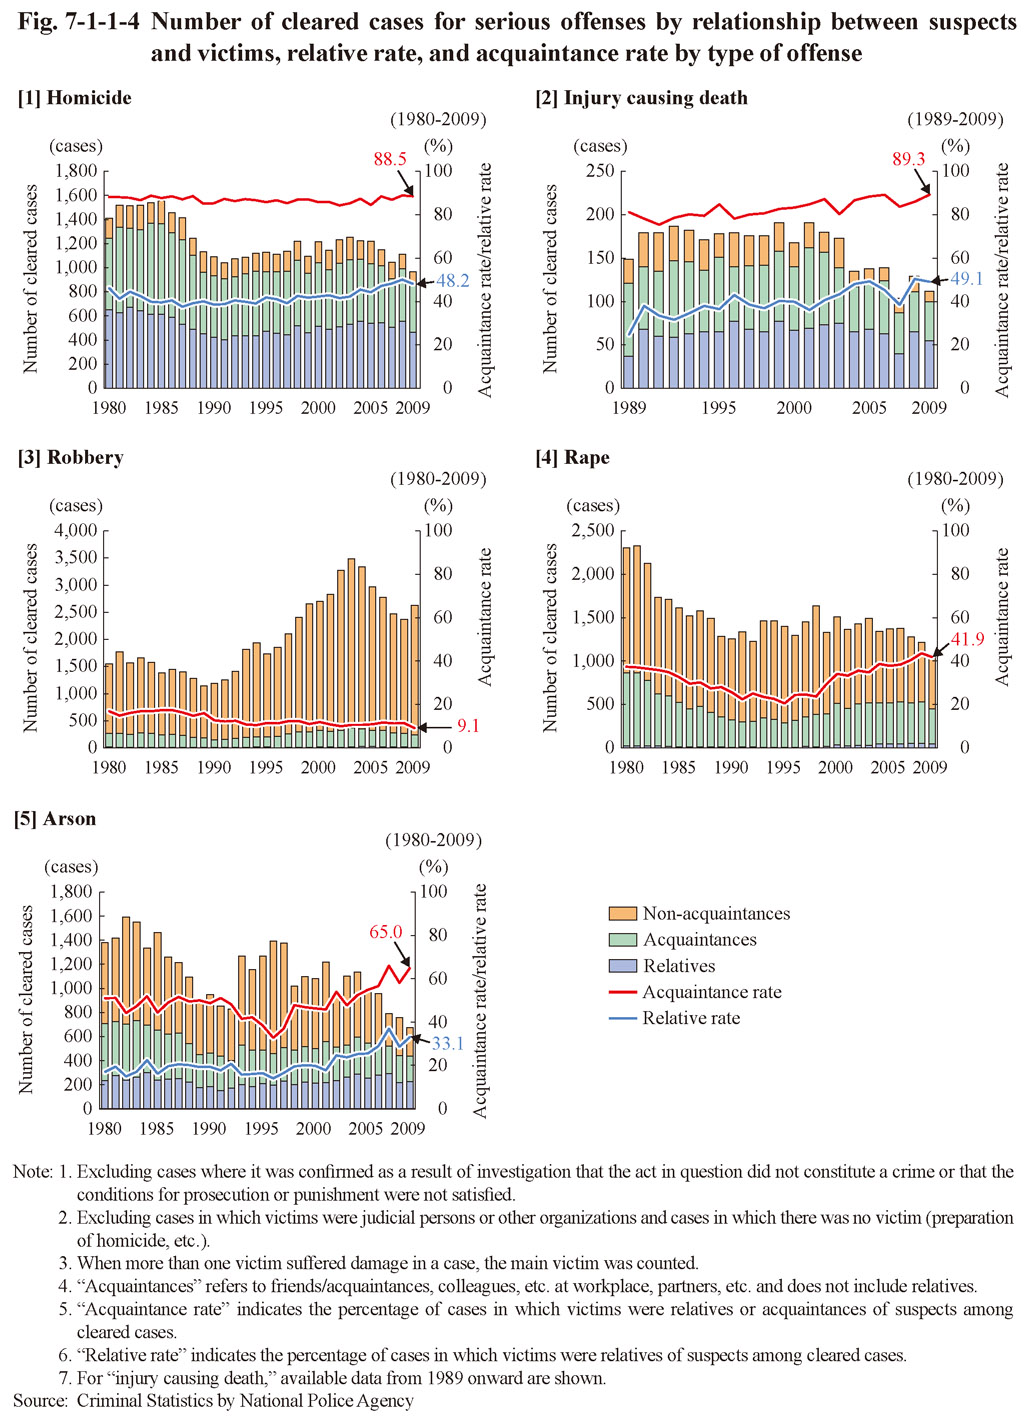
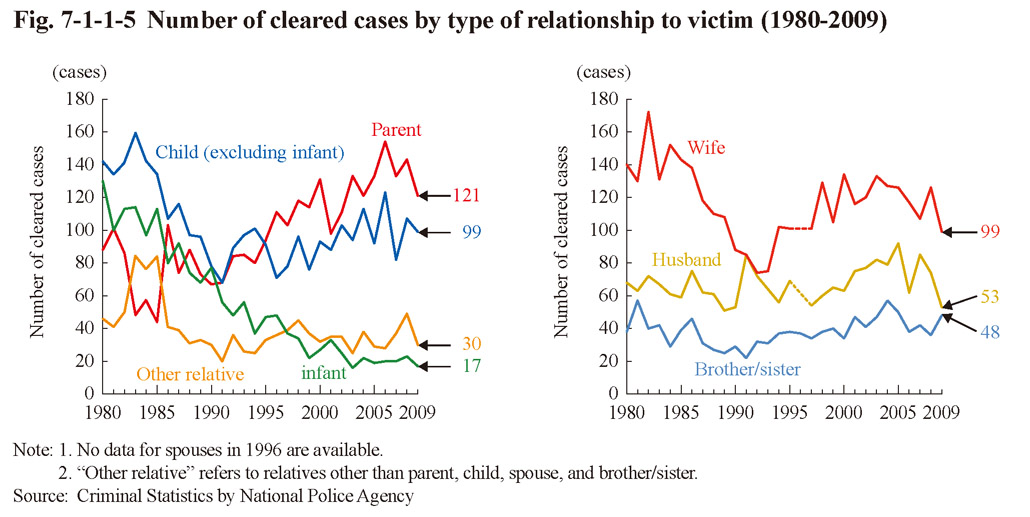 Fig. 7-1-1-5 Number of cleared cases by type of relationship to victim (1980-2009)
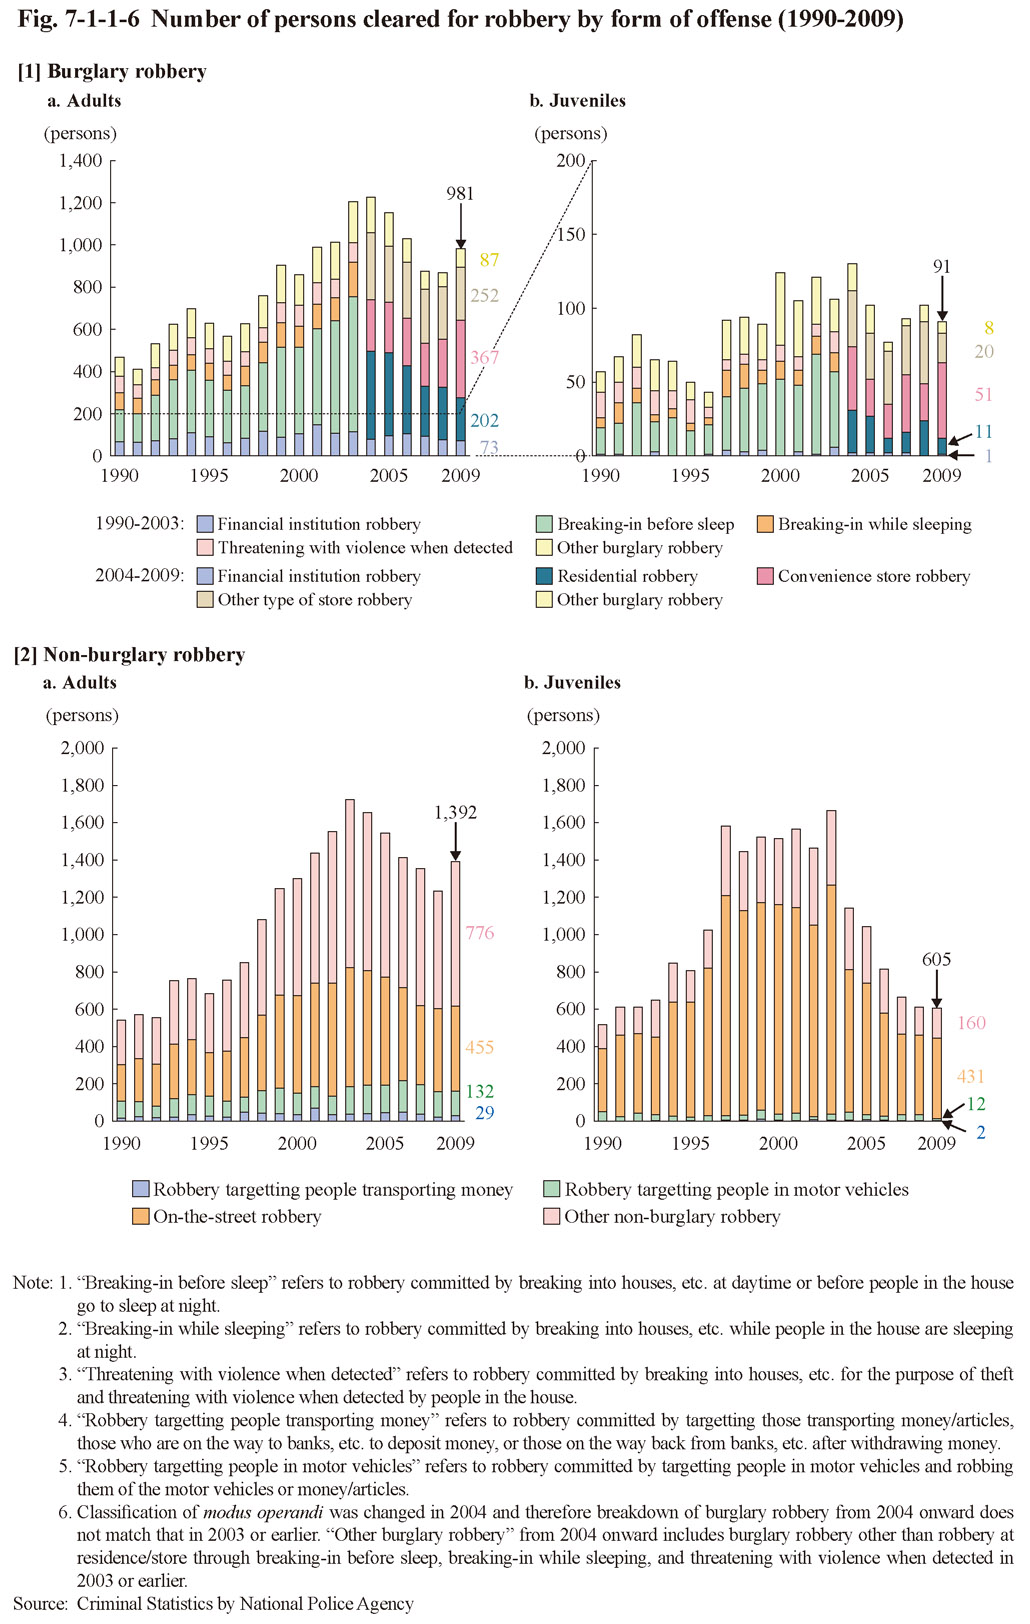 Fig. 7-1-1-6 Number of persons cleared for robbery by form of offense (1990-2009)
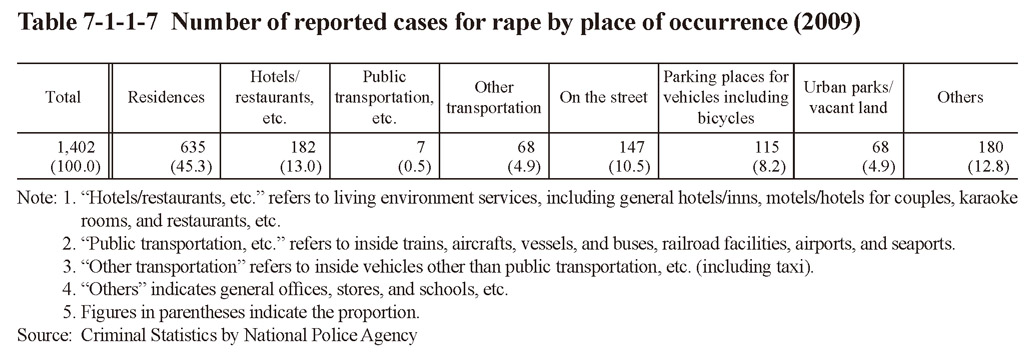 Table 7-1-1-7 Number of reported cases for rape by place of occurrence (2009)
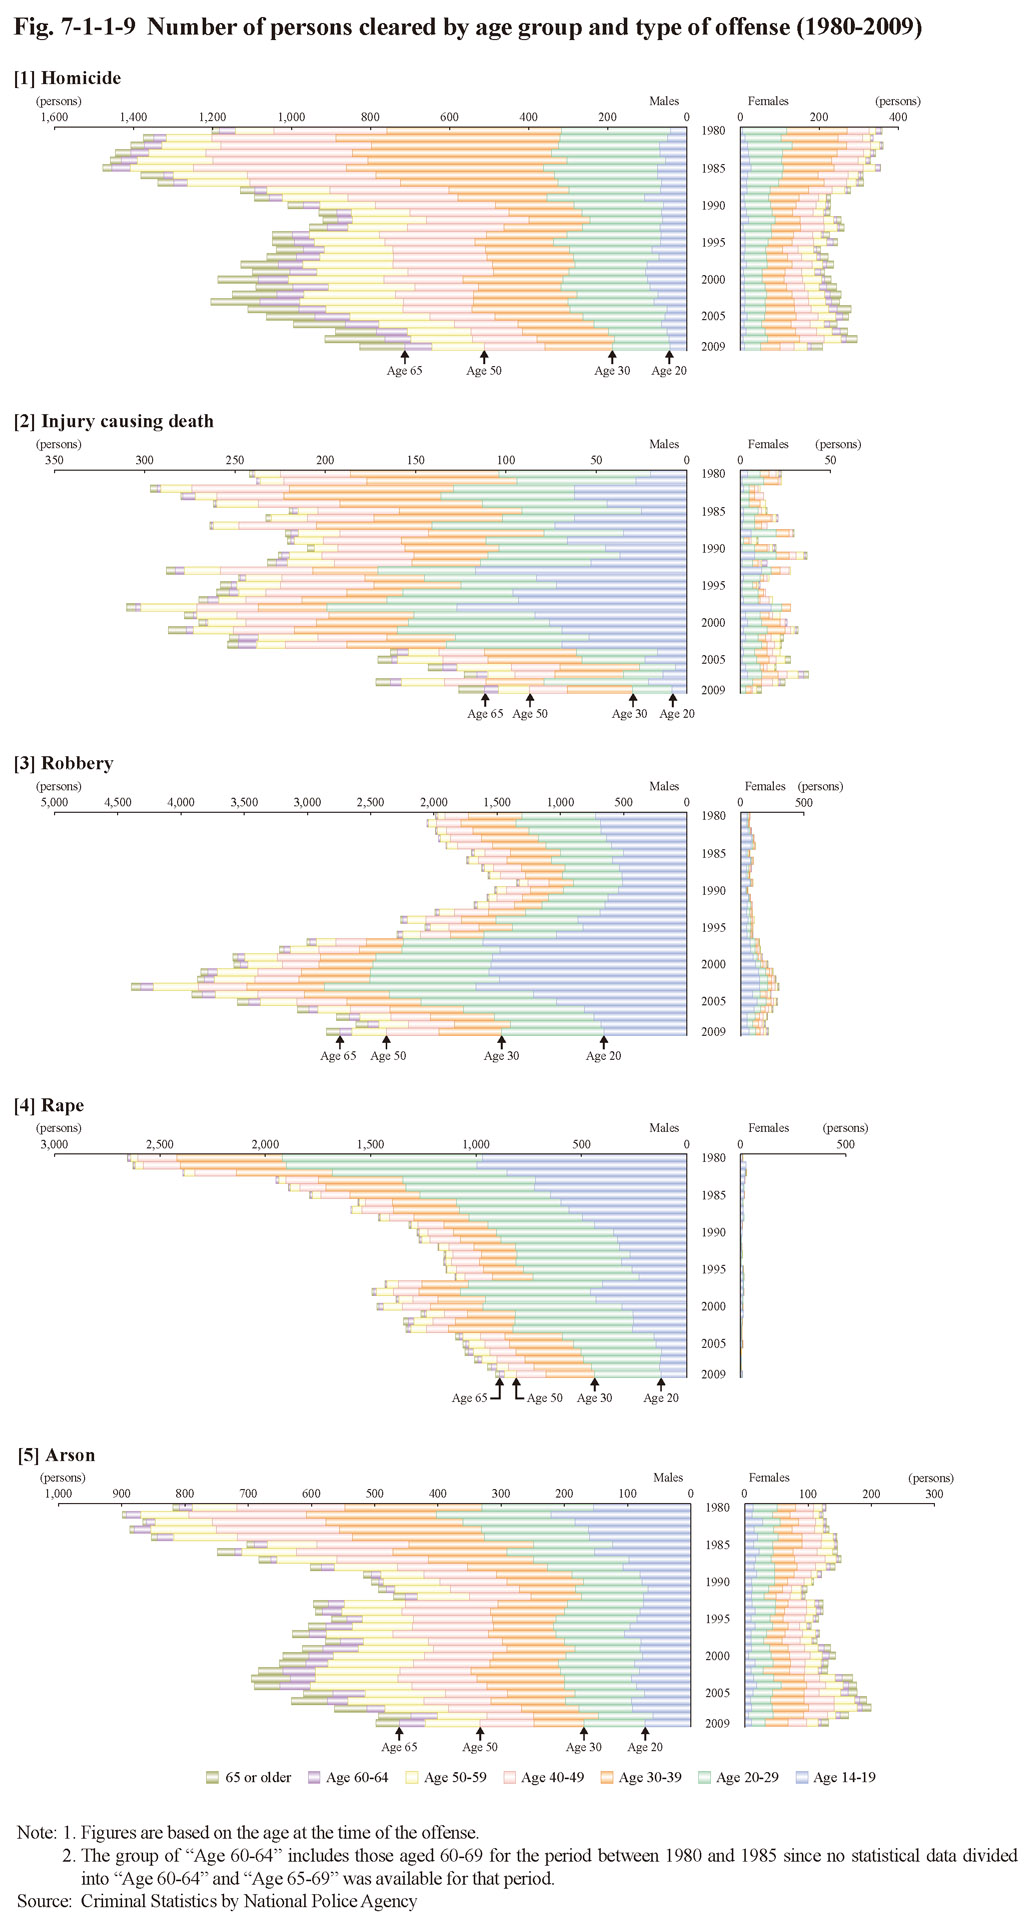 Fig. 7-1-1-9 Number of persons cleared by age group and type of offense (1980-2009)
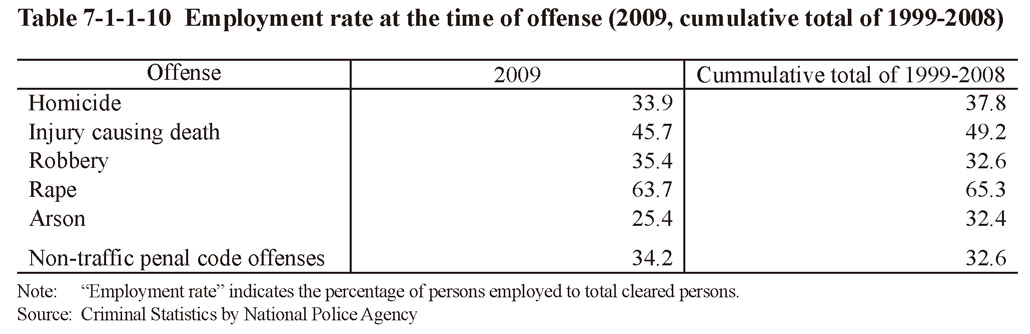 Table 7-1-1-10 Employment rate at the time of offense (2009, cumulative total of 1999-2008)
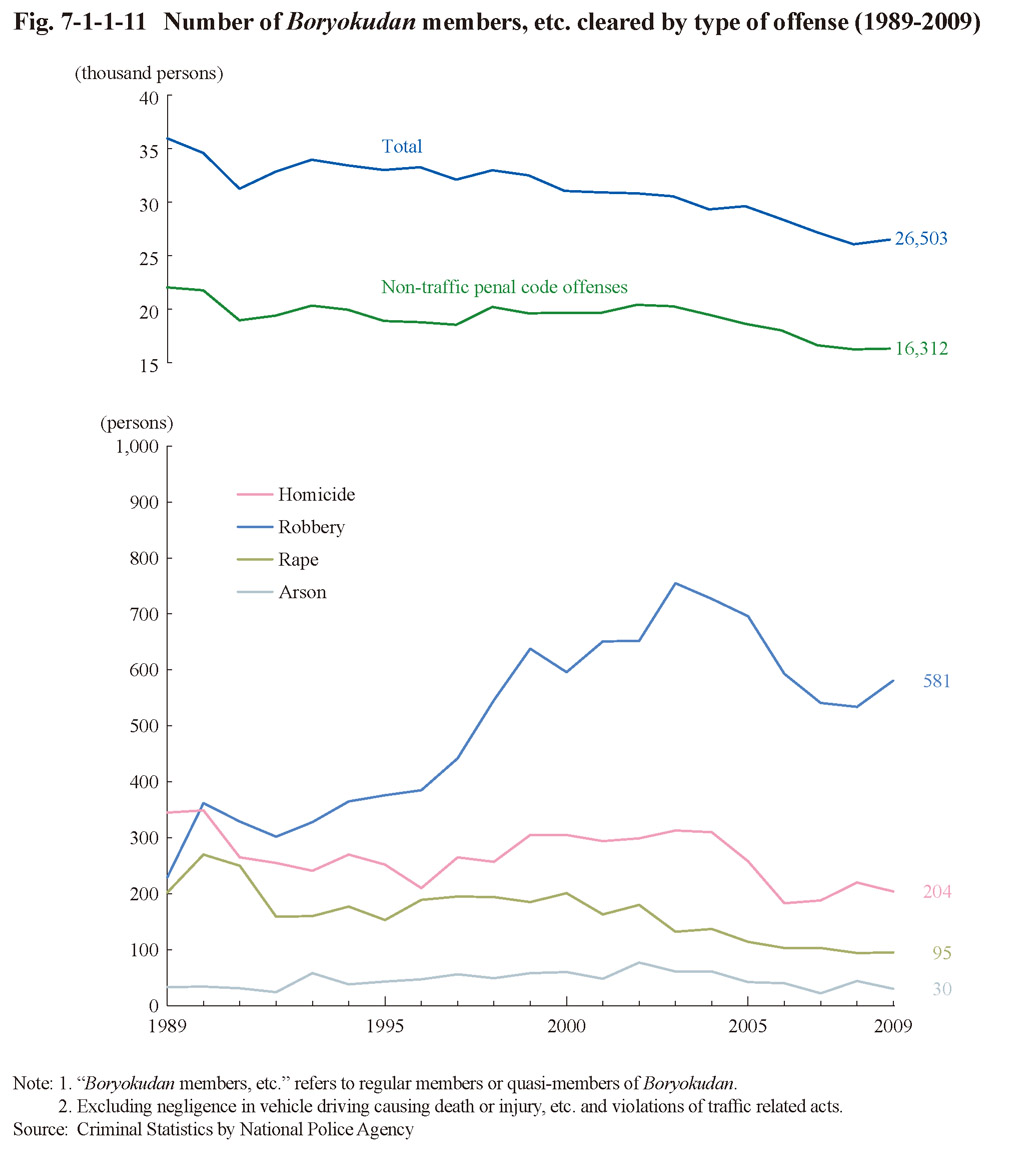 Fig. 7-1-1-11 Number of Boryokudan members, etc. cleared by type of offense (1989-2009)
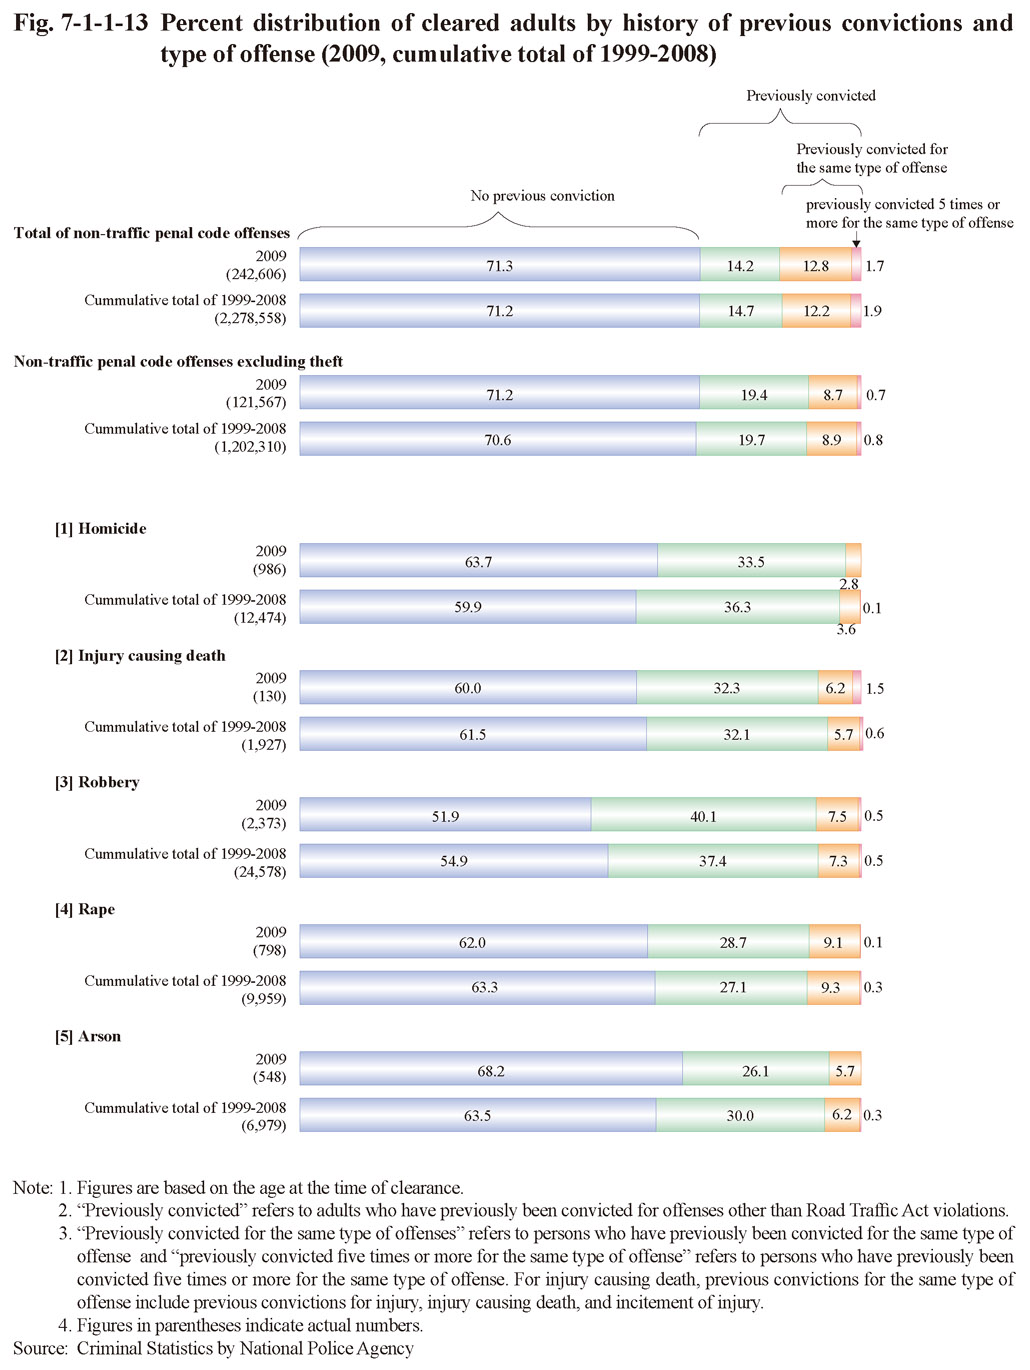
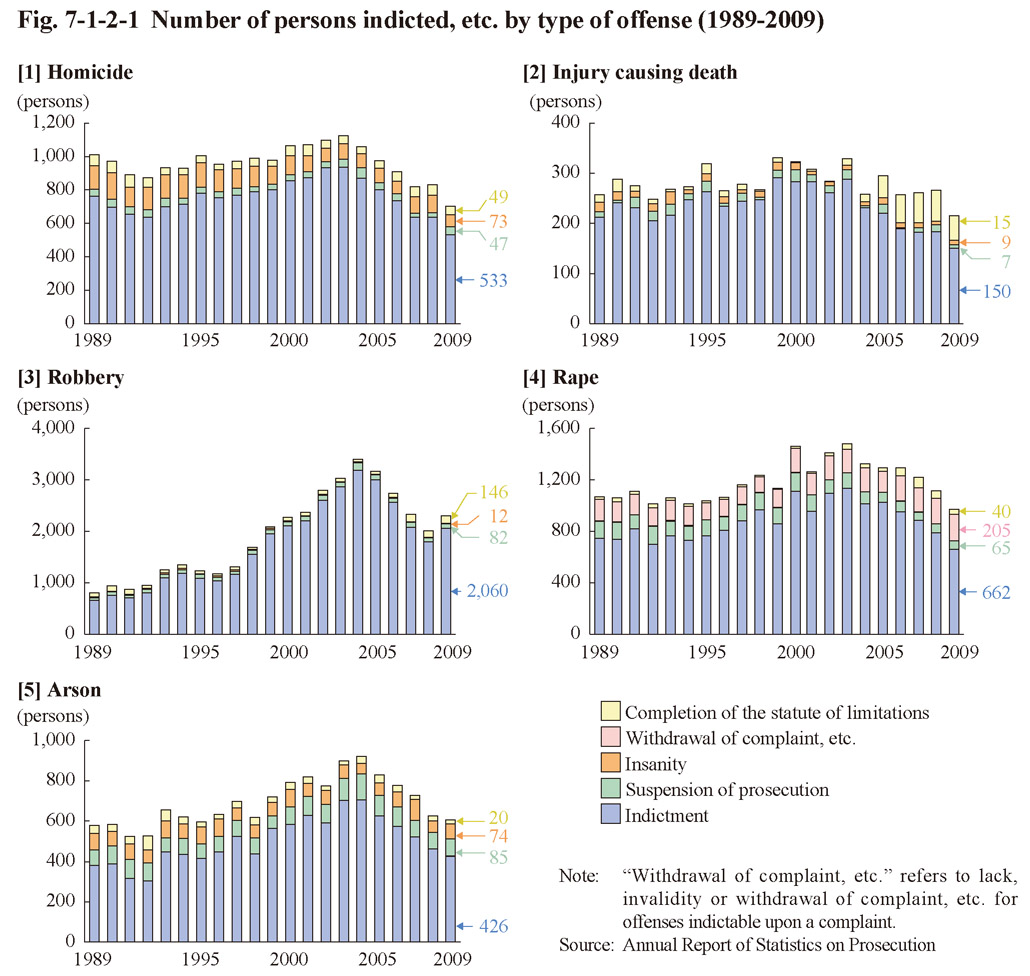 Fig. 7-1-2-1 Number of persons indicted, etc. by type of offense (1989-2009)
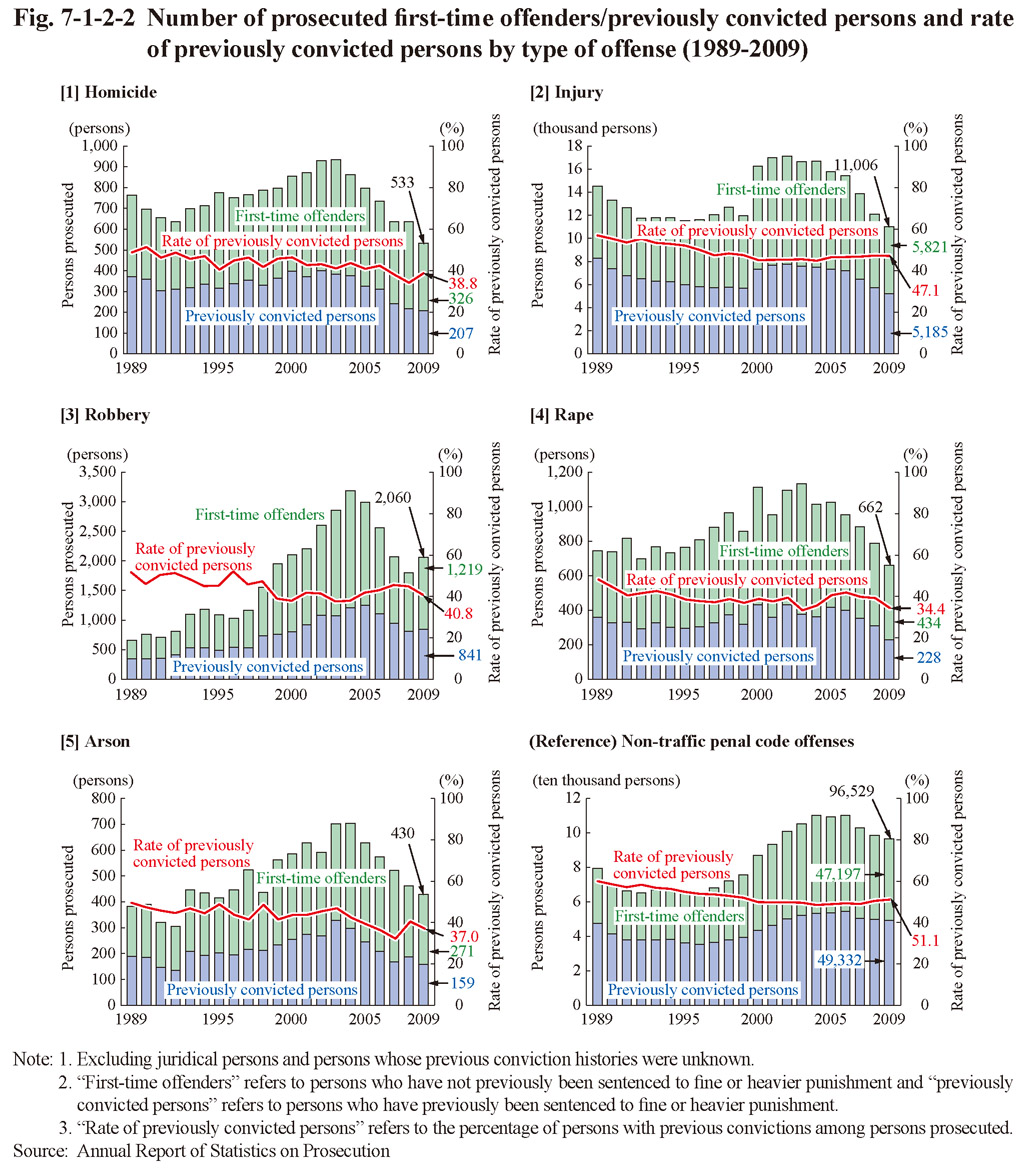
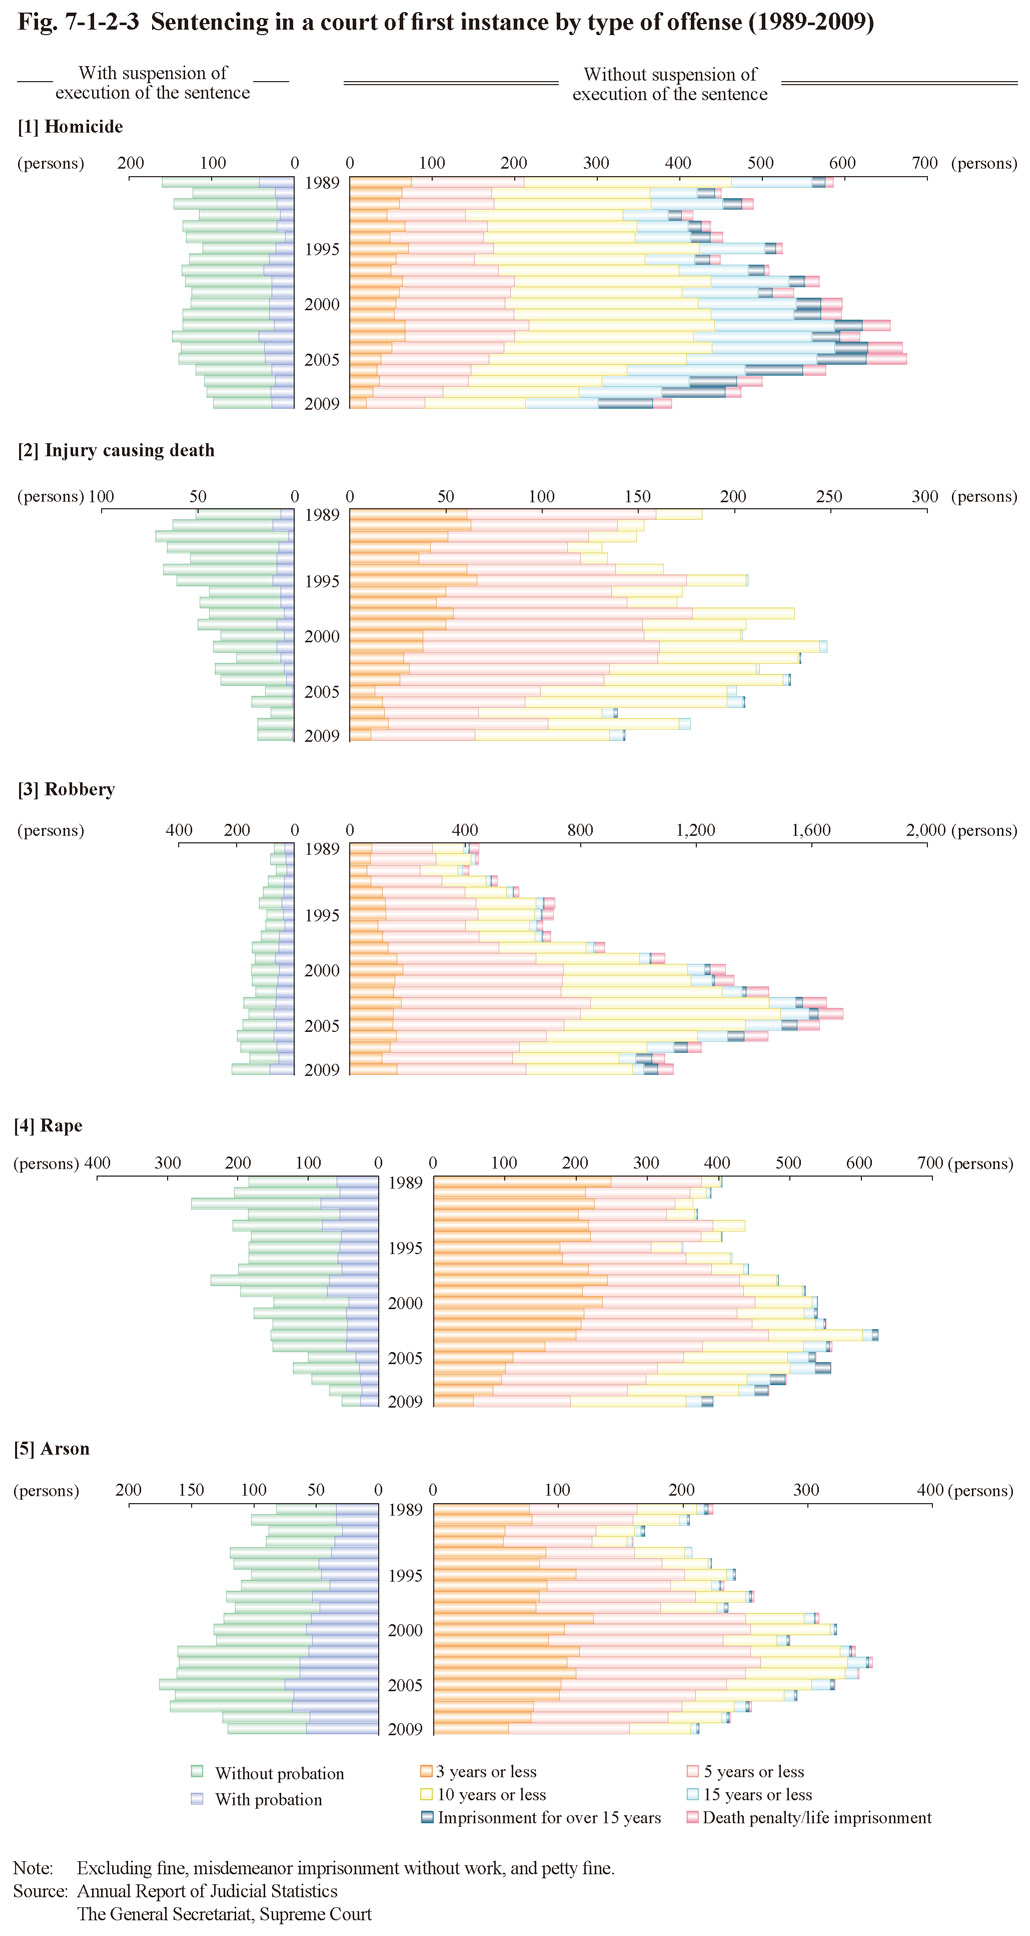 Fig. 7-1-2-3 Sentencing in a court of first instance by type of offense (1989-2009)
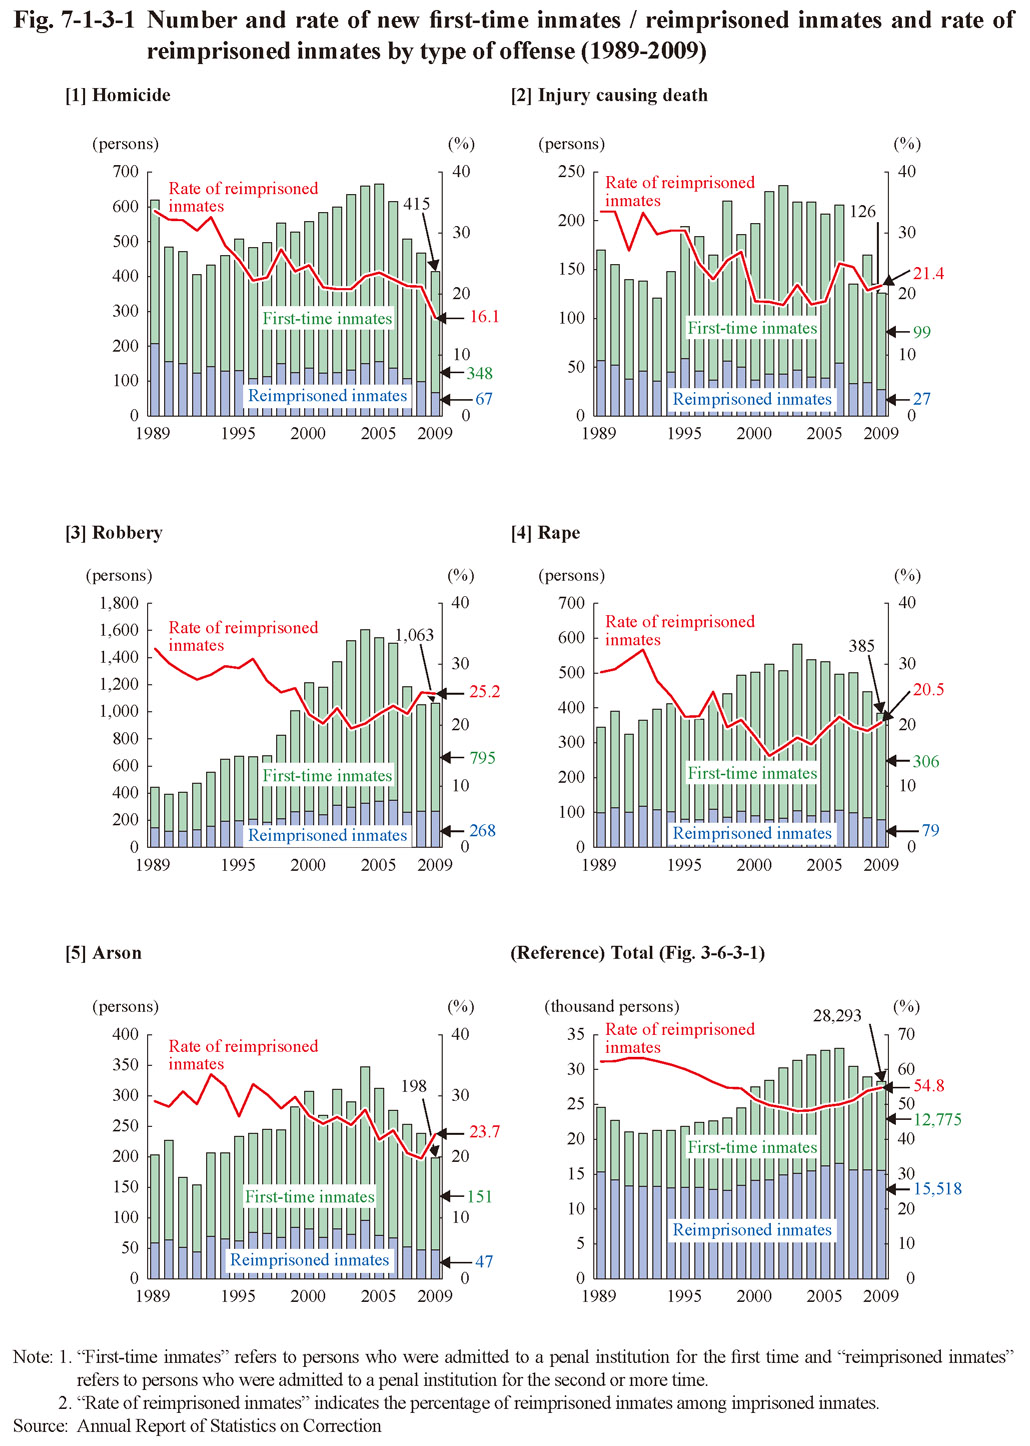
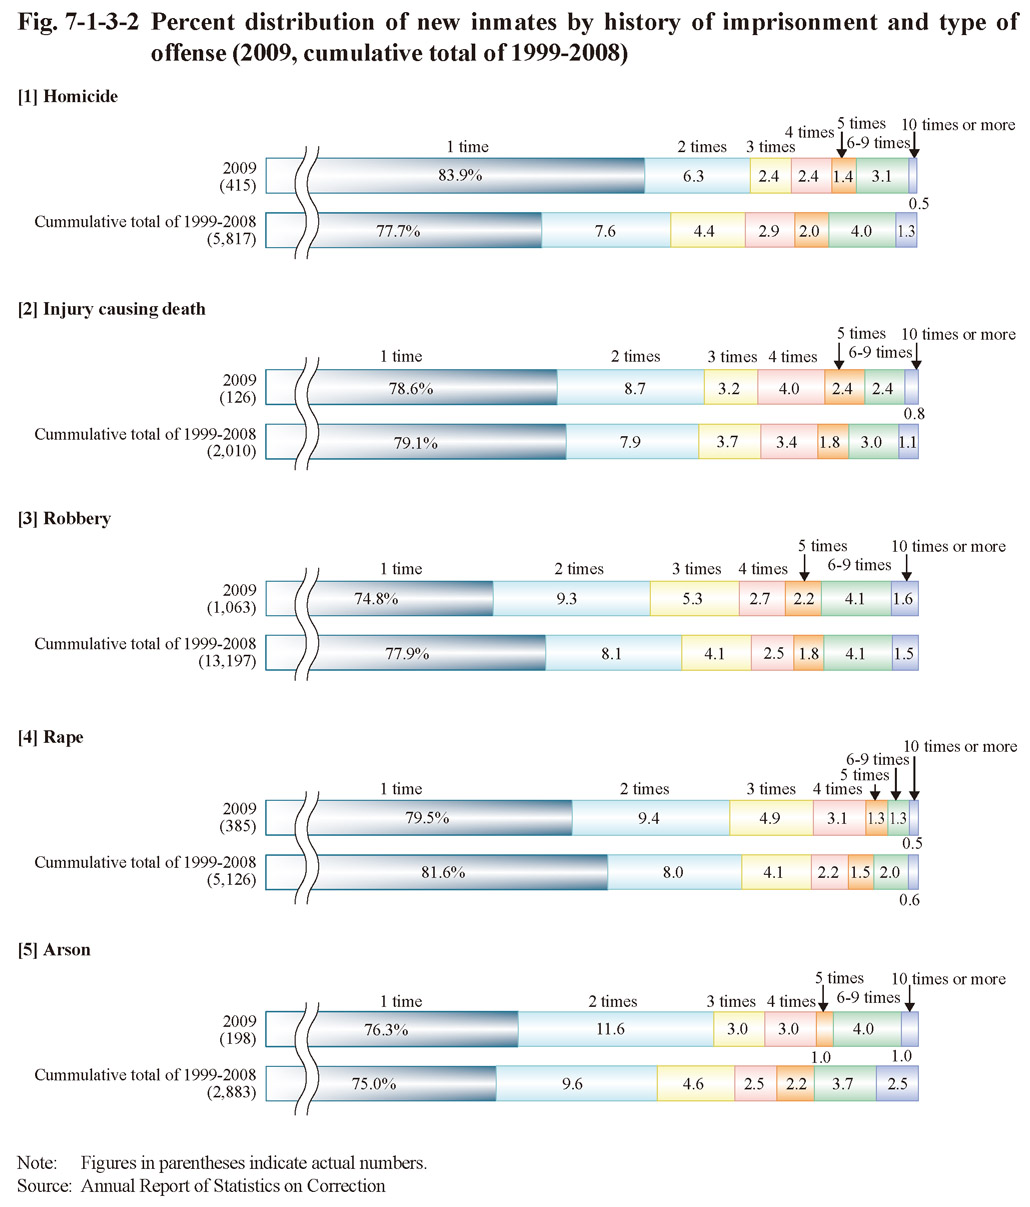
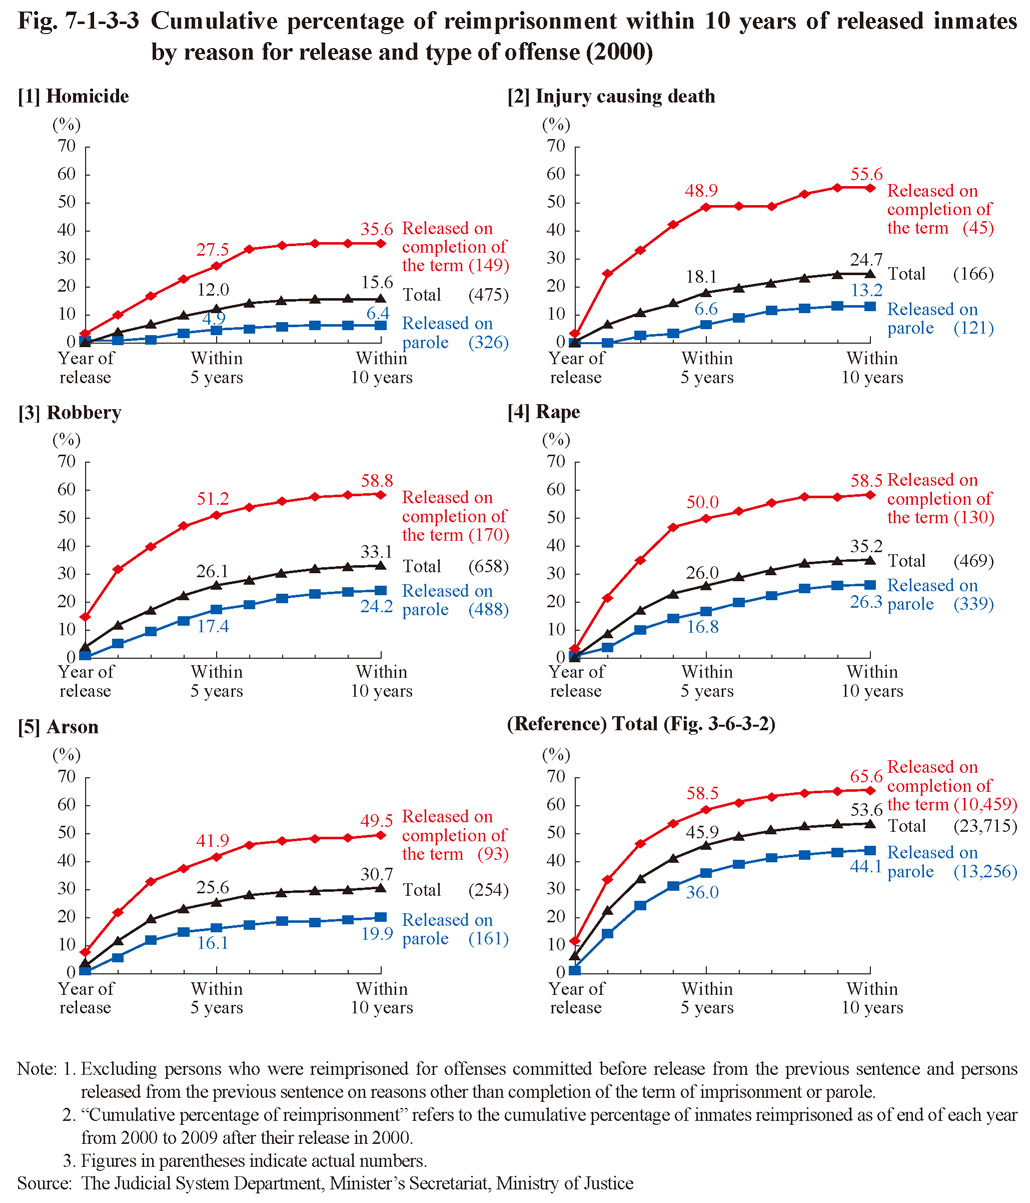
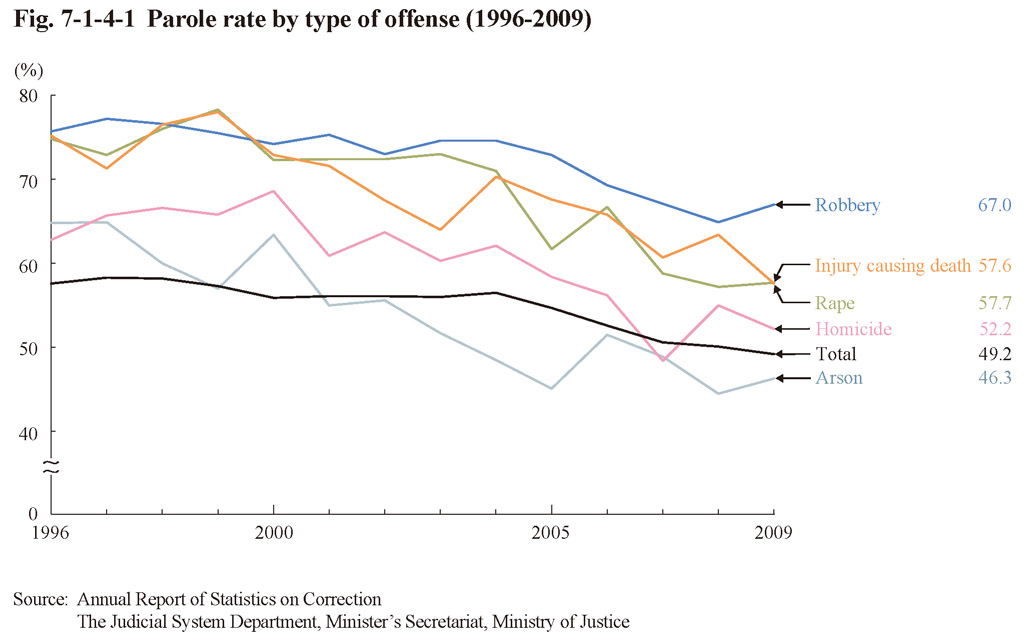 Fig. 7-1-4-1 Parole rate by type of offense (1996-2009)
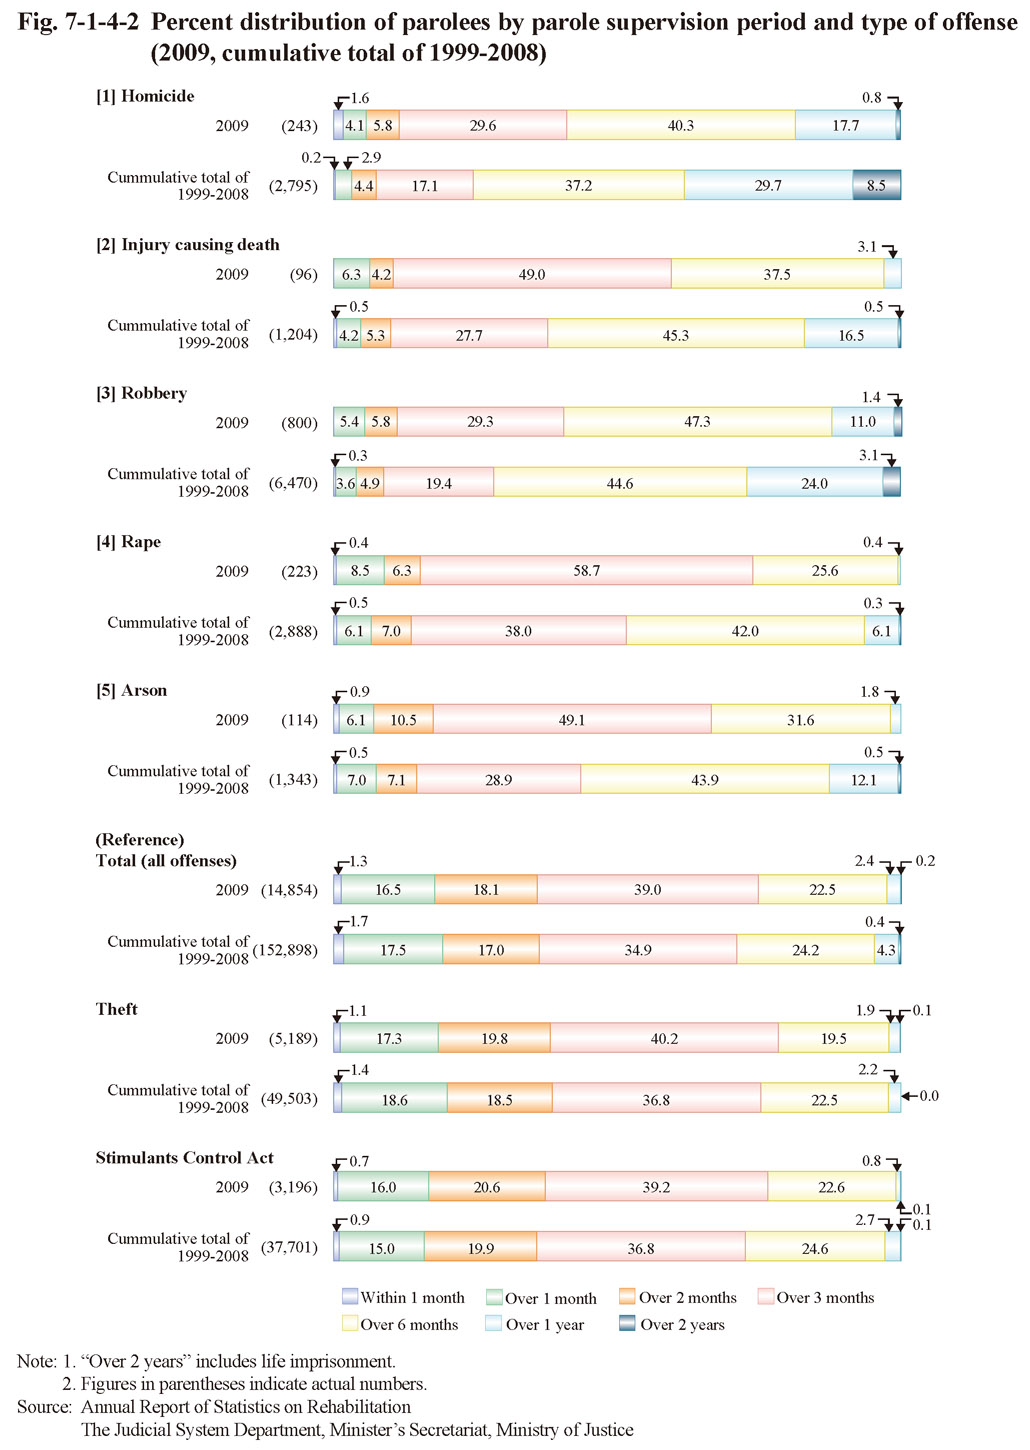
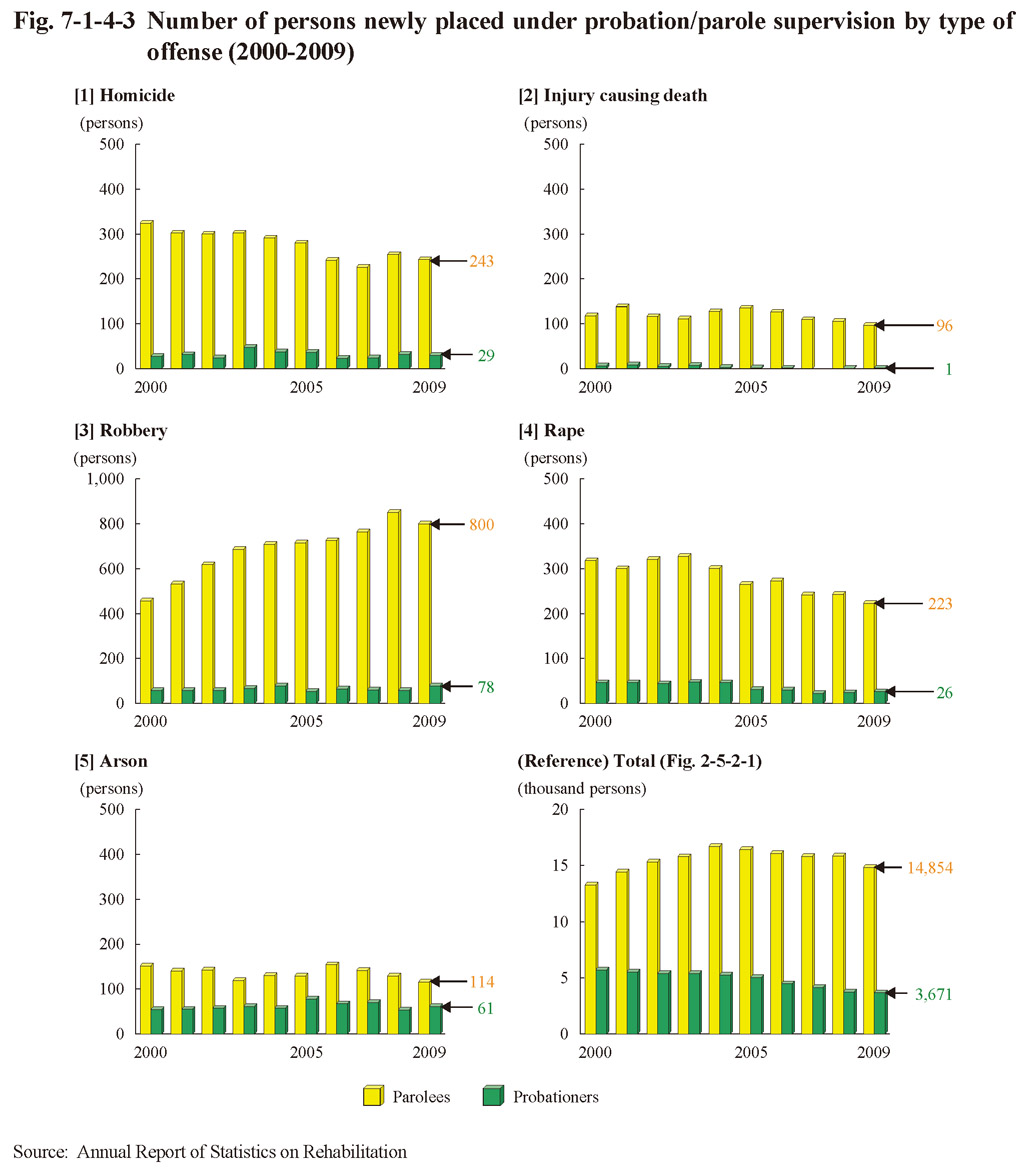
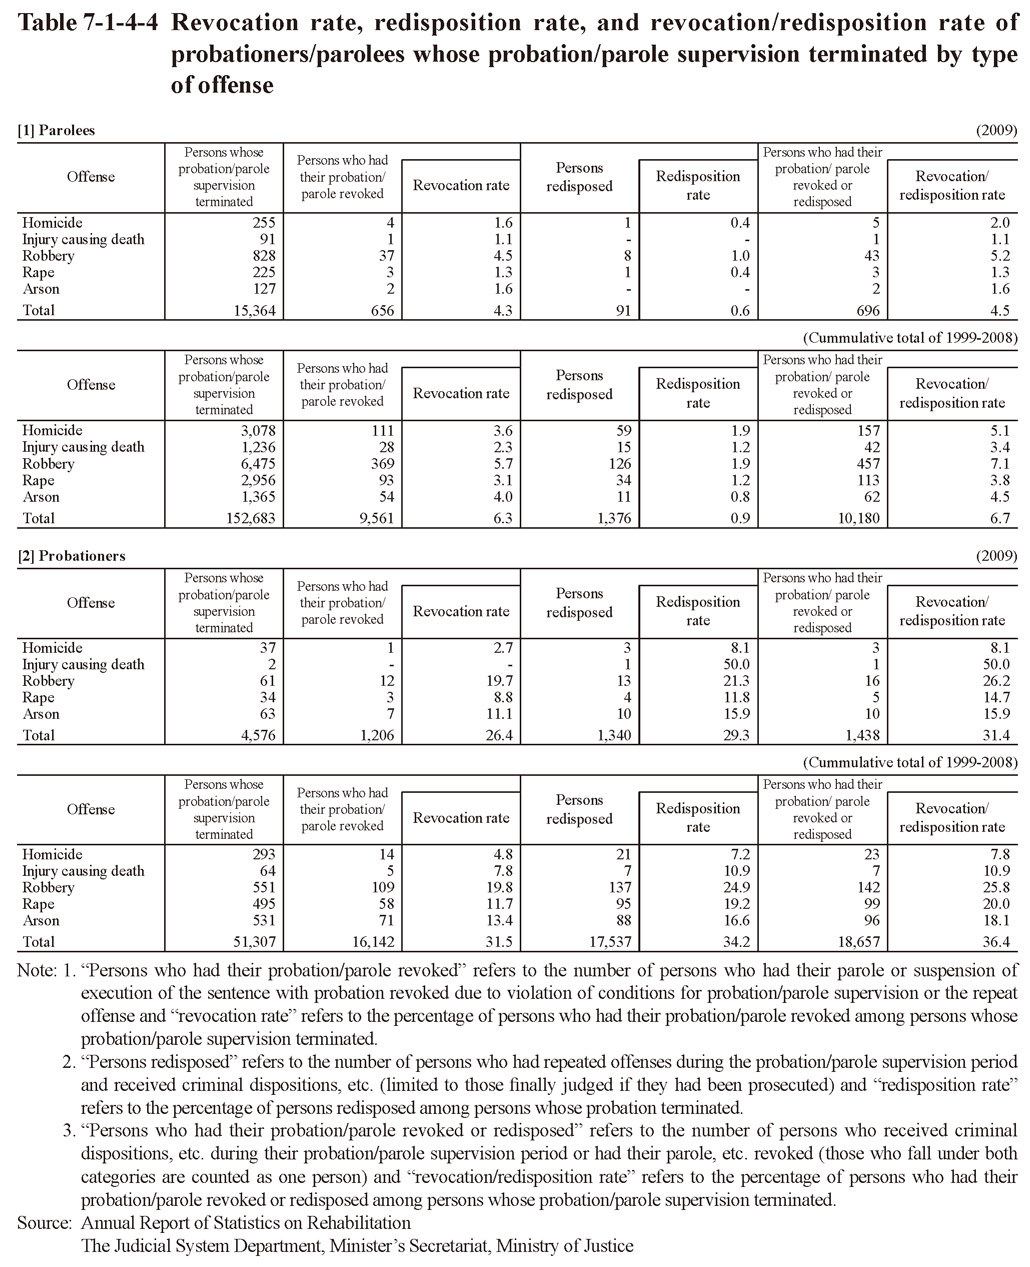
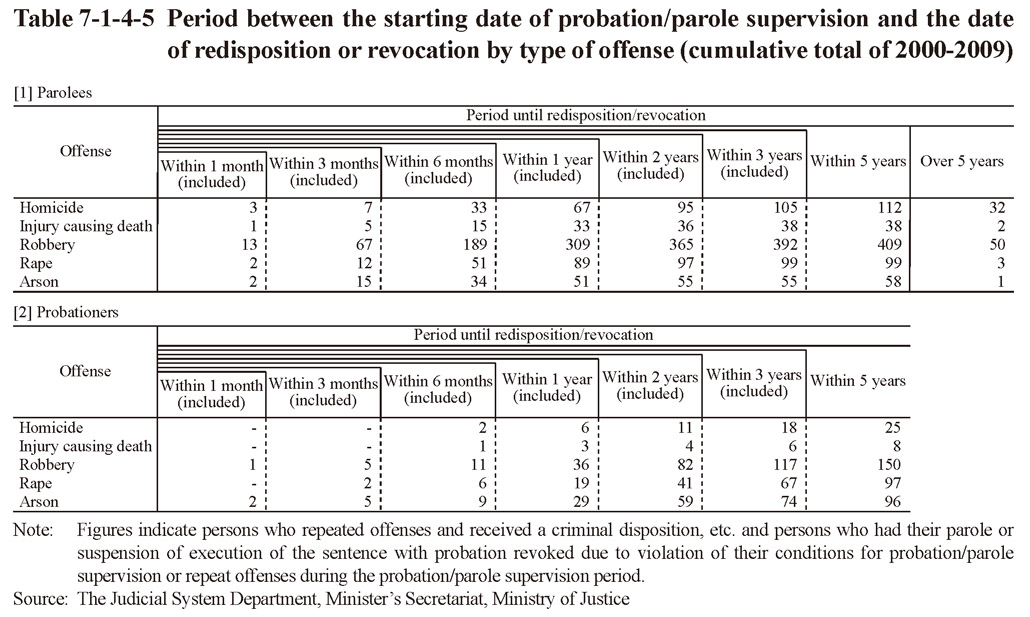
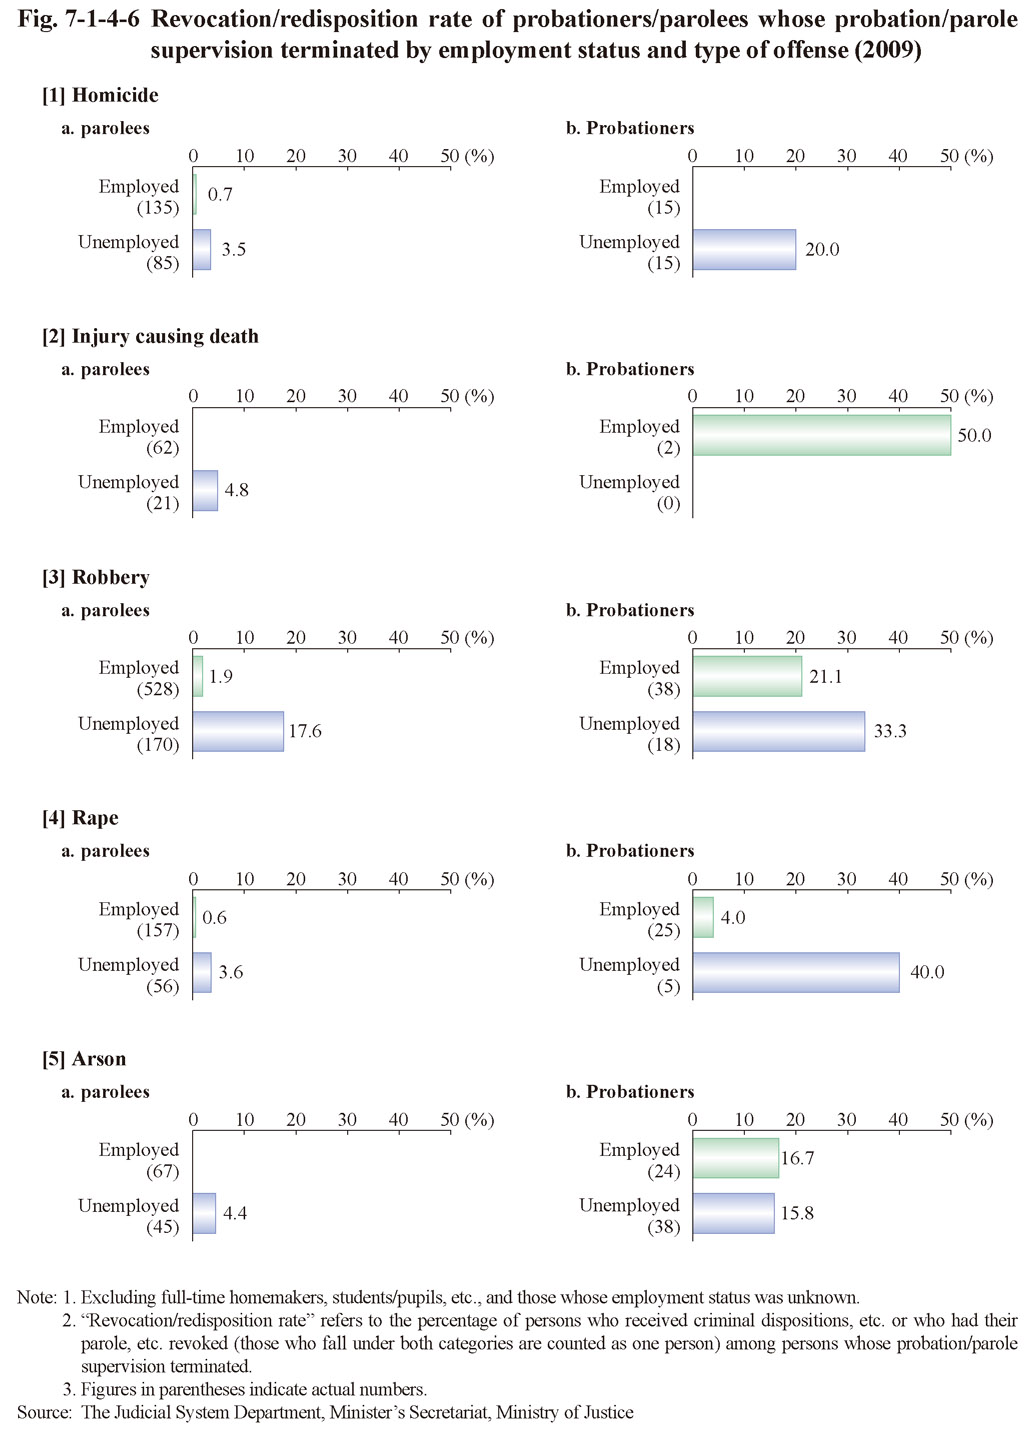
 Fig. 7-1-5-1 Number of juveniles cleared for homicide/robbery by age group (1954-2009)
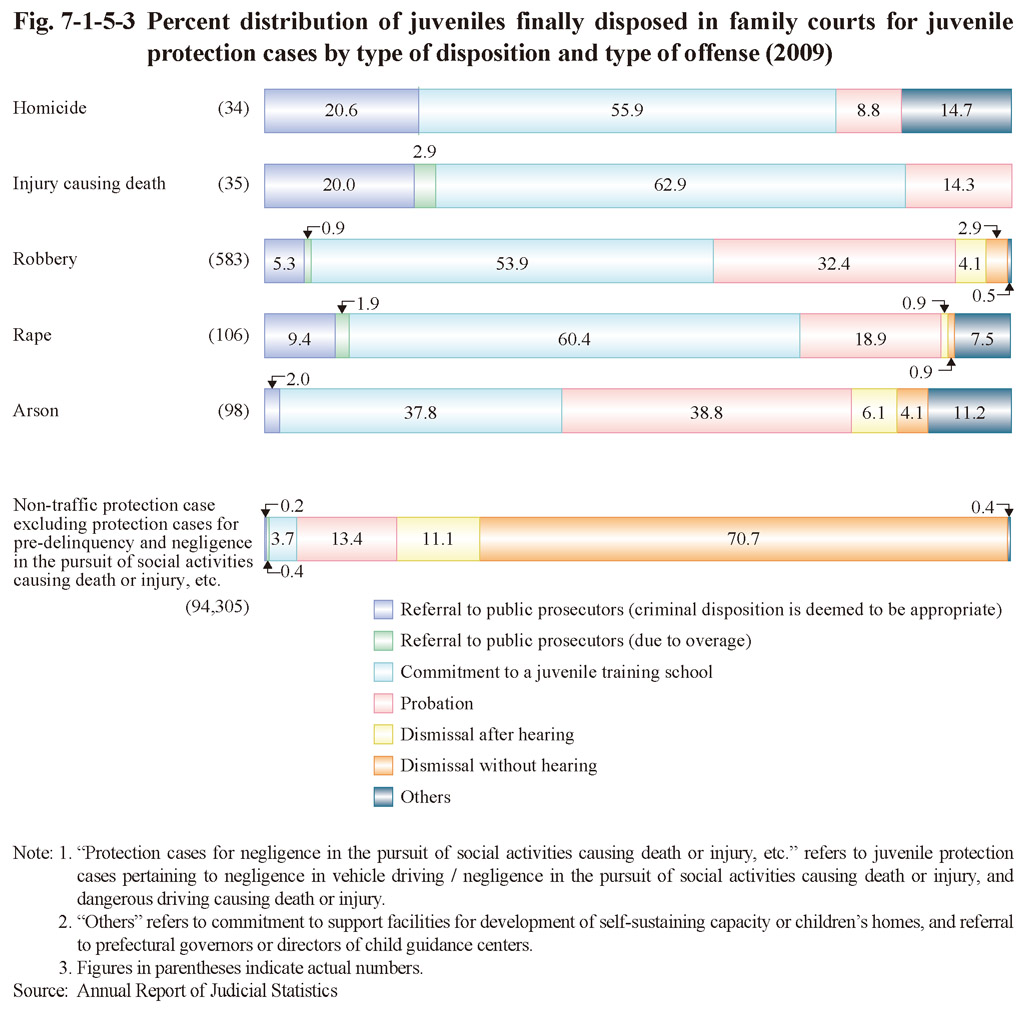

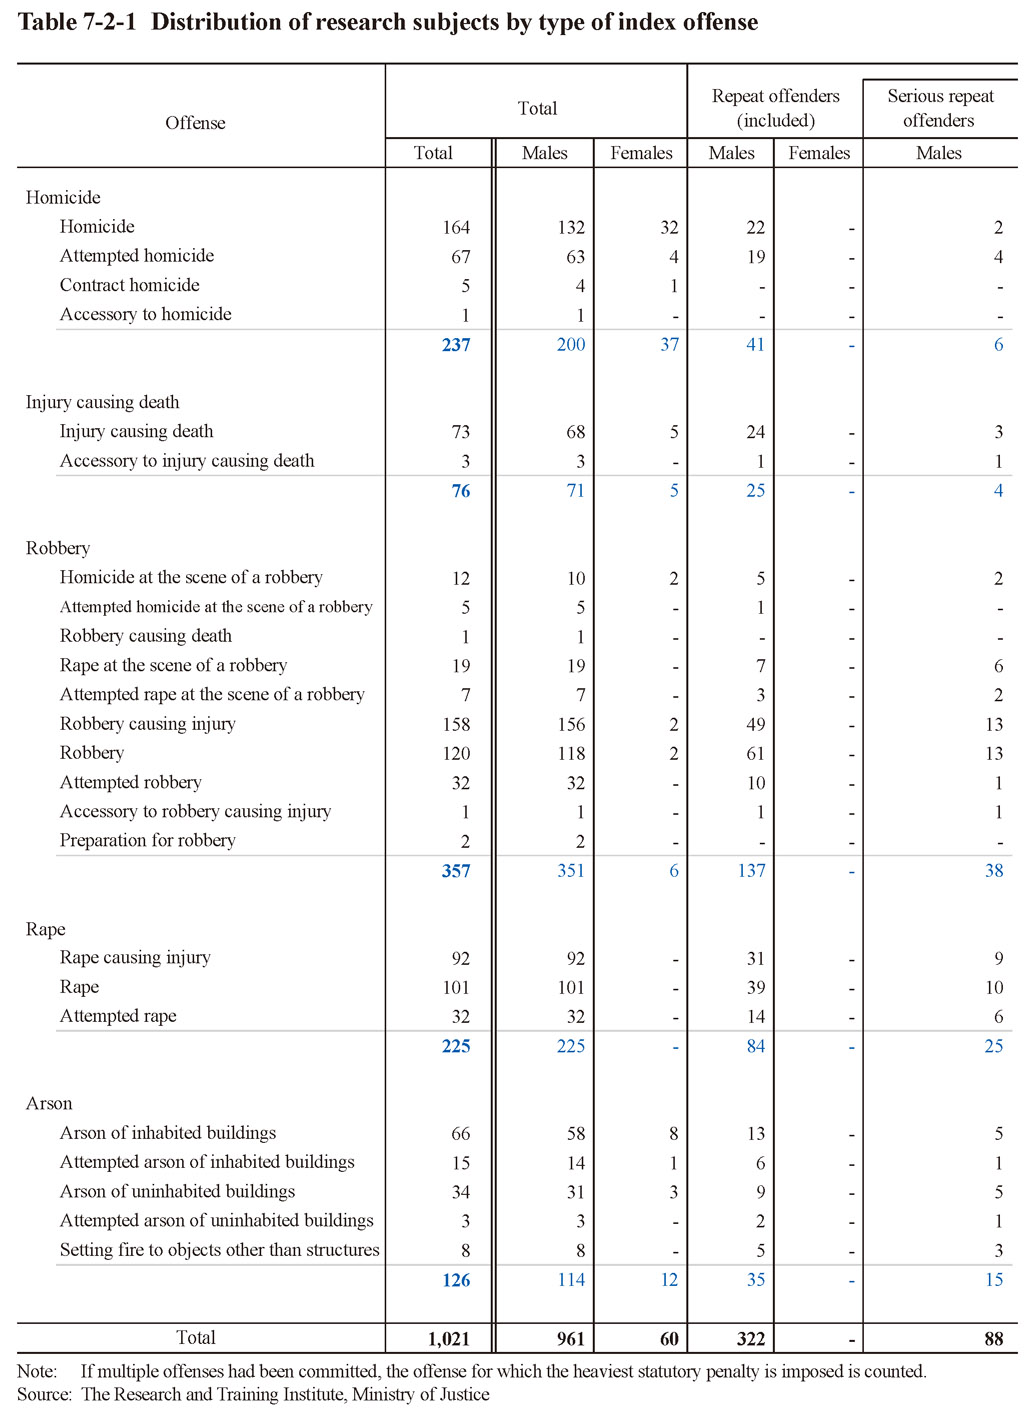 Table 7-2-1 Distribution of research subjects by type of index offense
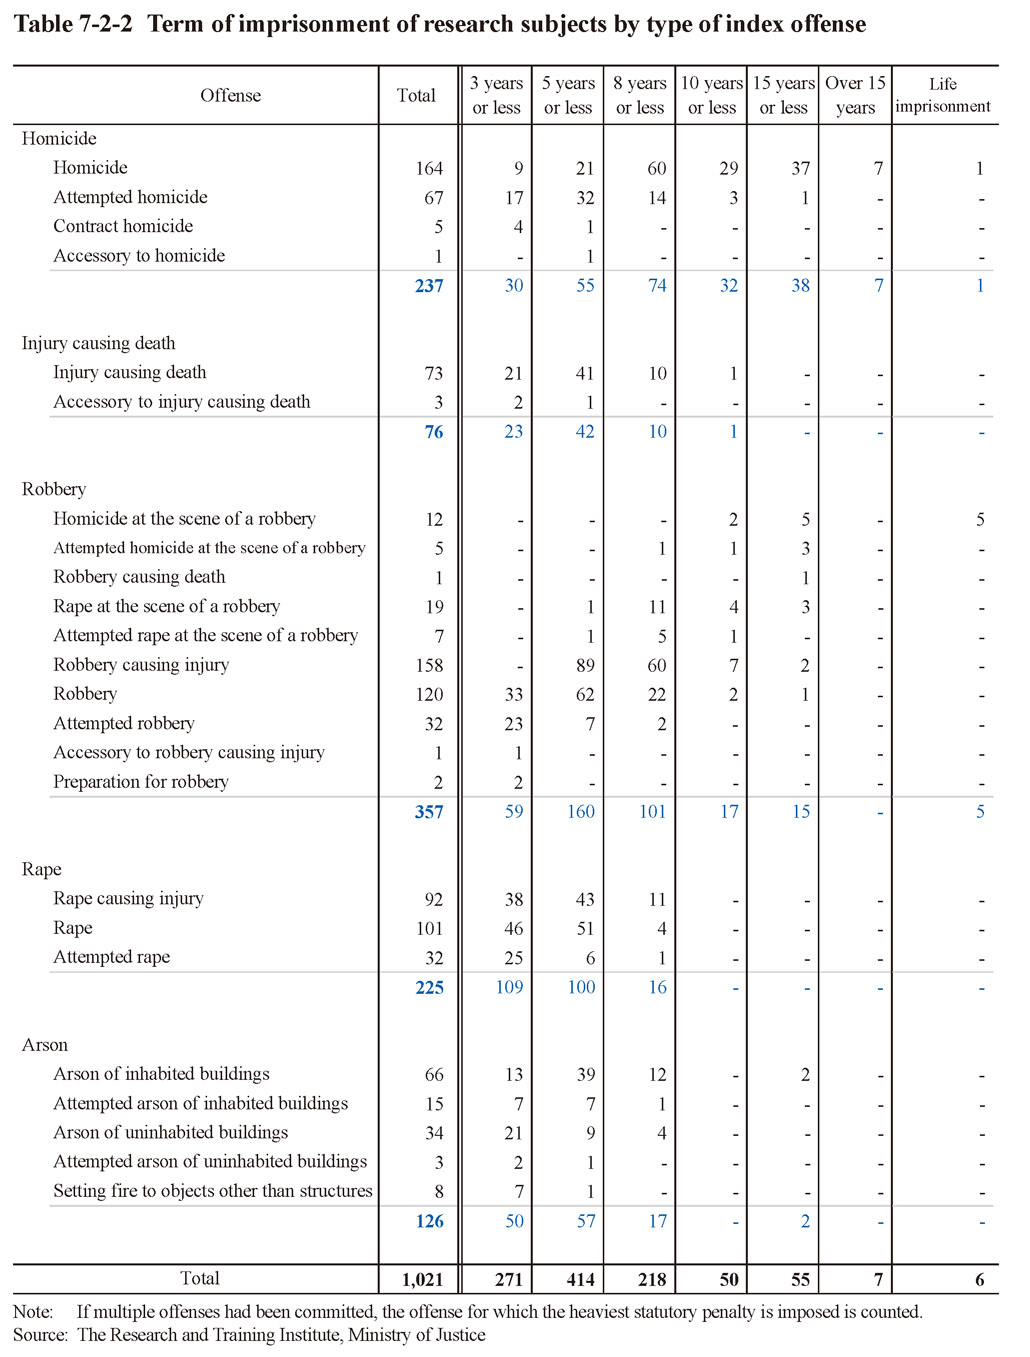 Table 7-2-2 Term of imprisonment of research subjects by type of index offense
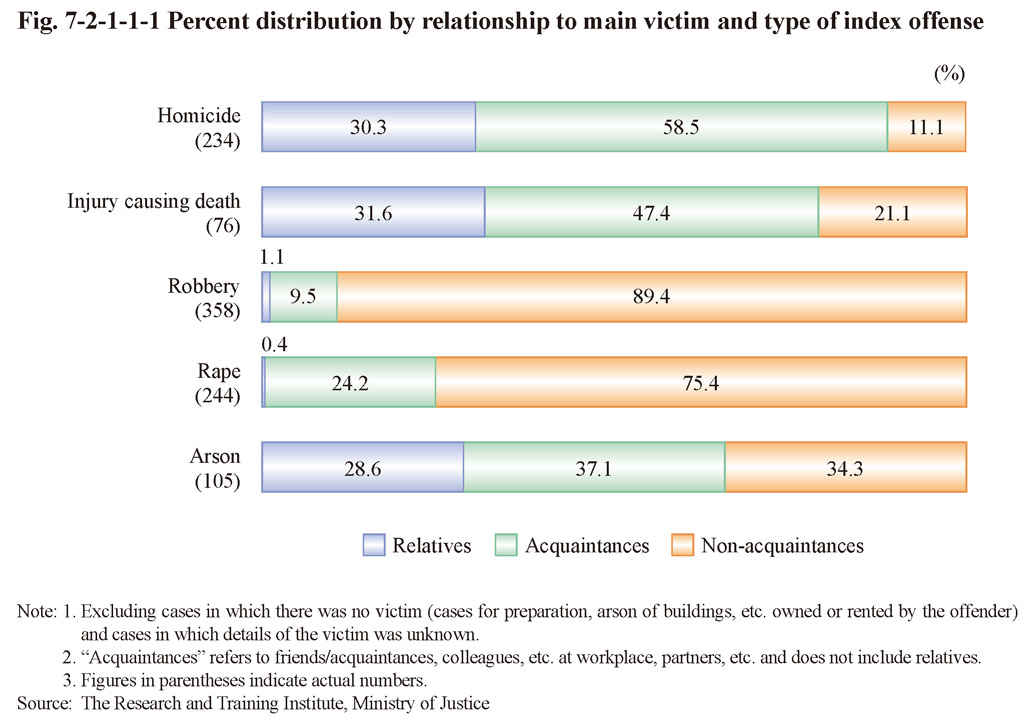 Fig. 7-2-1-1-1 Percent distribution by relationship to main victim and type of index offense
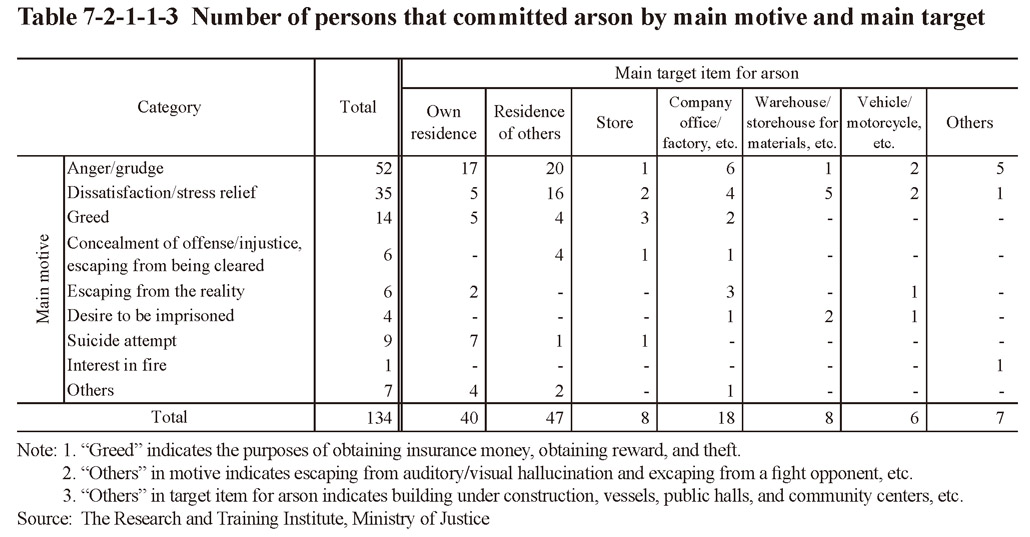 Table 7-2-1-1-3 Number of persons that committed arson by main motive and main target
 Fig. 7-2-1-1-4 Percent distribution with or without prior planning by type of index offense
 Fig. 7-2-1-1-5 Percent distribution of use or no use of a weapon by type of index offense
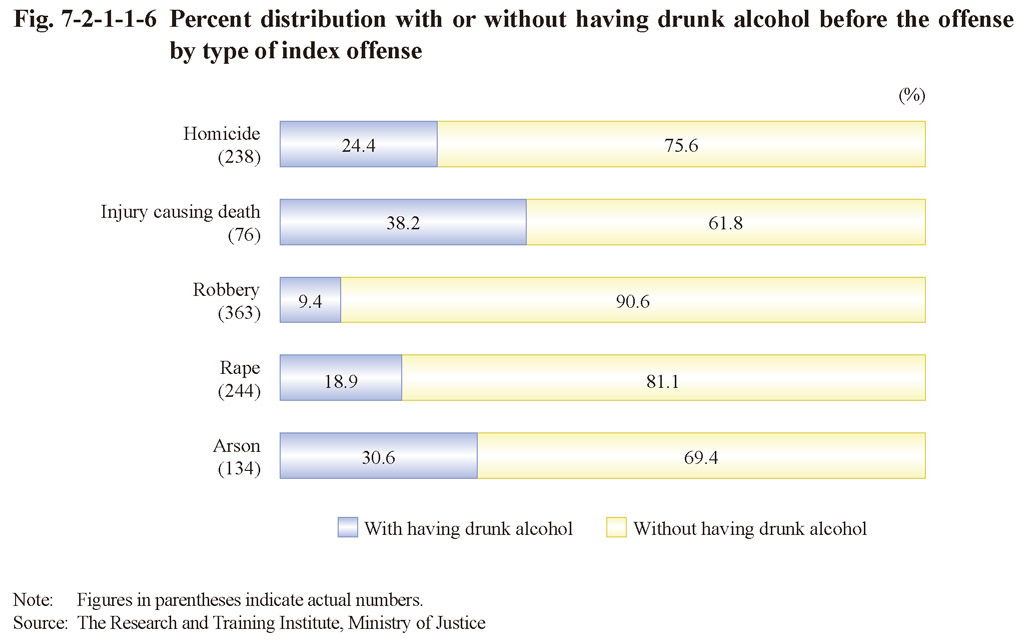
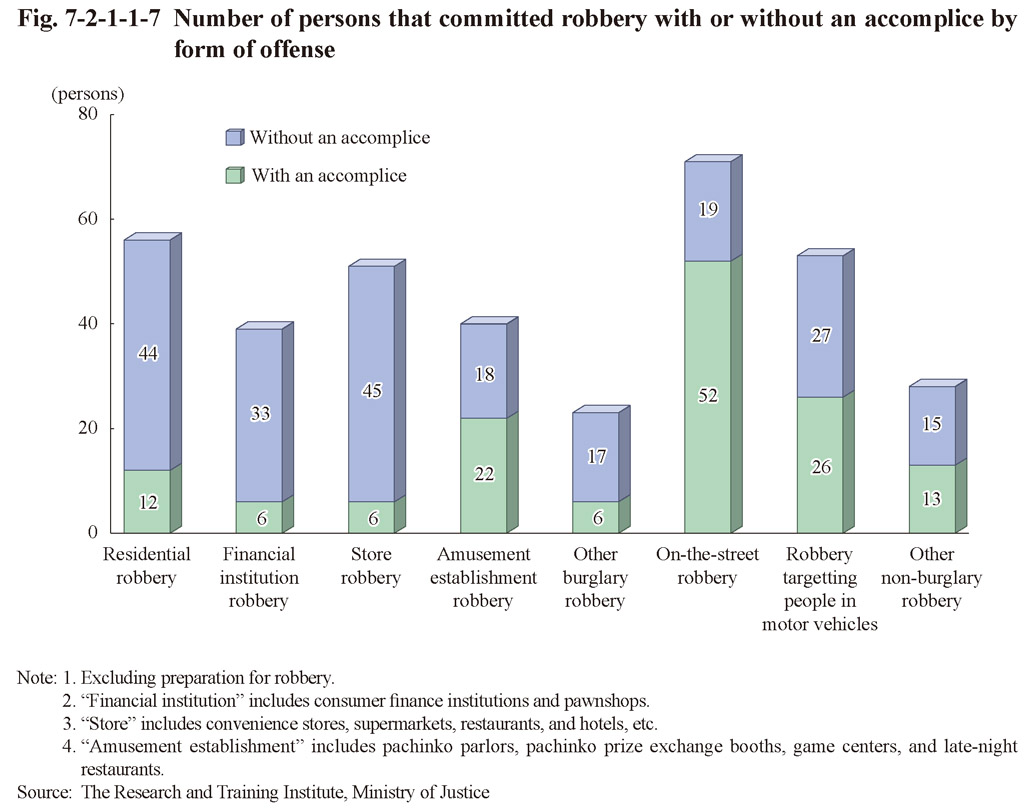
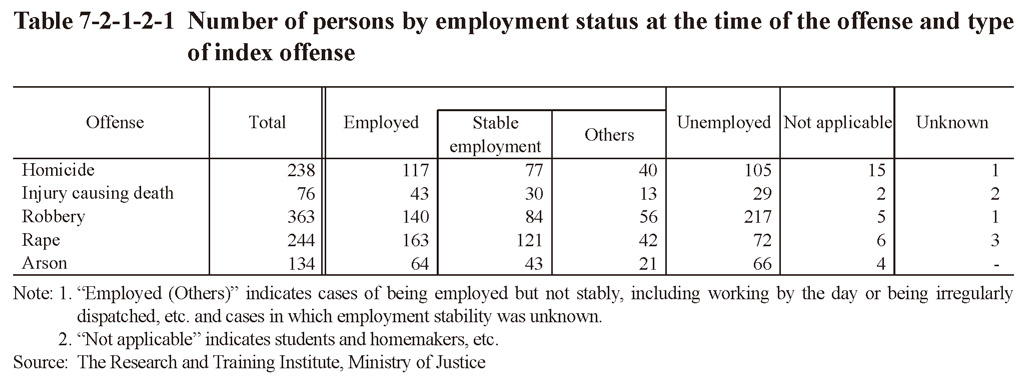
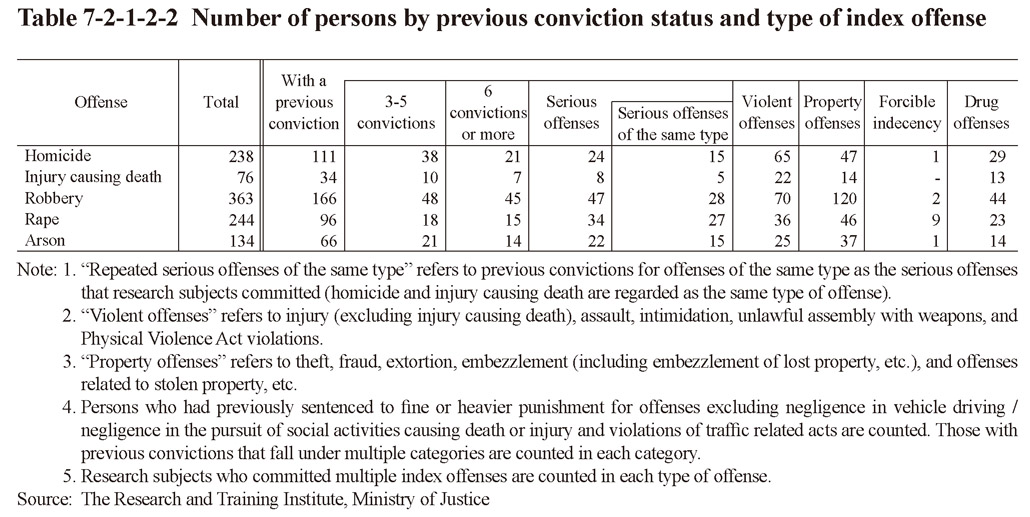 Table 7-2-1-2-2 Number of persons by previous conviction status and type of index offense
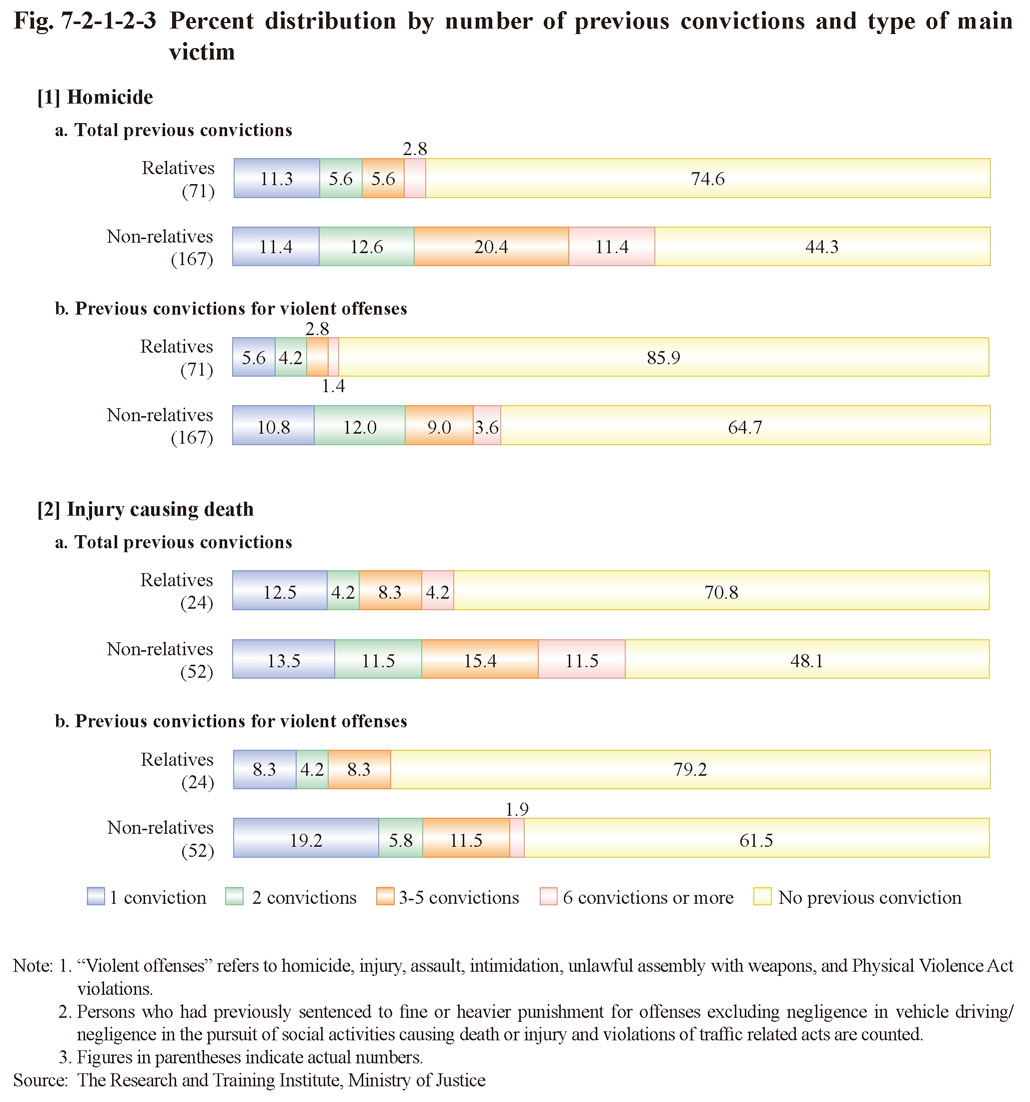 Fig. 7-2-1-2-3 Percent distribution by number of previous convictions and type of main victim
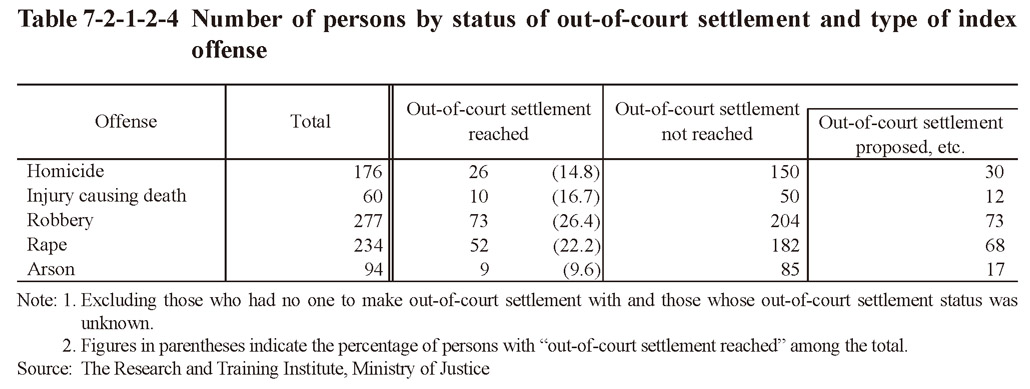 Table 7-2-1-2-4 Number of persons by status of out-of-court settlement and type of index offense
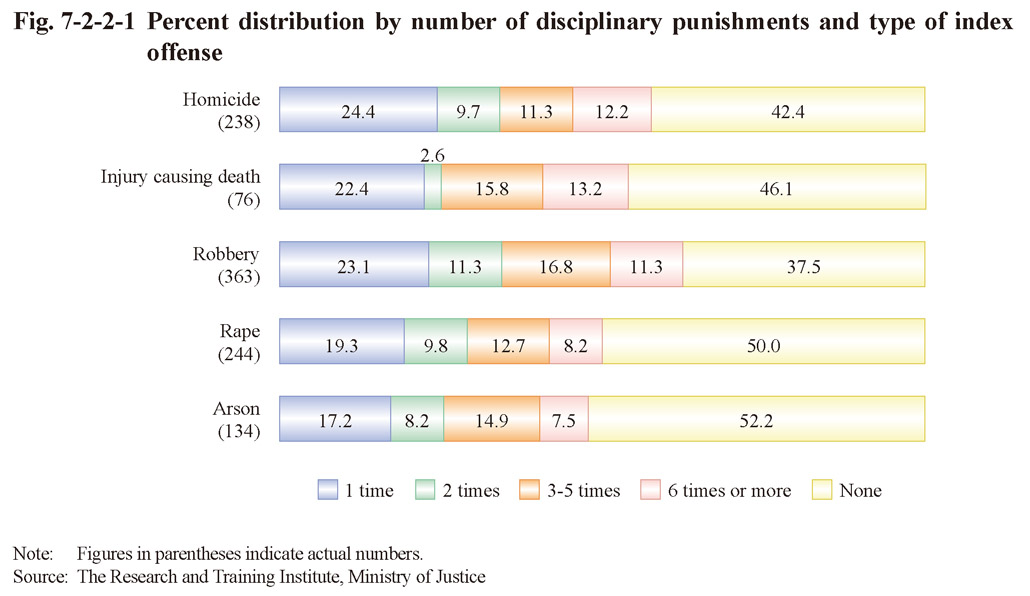 Fig. 7-2-2-1 Percent distribution by number of disciplinary punishments and type of index offense
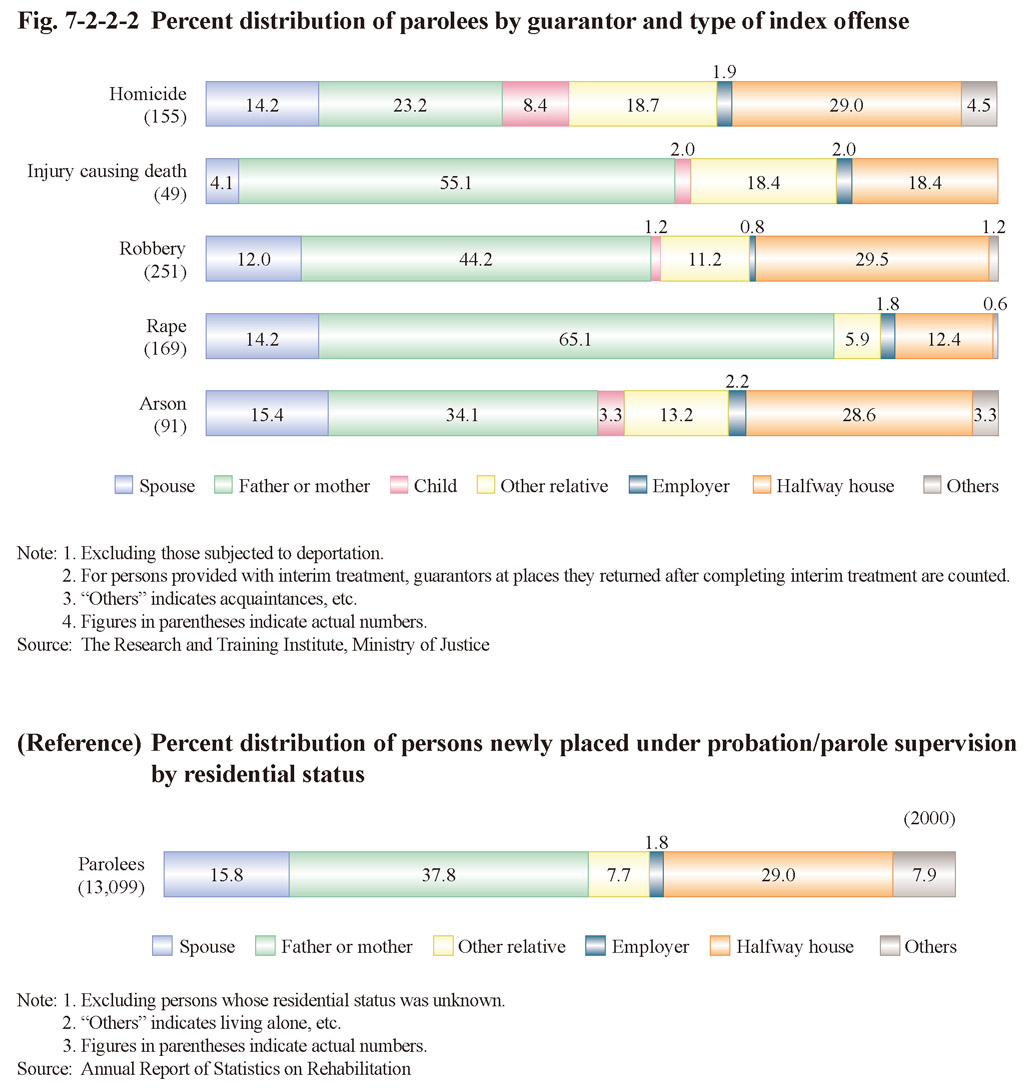 Fig. 7-2-2-2 Percent distribution of parolees by guarantor and type of index offense
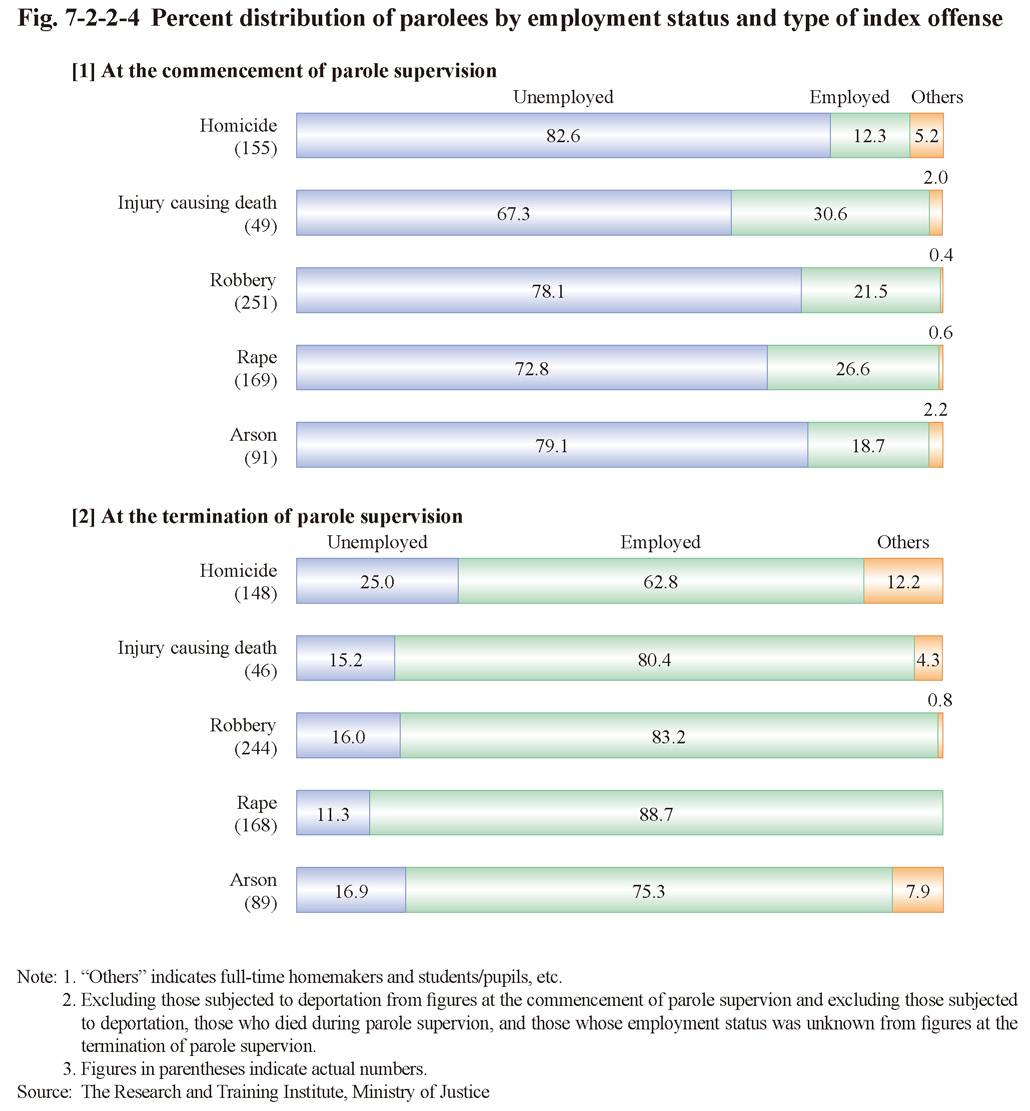 Fig. 7-2-2-4 Percent distribution of parolees by employment status and type of index offense
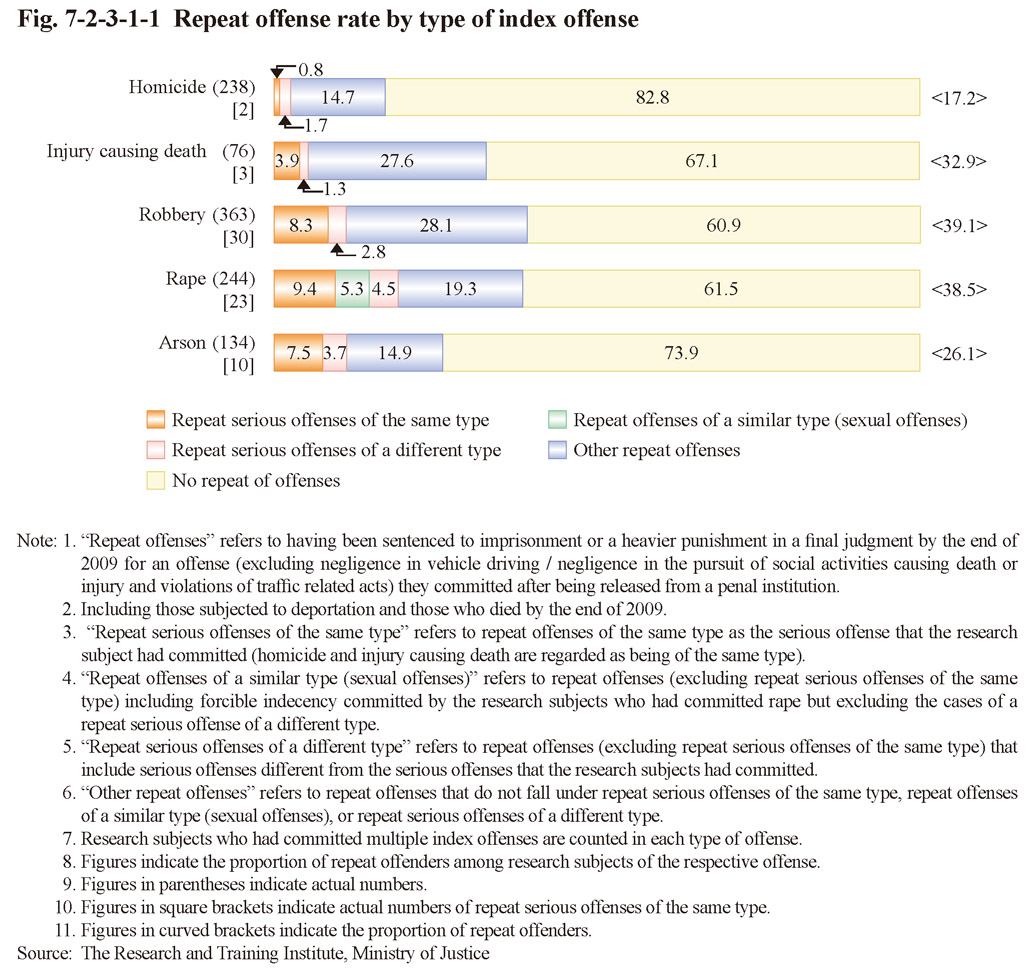 Fig. 7-2-3-1-1 Repeat offense rate by type of index offense
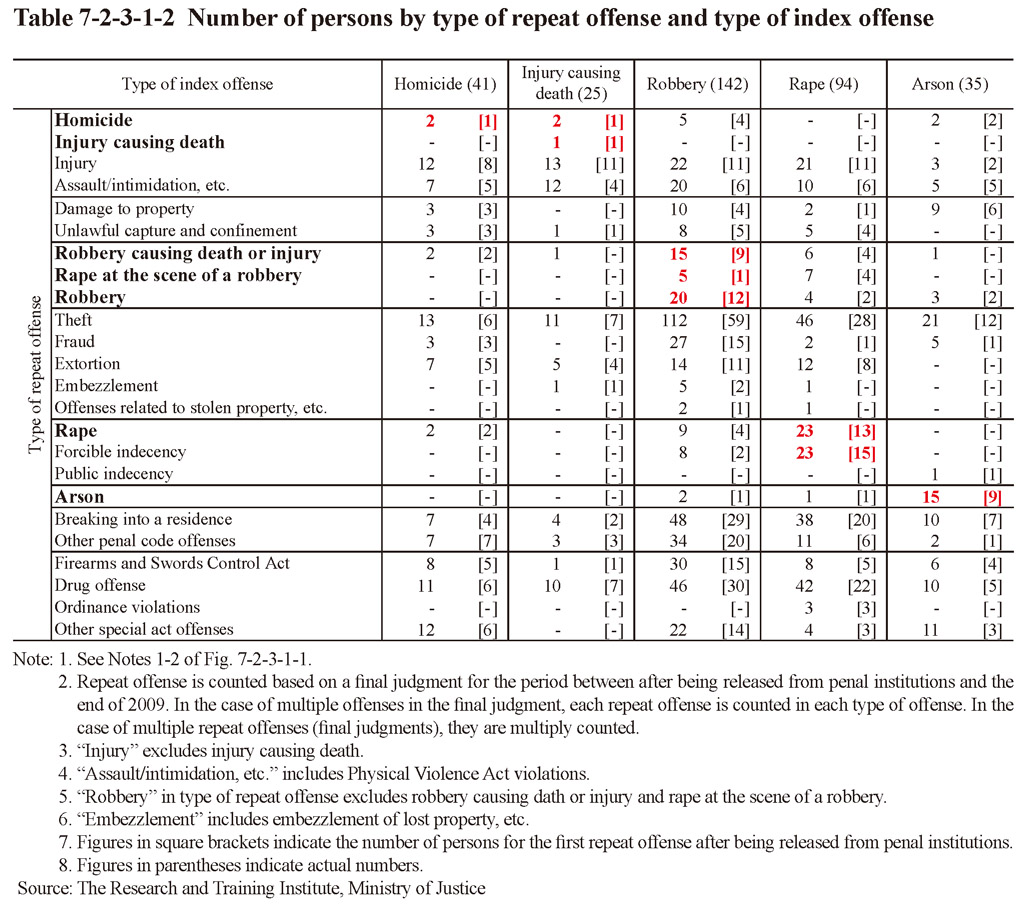 Table 7-2-3-1-2 Number of persons by type of repeat offense and type of index offense
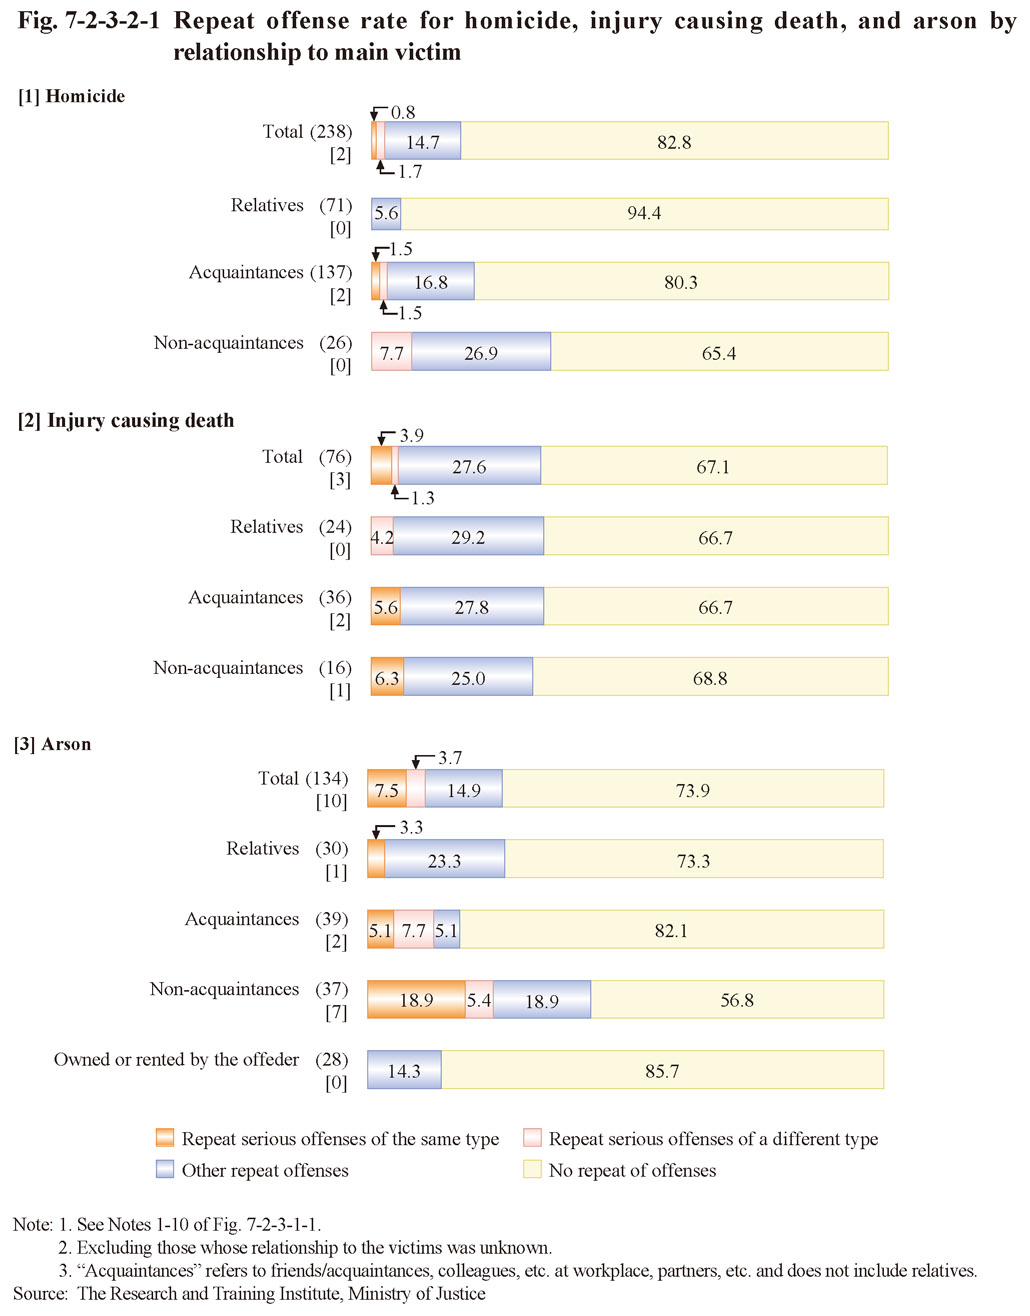
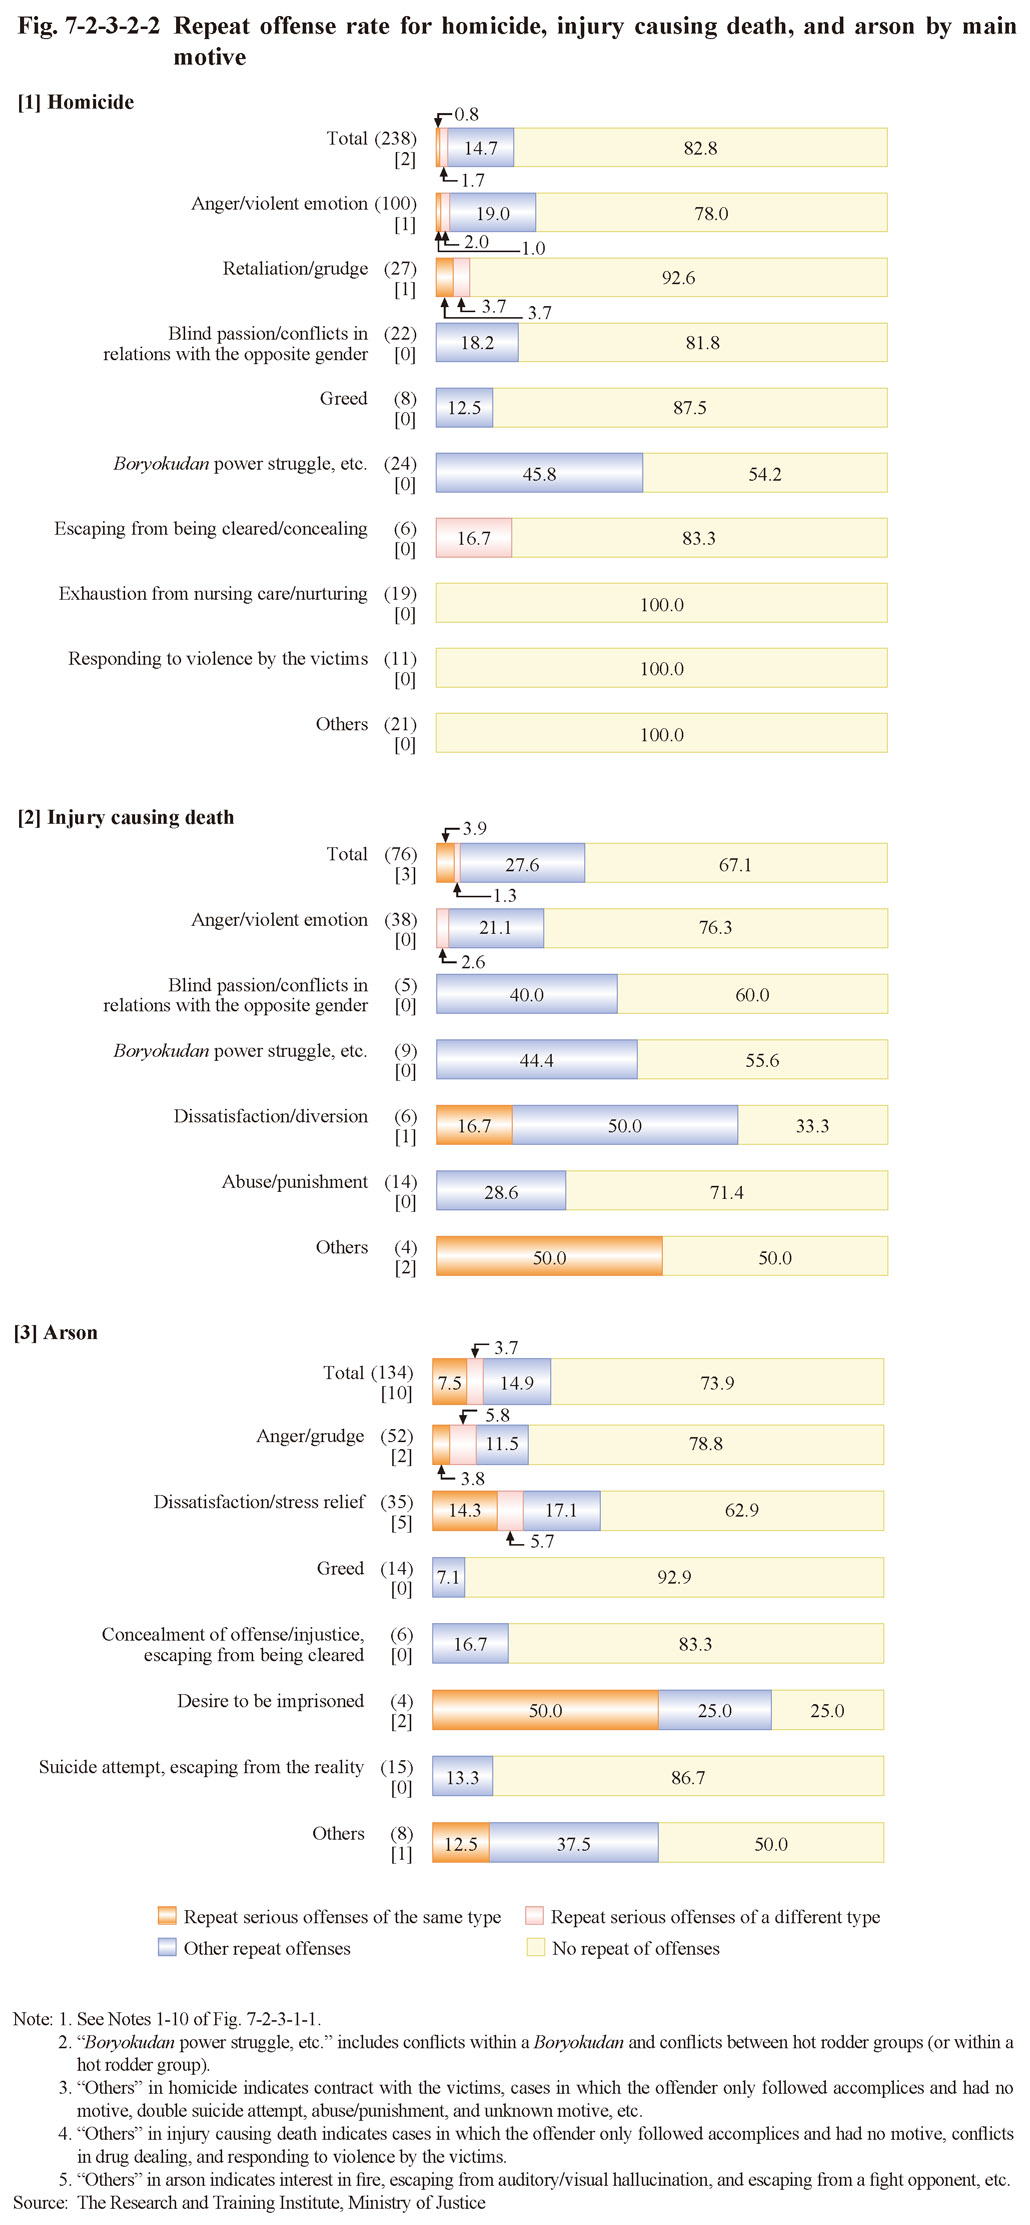 Fig. 7-2-3-2-2 Repeat offense rate for homicide, injury causing death, and arson by main motive
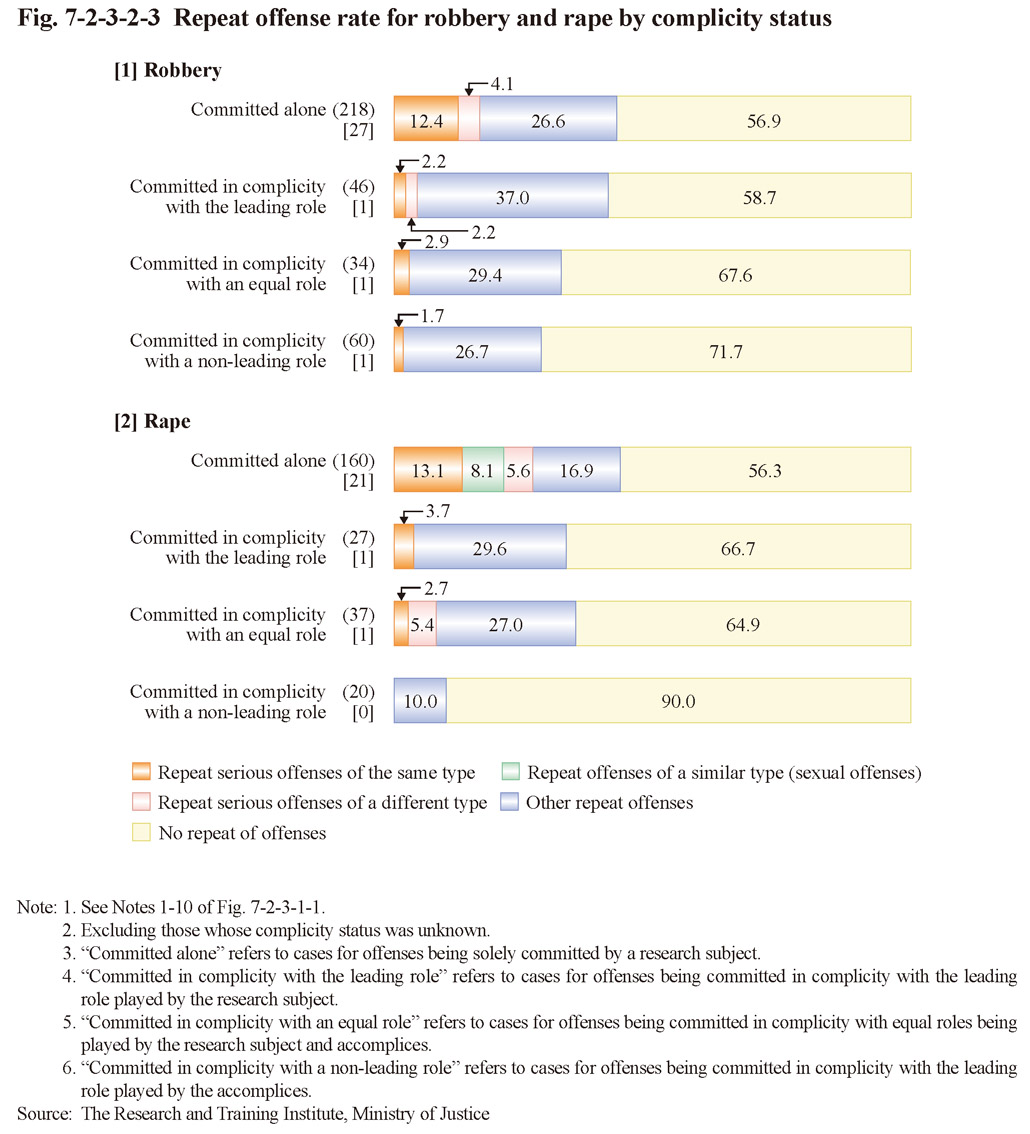 Fig. 7-2-3-2-3 Repeat offense rate for robbery and rape by complicity status
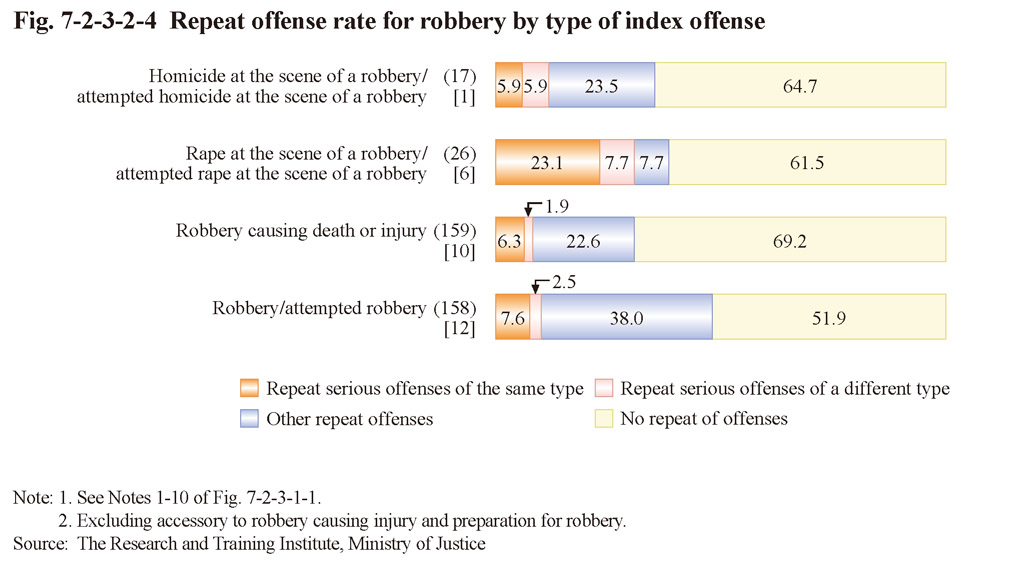 Fig. 7-2-3-2-4 Repeat offense rate for robbery by type of index offense
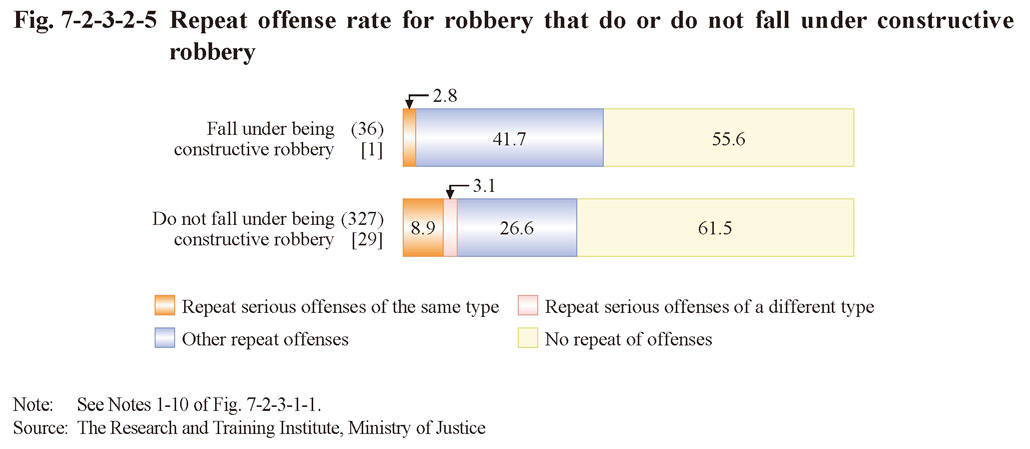 Fig. 7-2-3-2-5 Repeat offense rate for robbery that do or do not fall under constructive robbery
 Fig. 7-2-3-2-6 Repeat offense rate by number of previous convictions and type of index offense
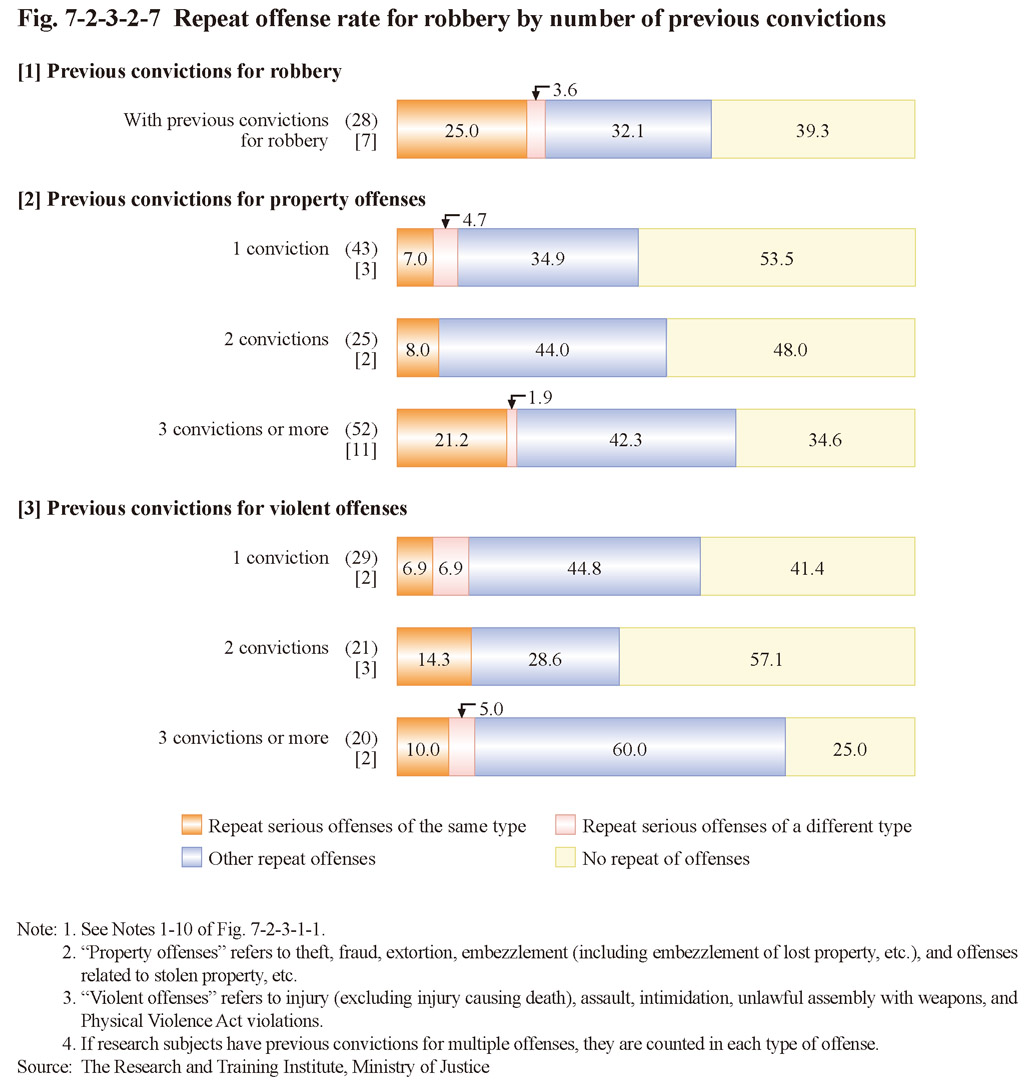 Fig. 7-2-3-2-7 Repeat offense rate for robbery by number of previous convictions
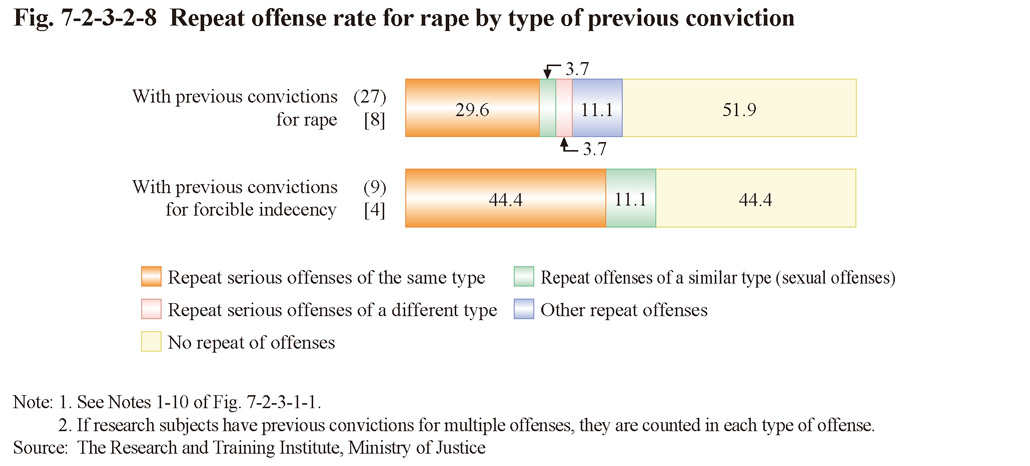 Fig. 7-2-3-2-8 Repeat offense rate for rape by type of previous conviction
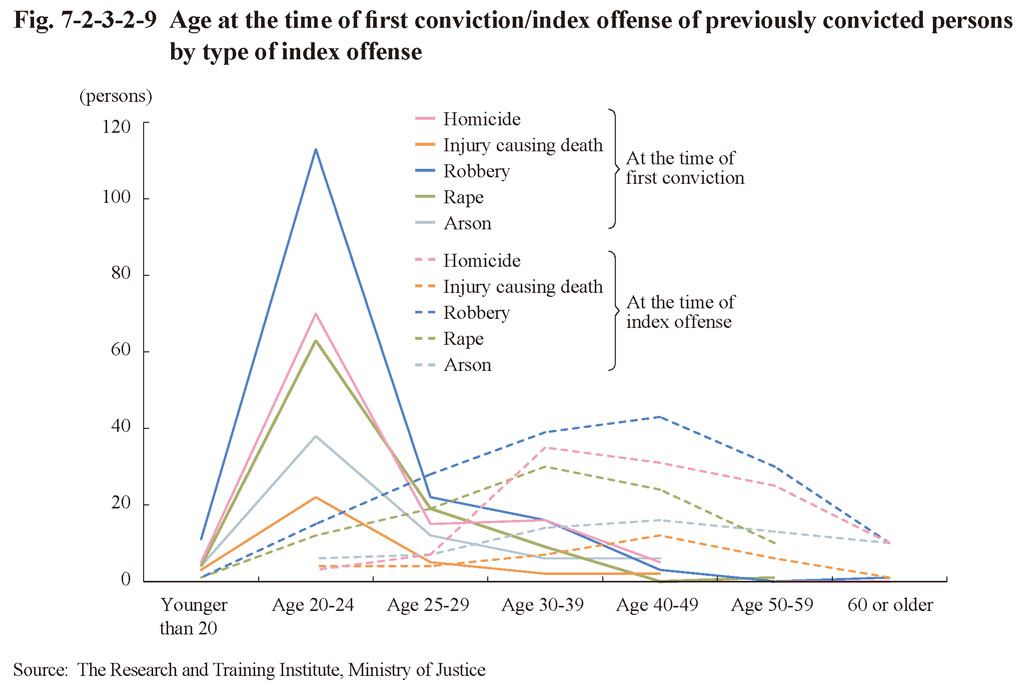
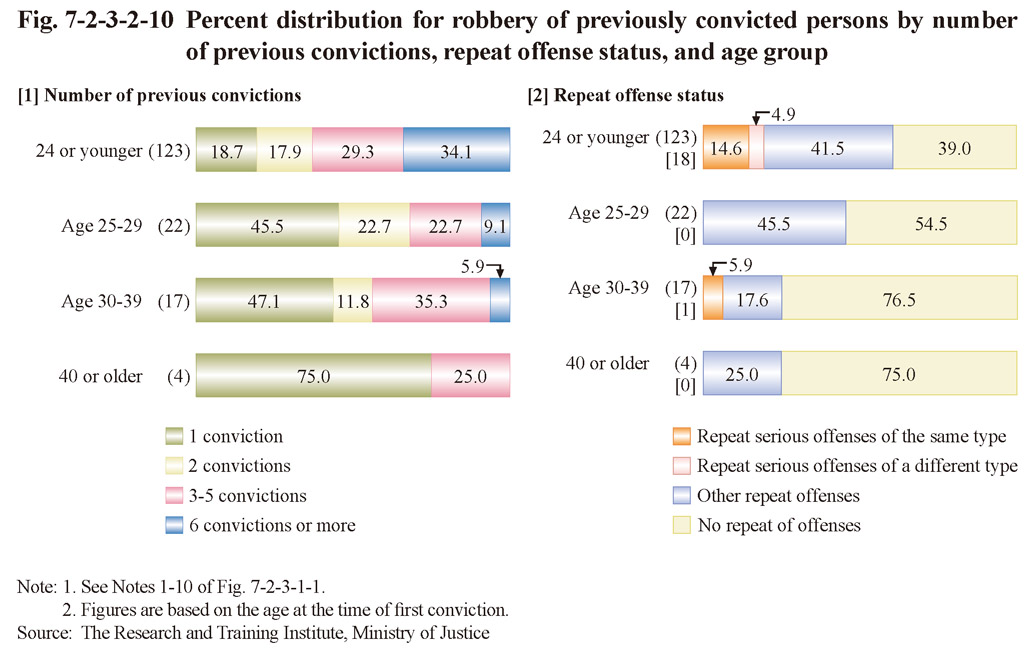
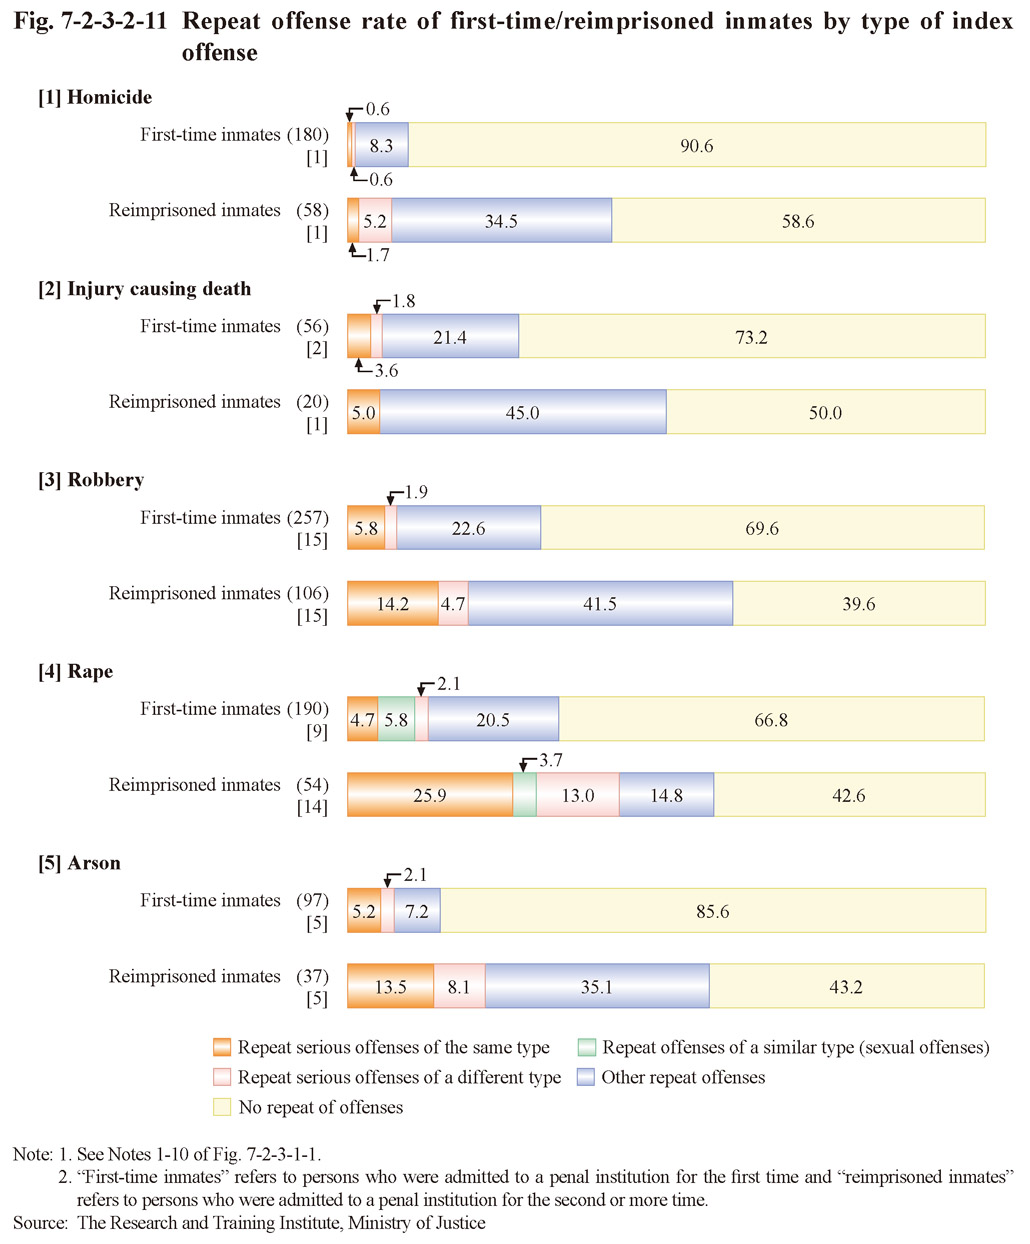 Fig. 7-2-3-2-11 Repeat offense rate of first-time/reimprisoned inmates by type of index offense
 Fig. 7-2-3-2-12 Repeat offense rate by history of protective measures and type of index offense
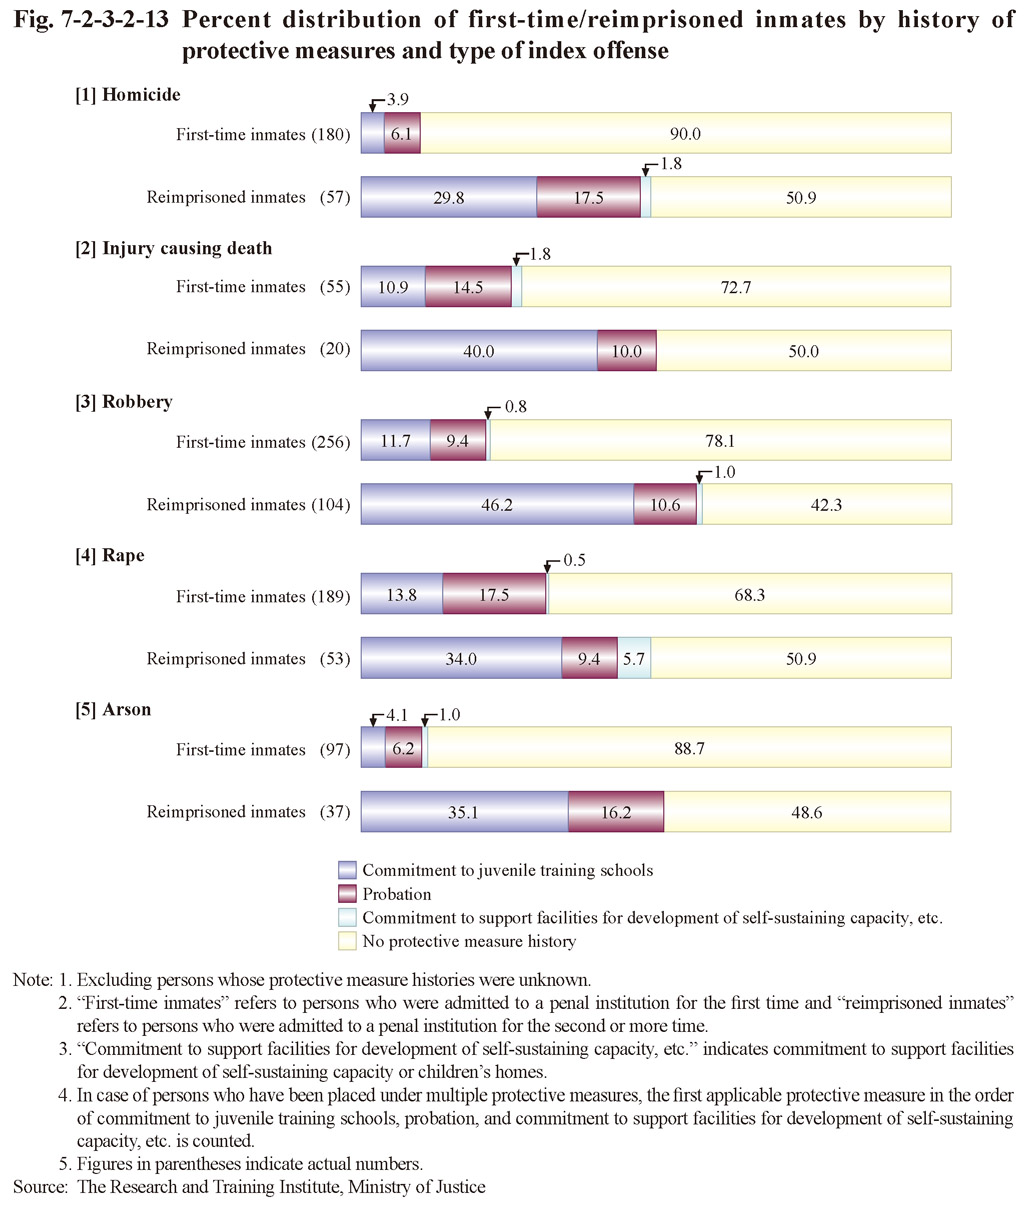
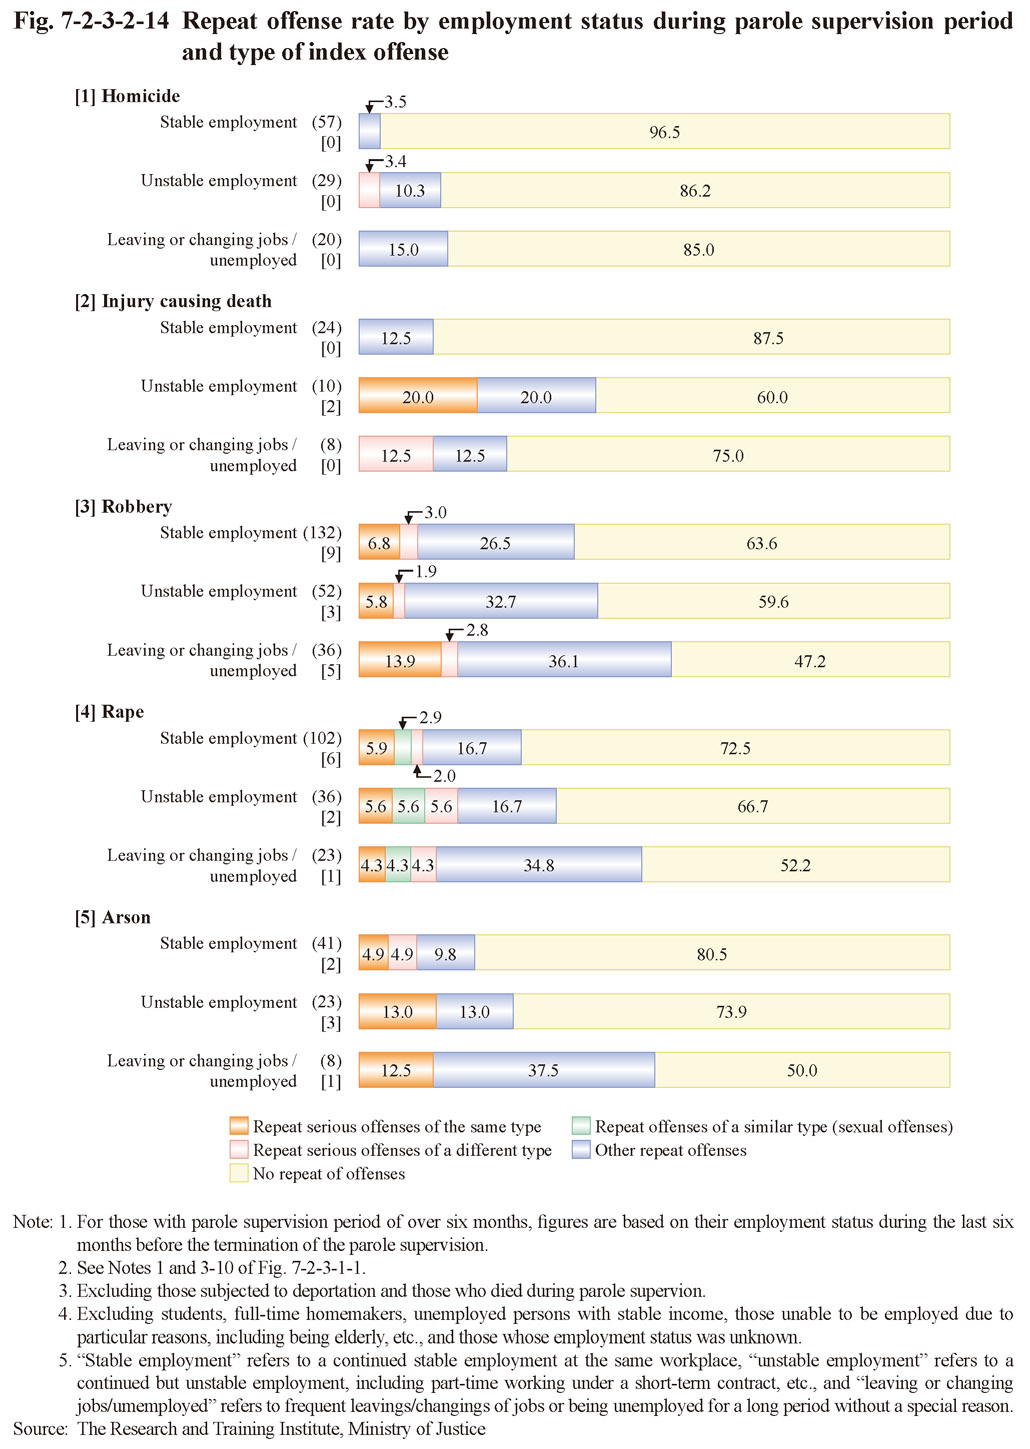
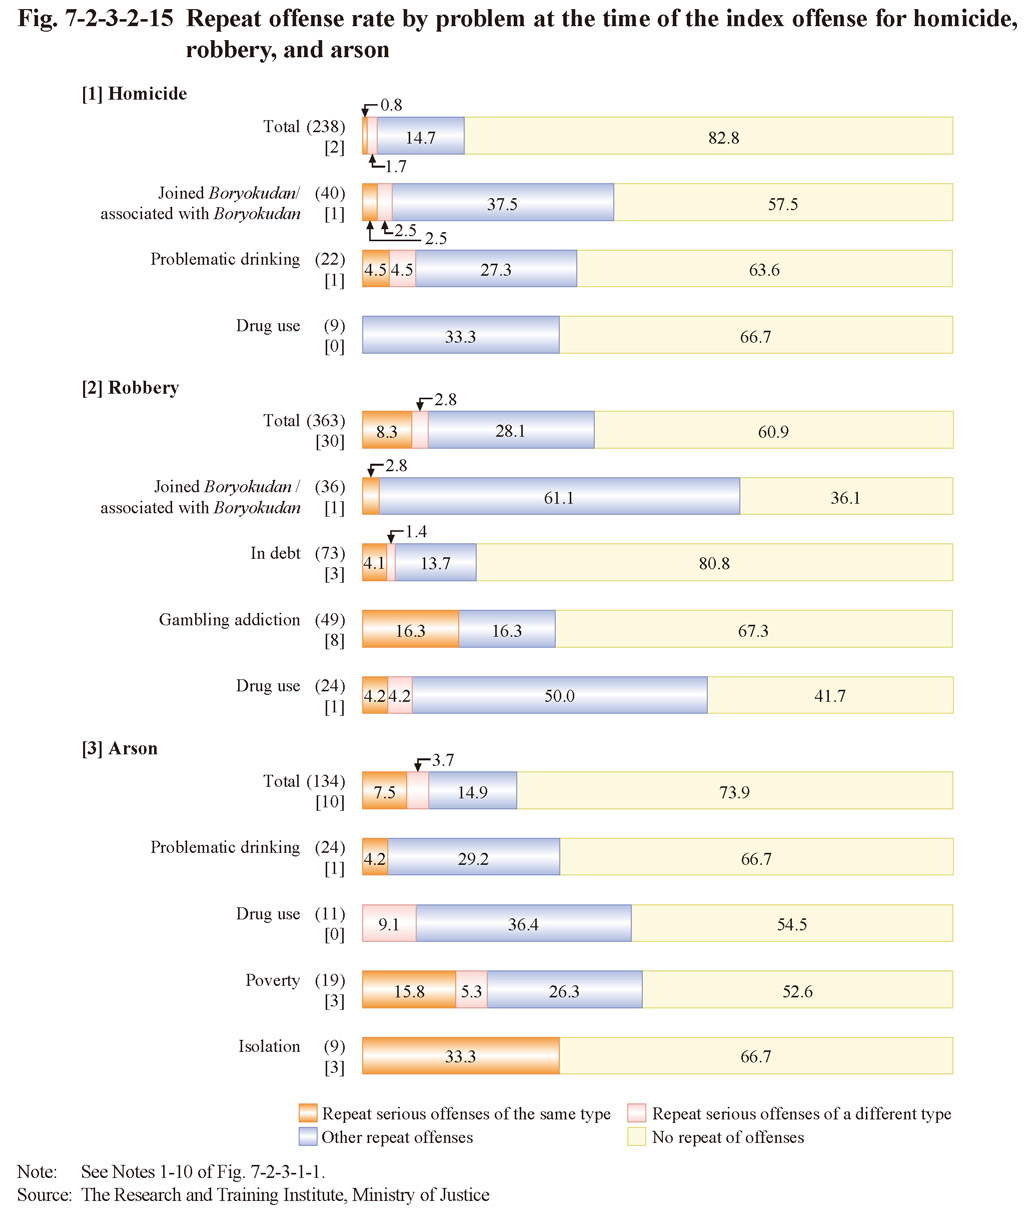

 Fig. 7-2-3-2-17 Repeat offense rate by reason for release and type of index offense
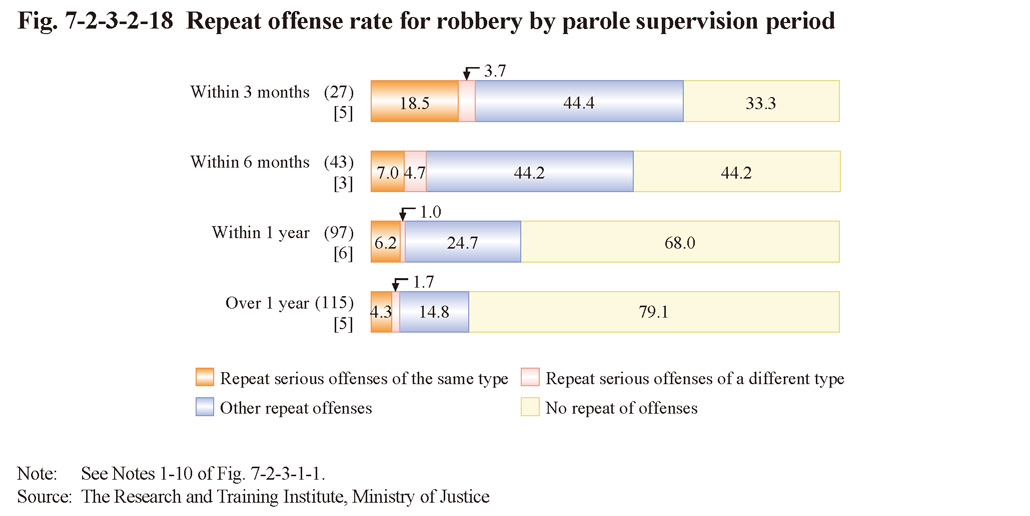 Fig. 7-2-3-2-18 Repeat offense rate for robbery by parole supervision period
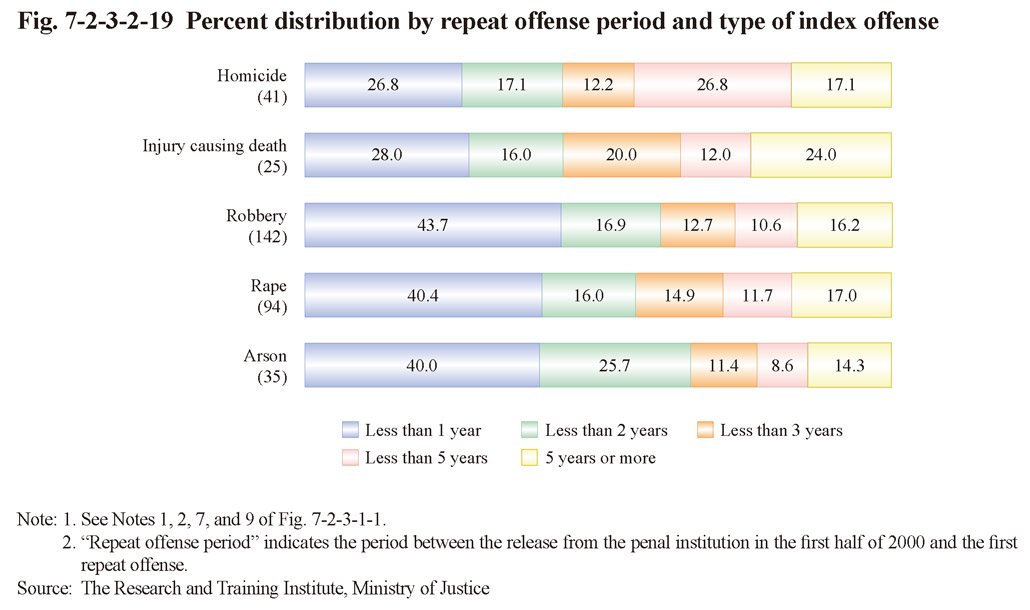 Fig. 7-2-3-2-19 Percent distribution by repeat offense period and type of index offense
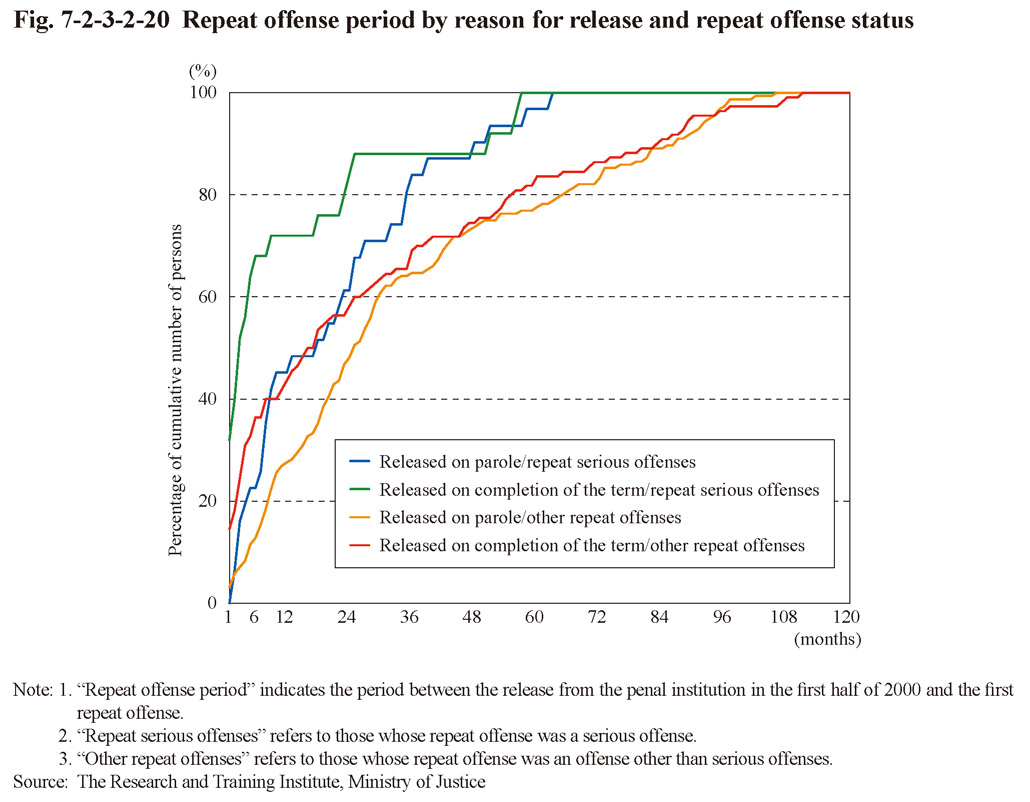 Fig. 7-2-3-2-20 Repeat offense period by reason for release and repeat offense status
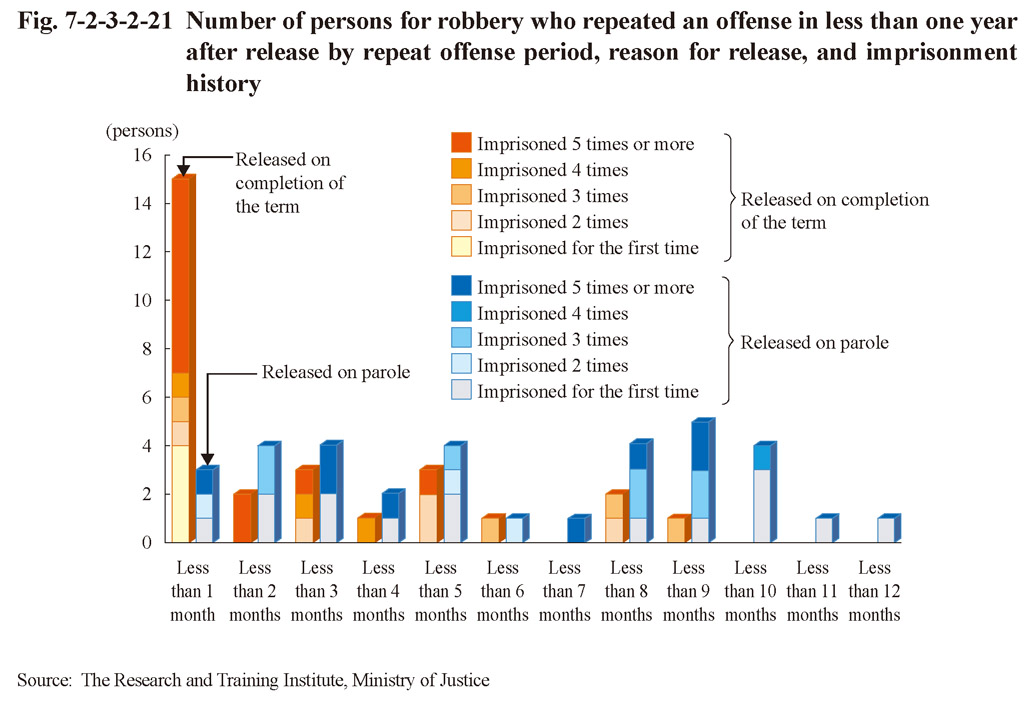
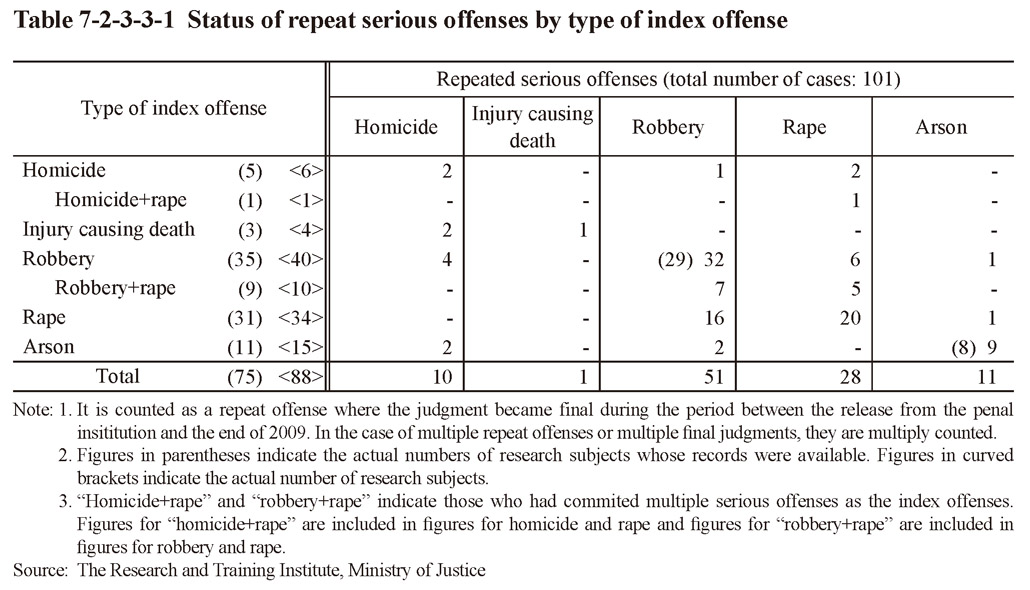 Table 7-2-3-3-1 Status of repeat serious offenses by type of index offense
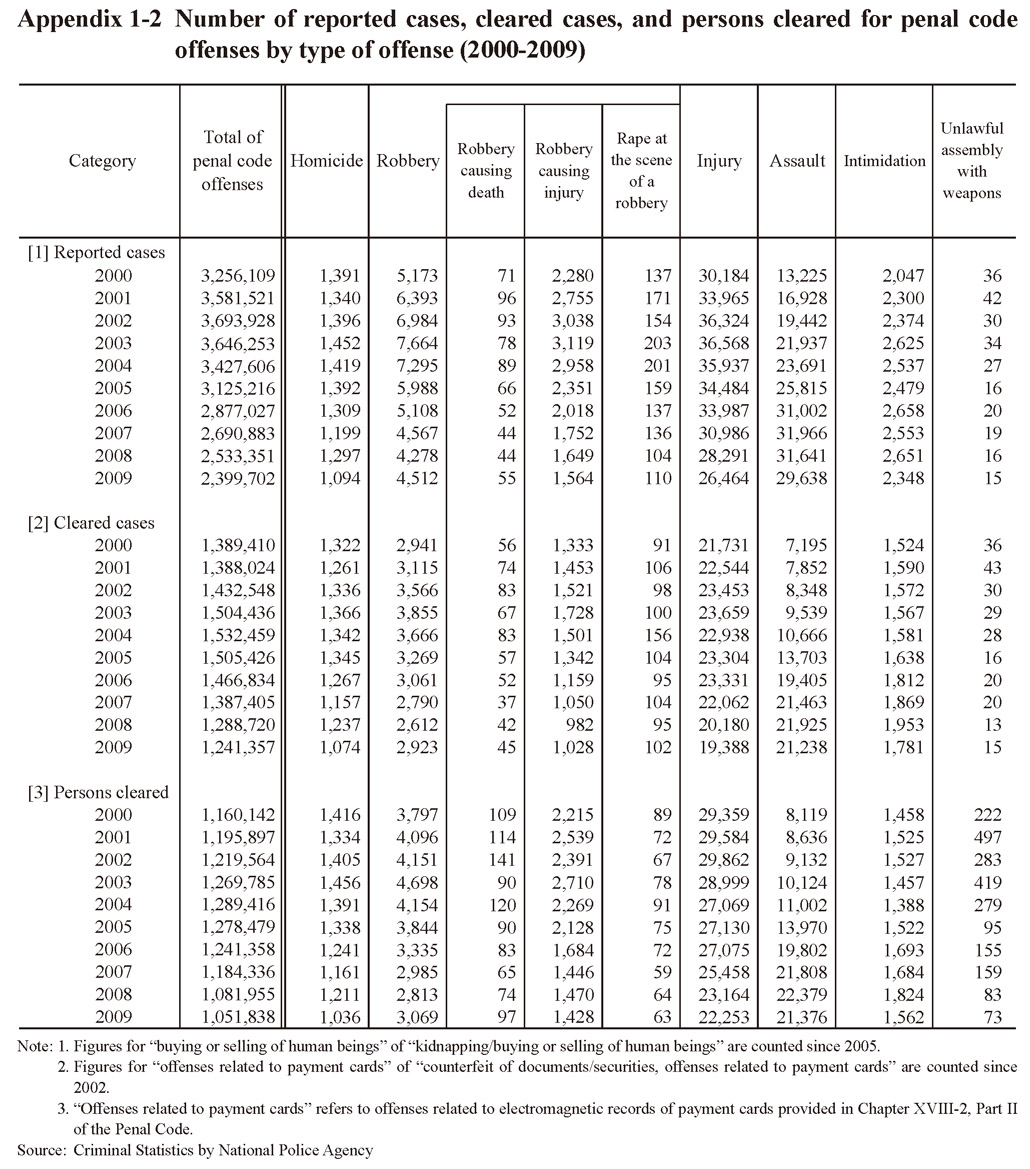
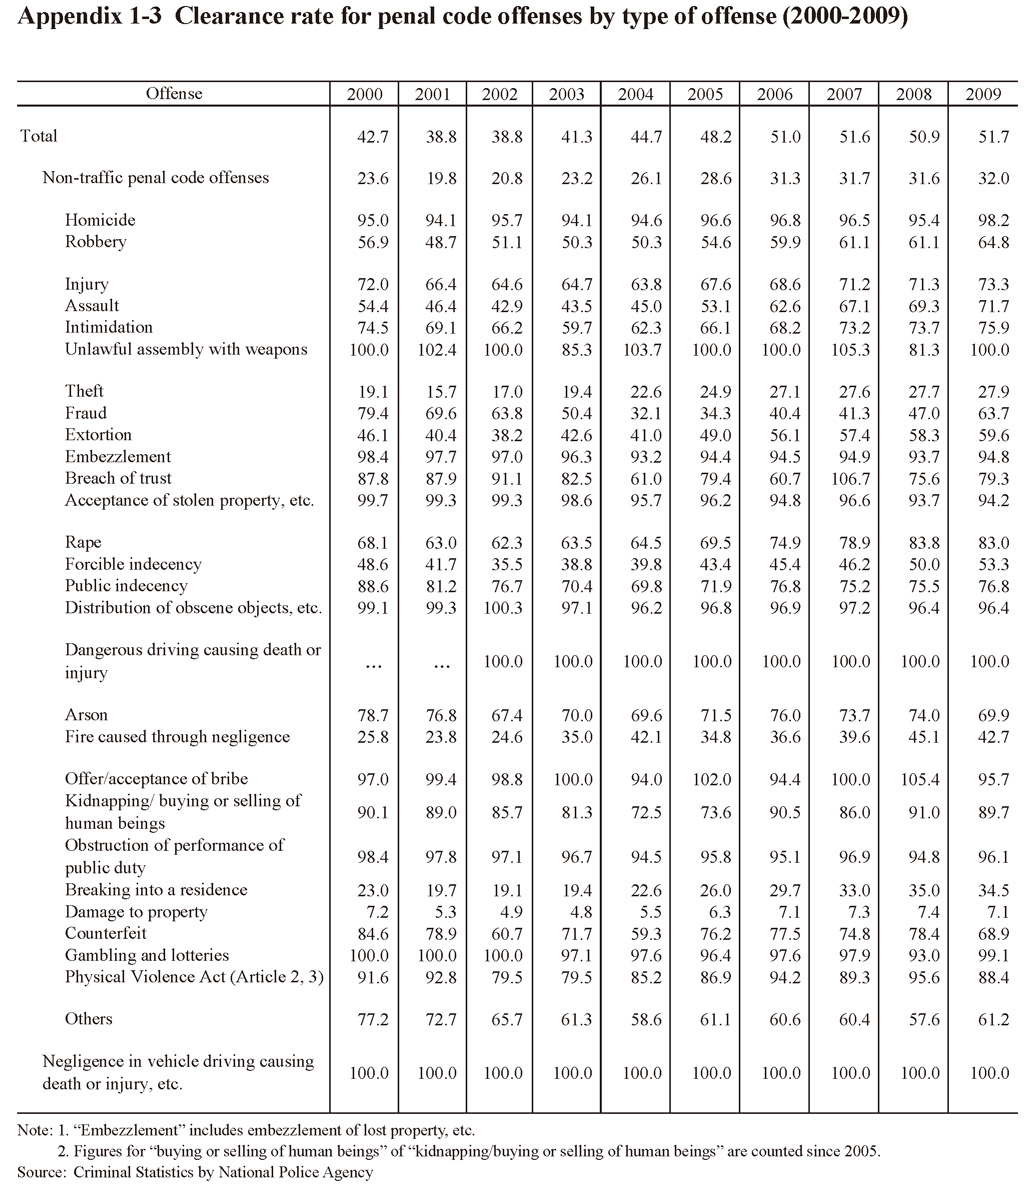 Table 1-3 Clearance rate for penal code offenses by type of offense (2000-2009)
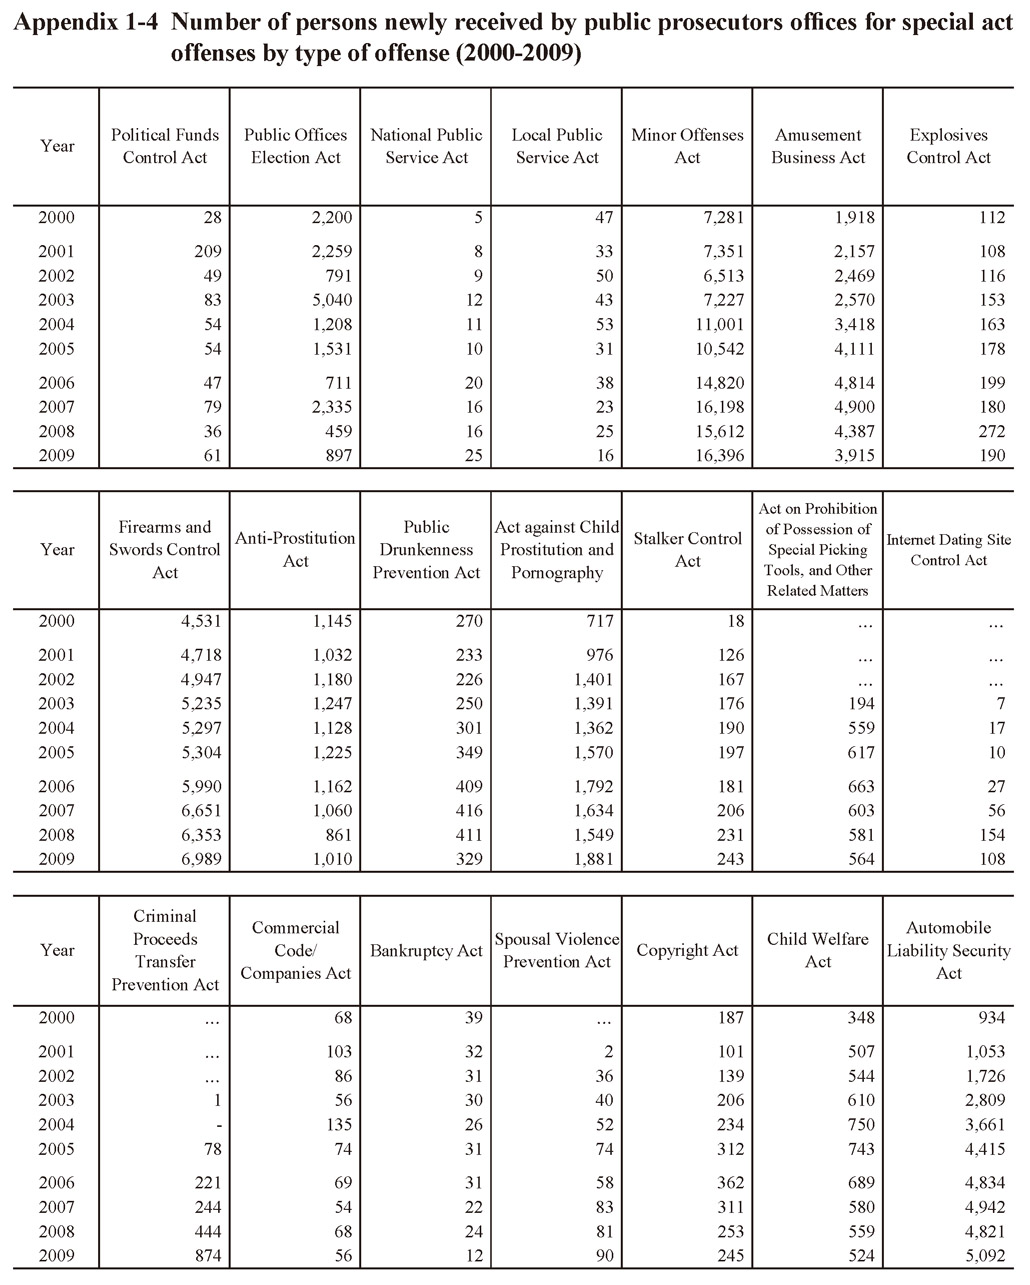
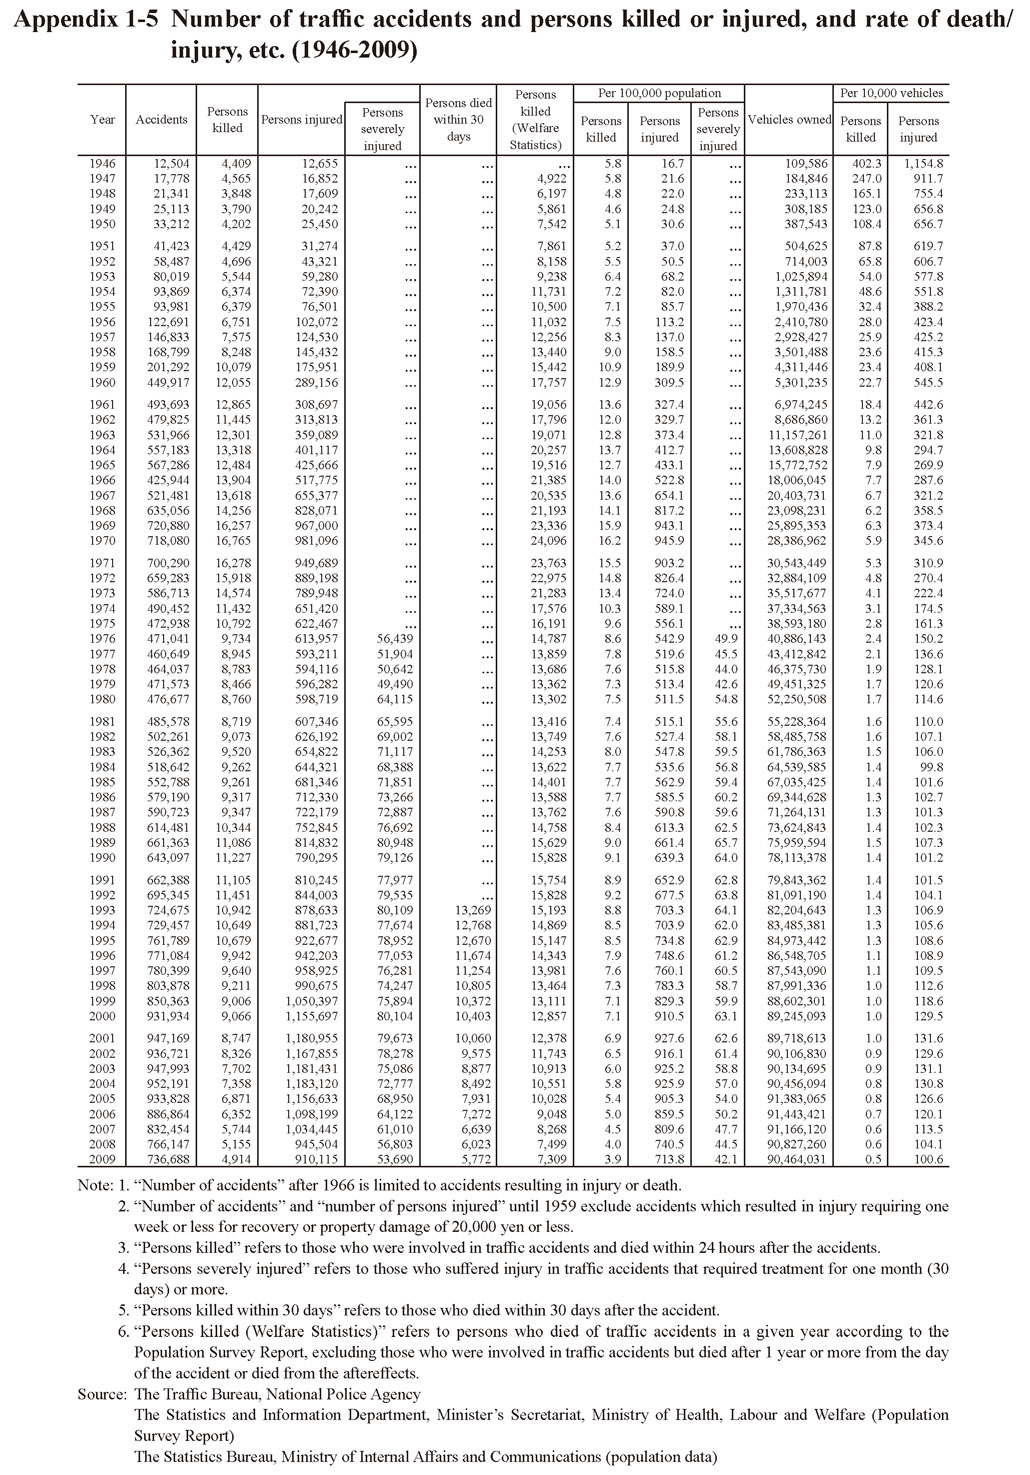

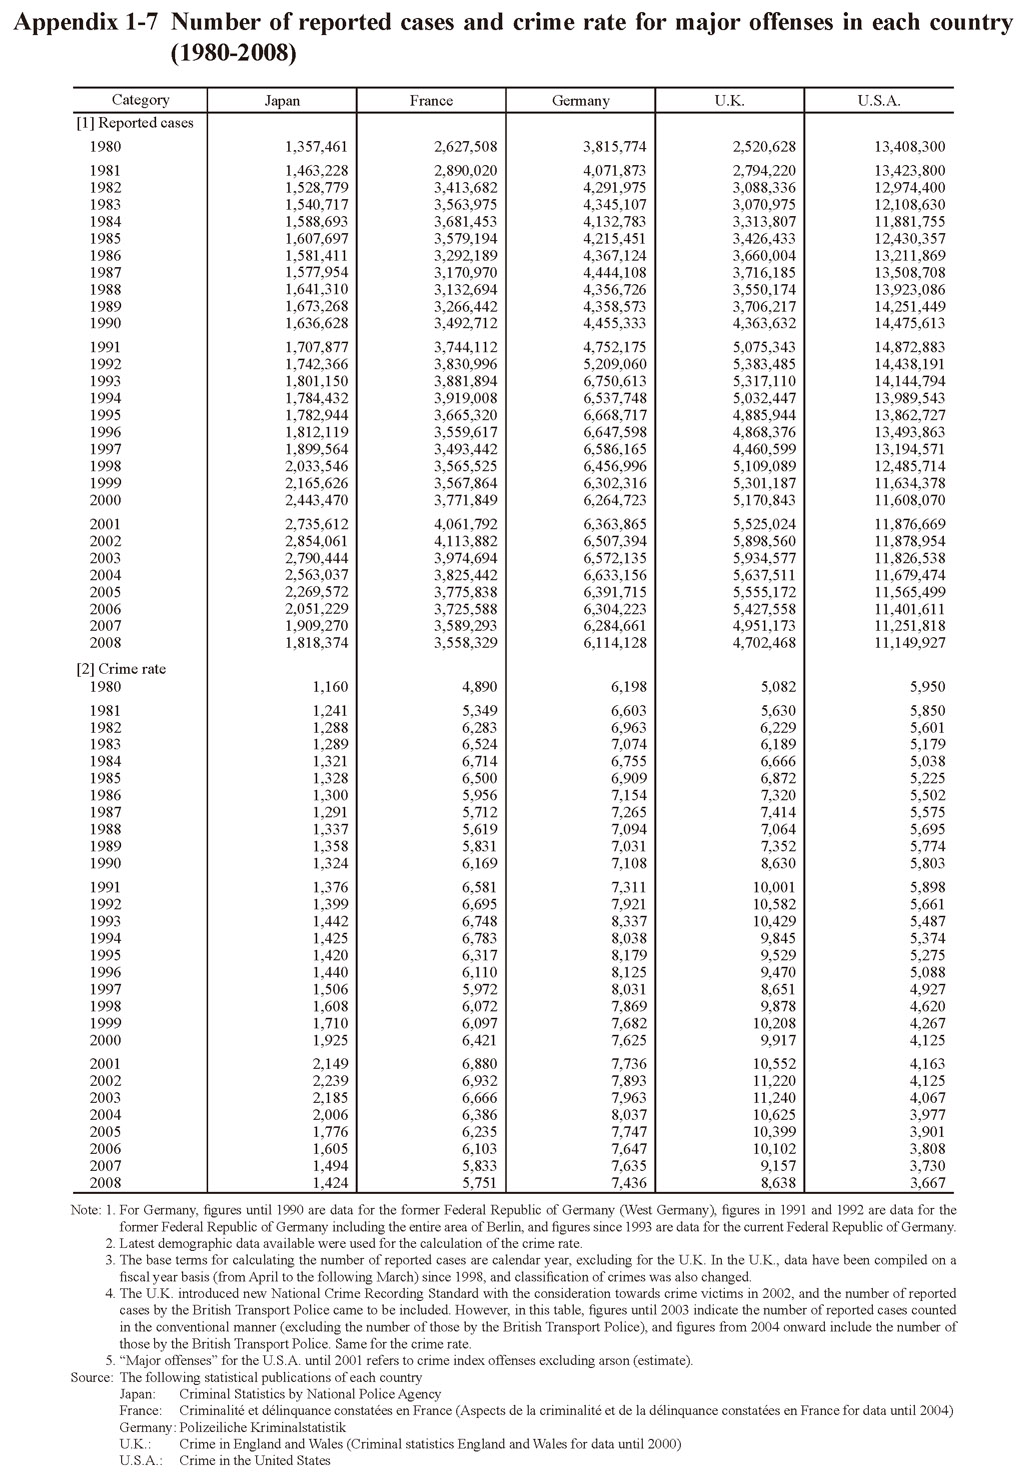 Table 1-7 Number of reported cases and crime rate for major offenses in each country (1980-2008)
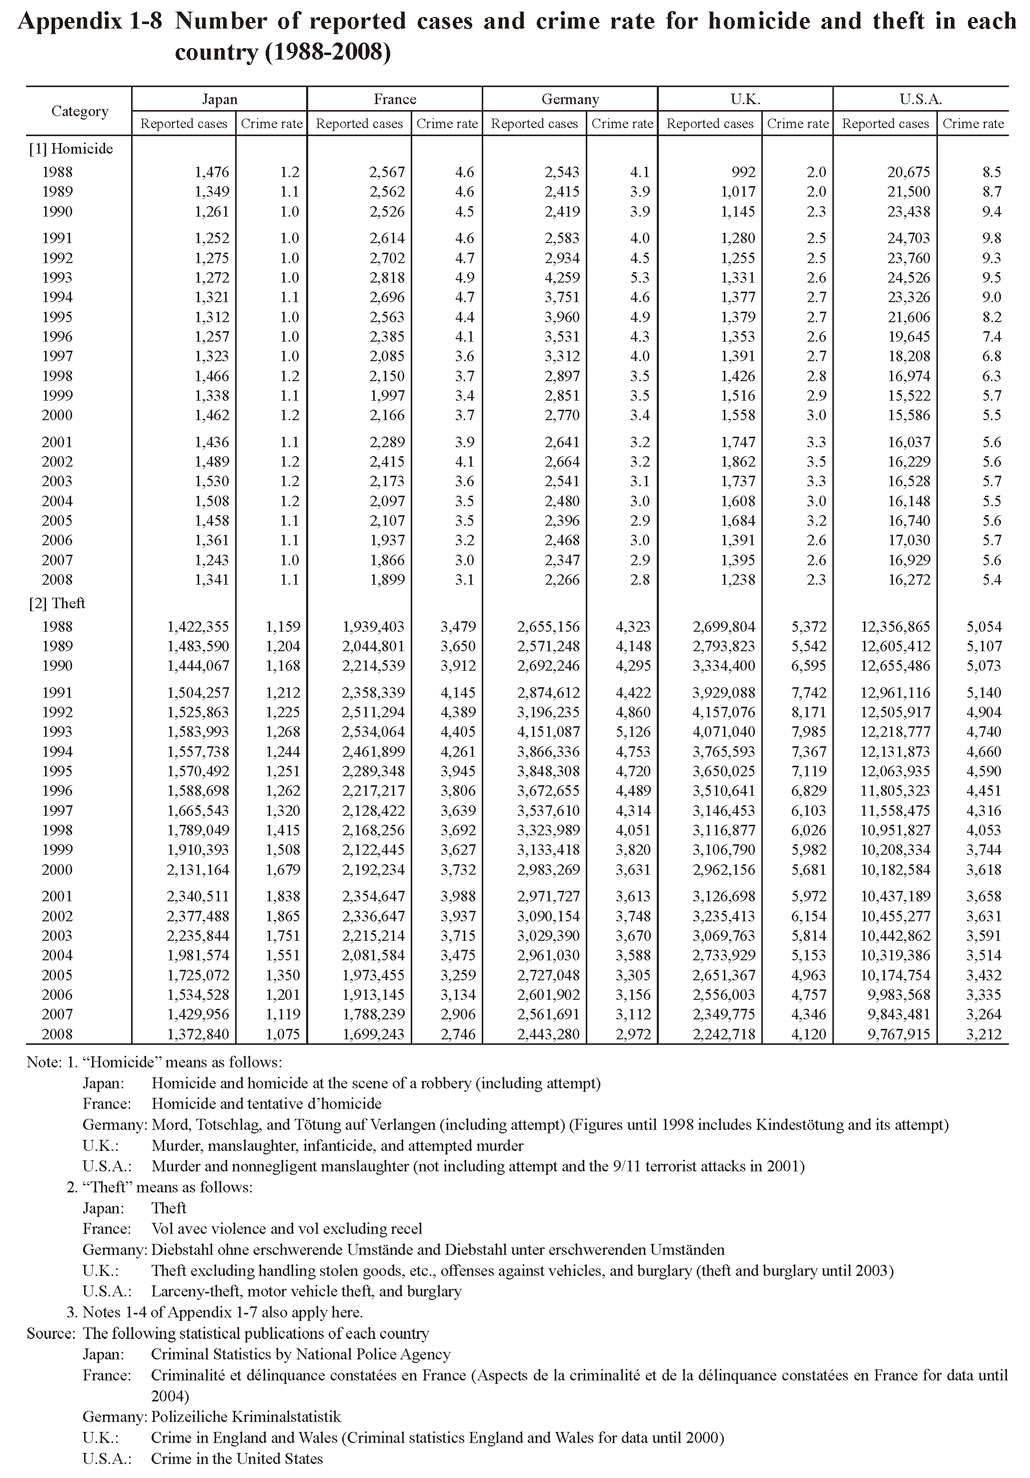 Table 1-8 Number of reported cases and crime rate for homicide and theft in each country (1988-2008)
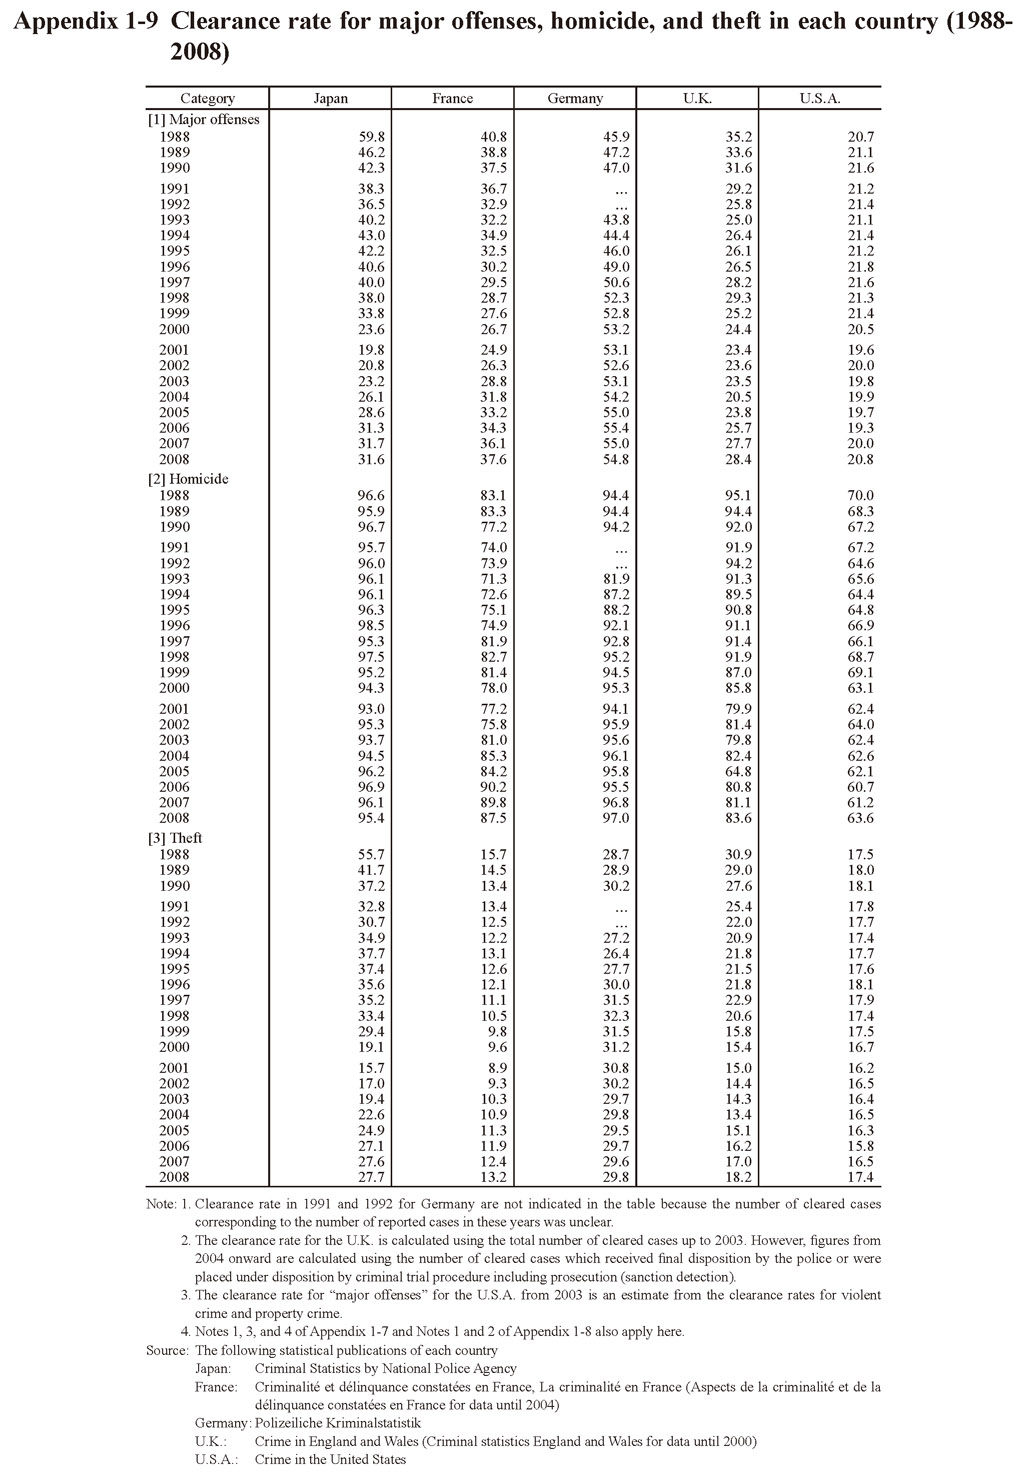 Table 1-9 Clearance rate for major offenses, homicide, and theft in each country (1988-2008)
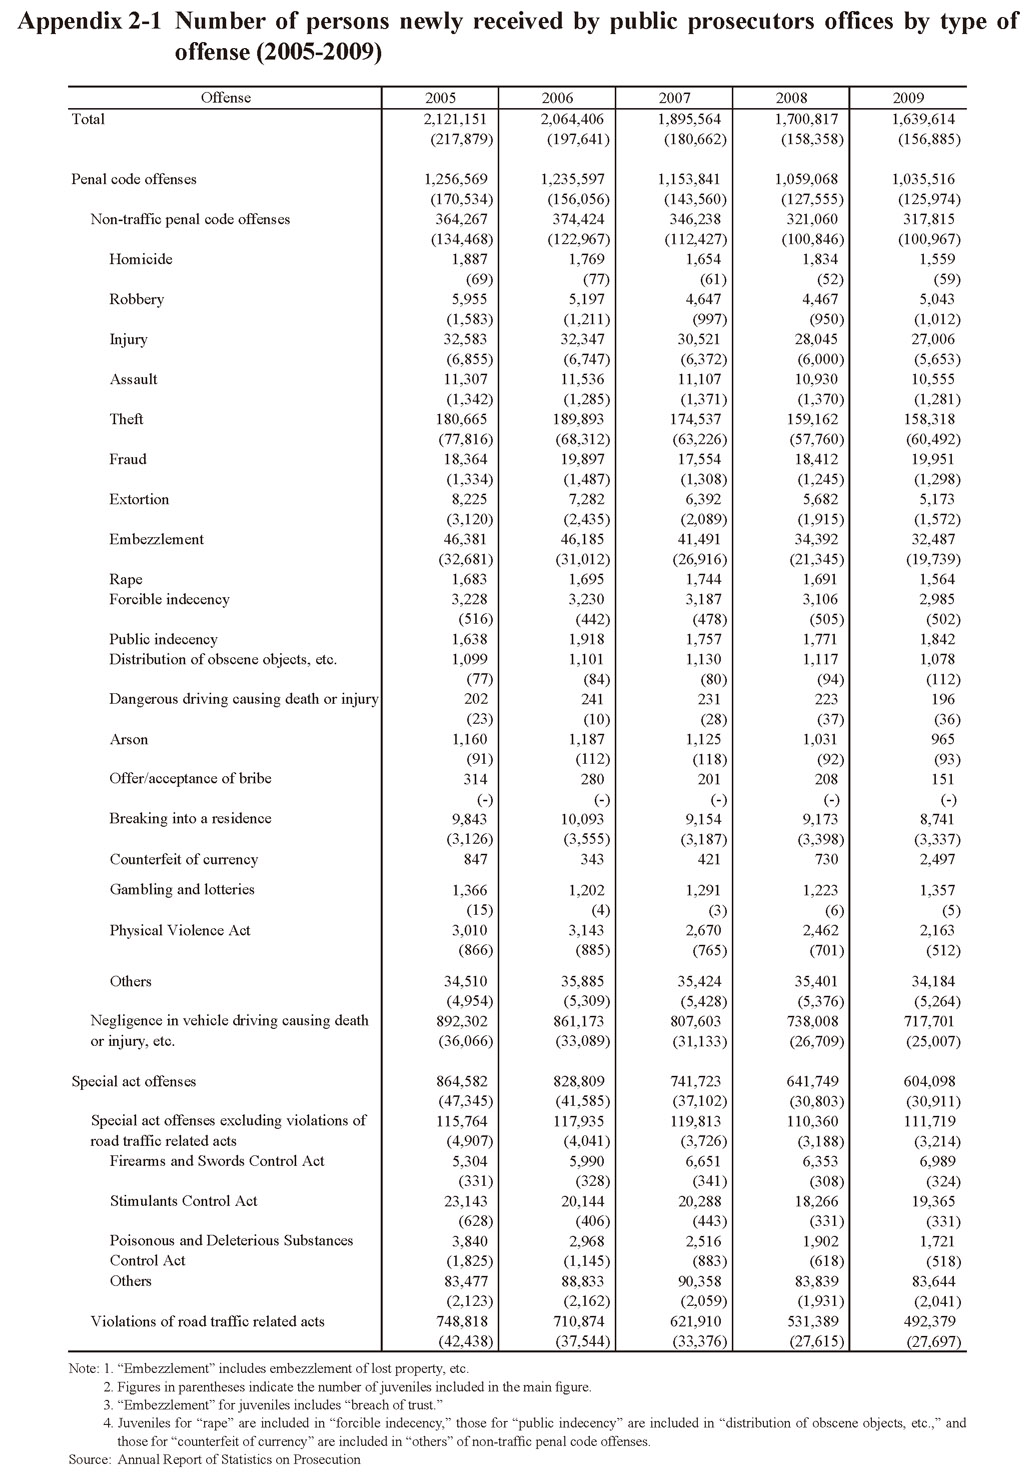
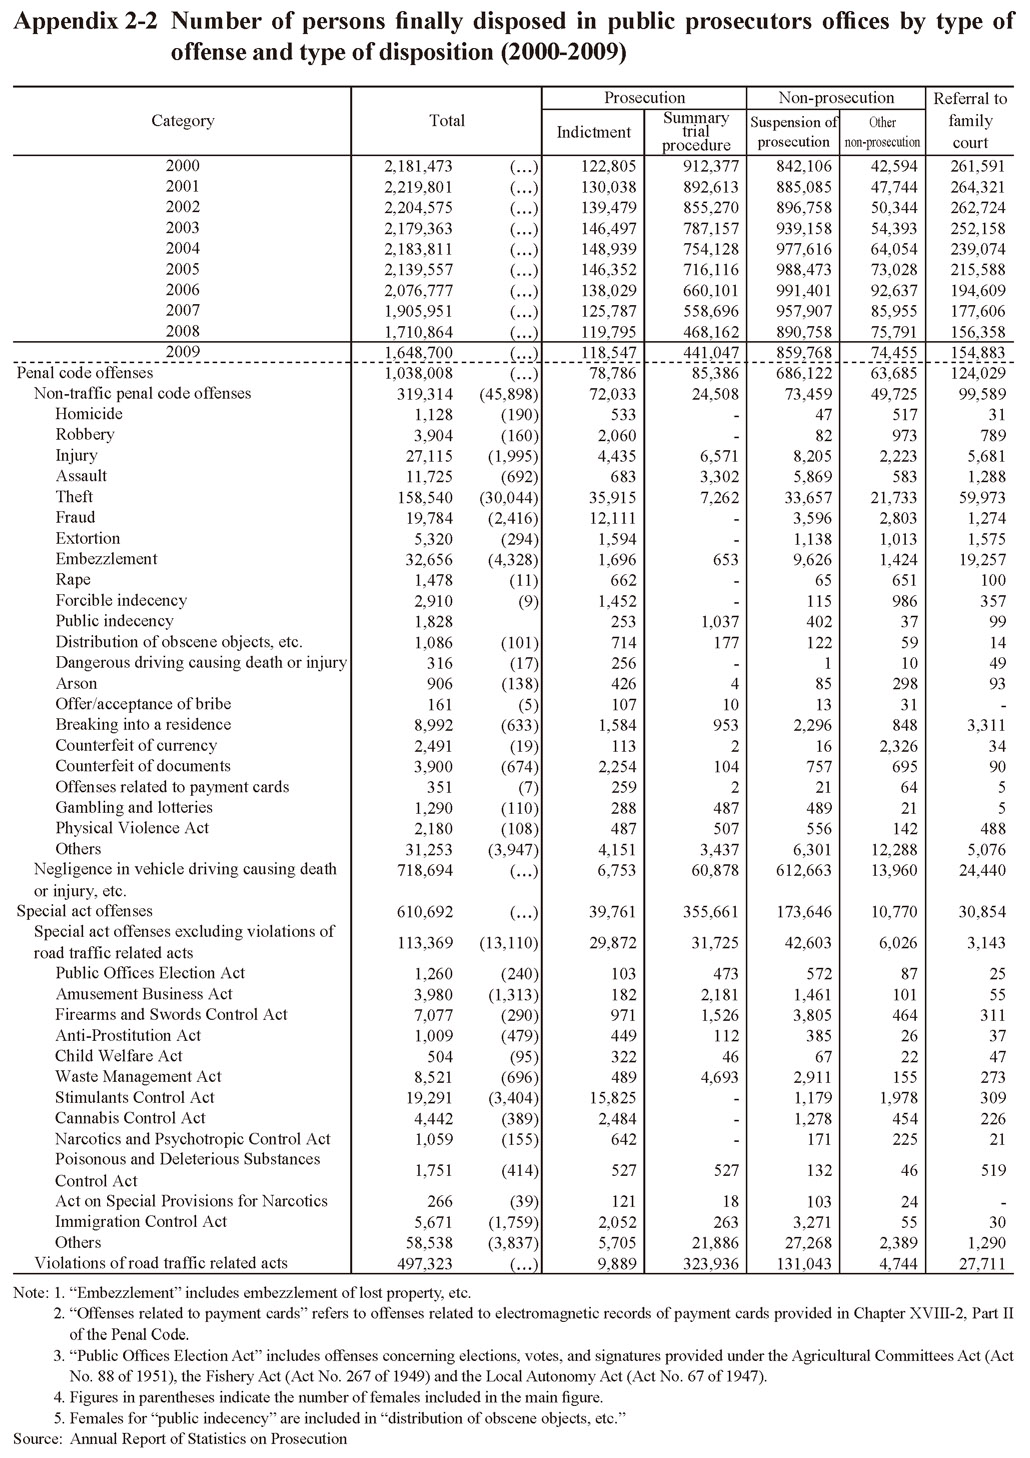
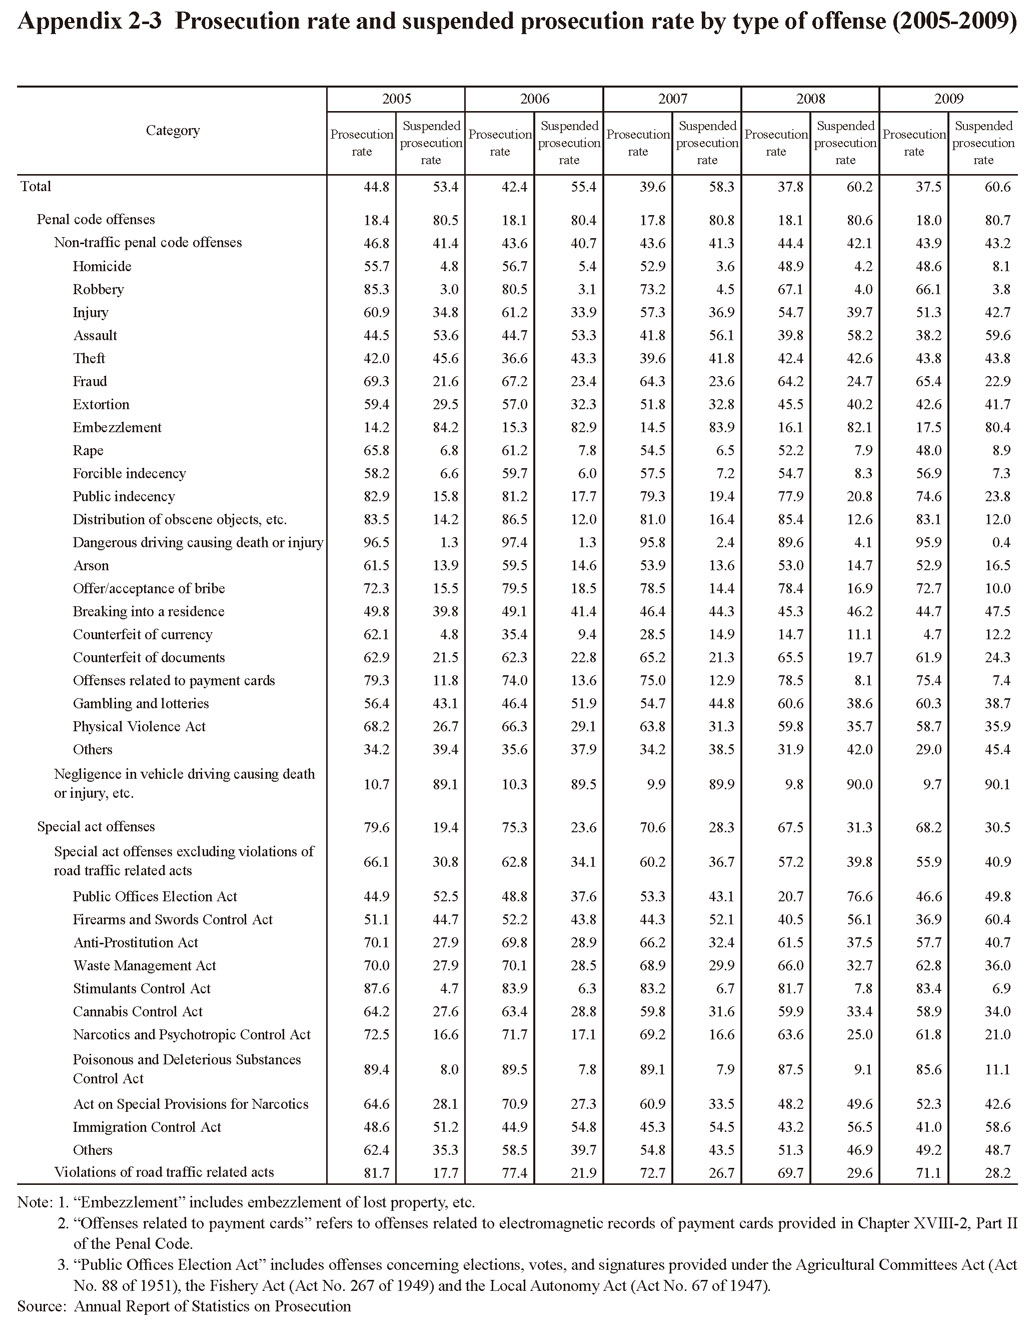 Table 2-3 Prosecution rate and suspended prosecution rate by type of offense (2005-2009)
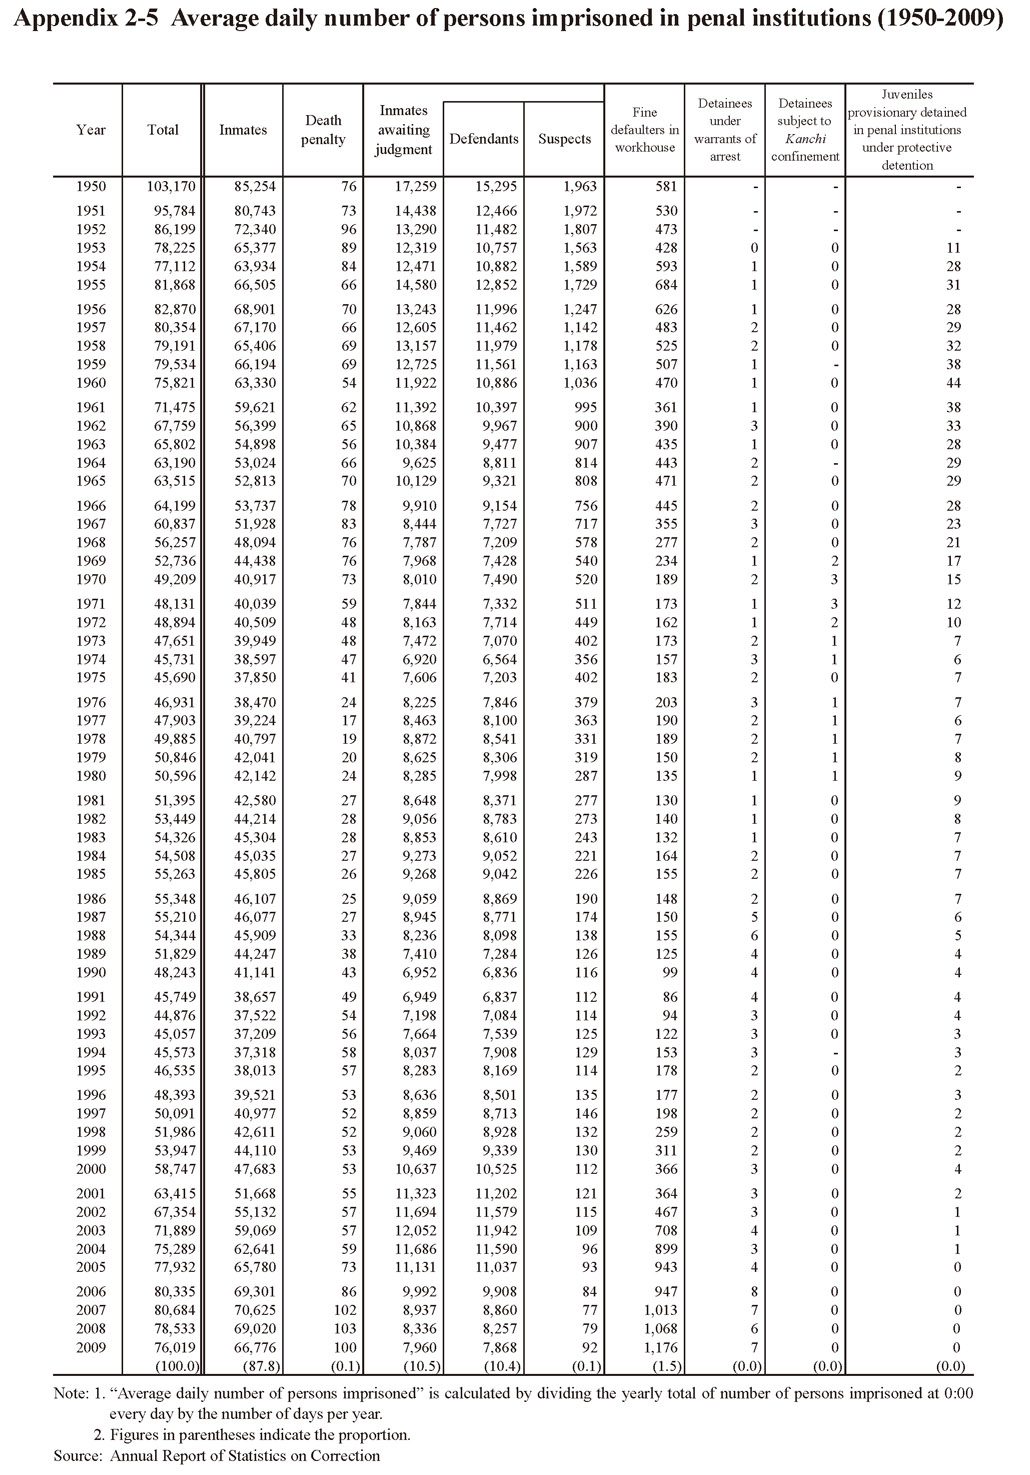 Table 2-5 Average daily number of persons imprisoned in penal institutions (1950-2009)
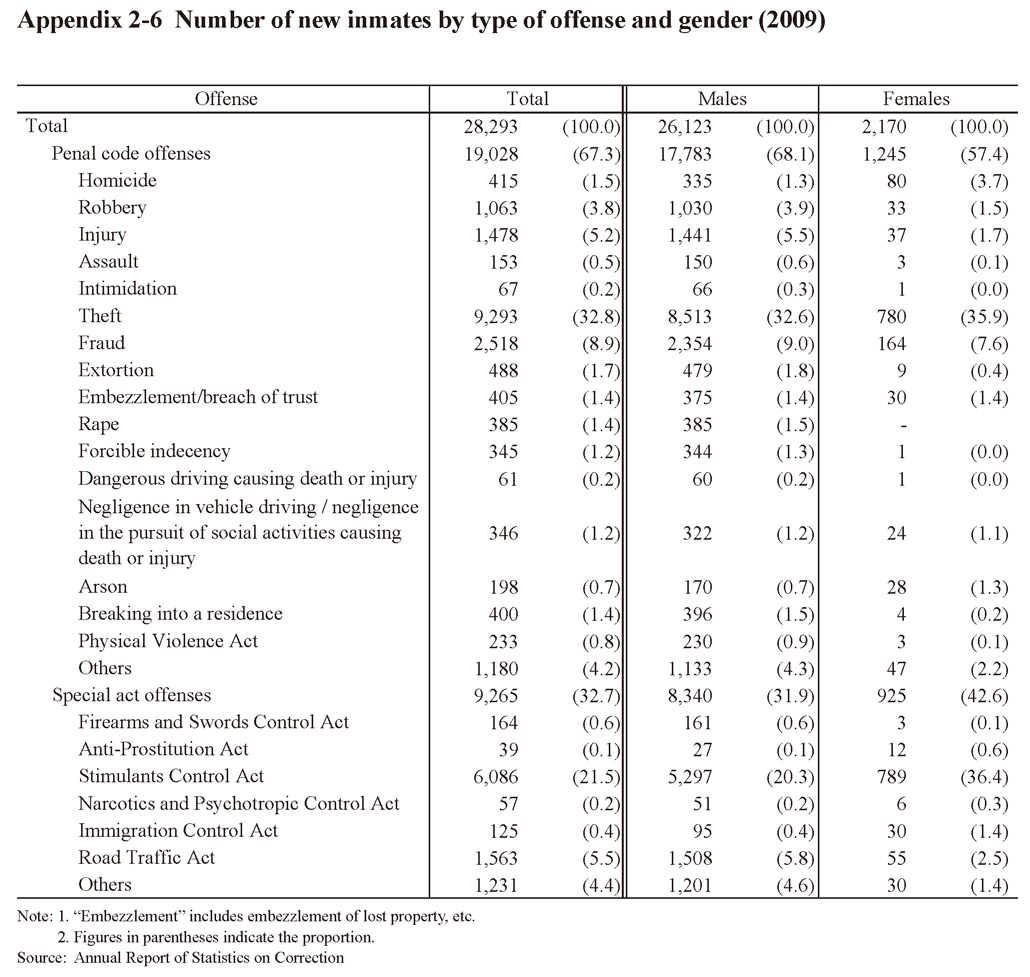 Table 2-6 Number of new inmates by type of offense and gender (2009)
 Table 2-7 Number of reimprisoned inmates by type of offense and gender (2009)
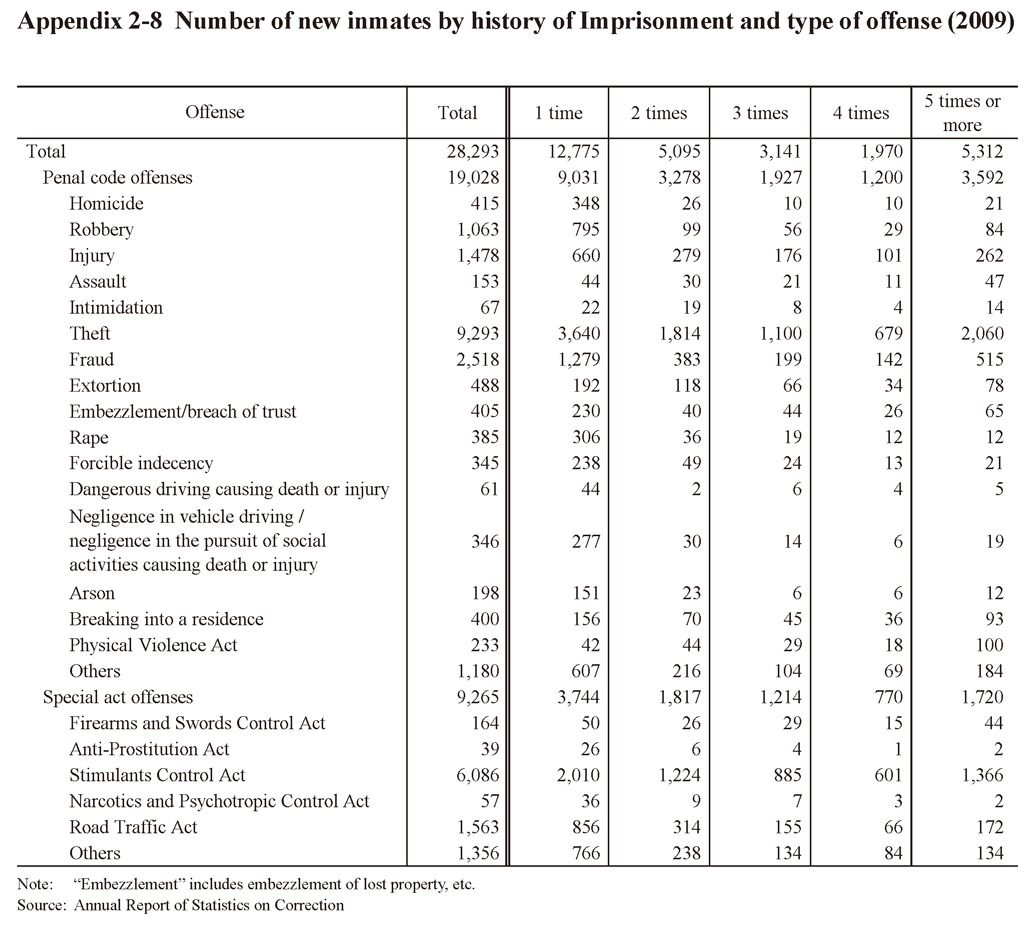 Table 2-8 Number of new inmates by history of Imprisonment and type of offense (2009)
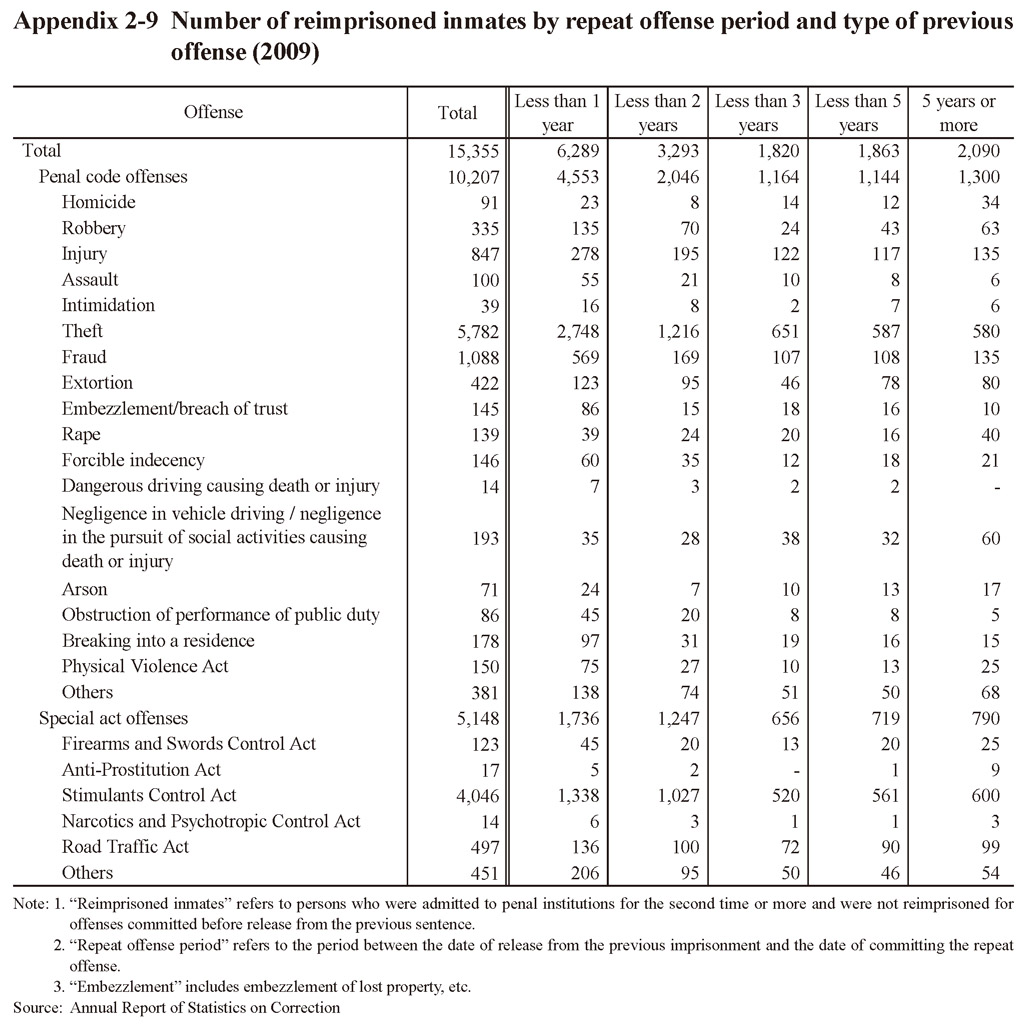
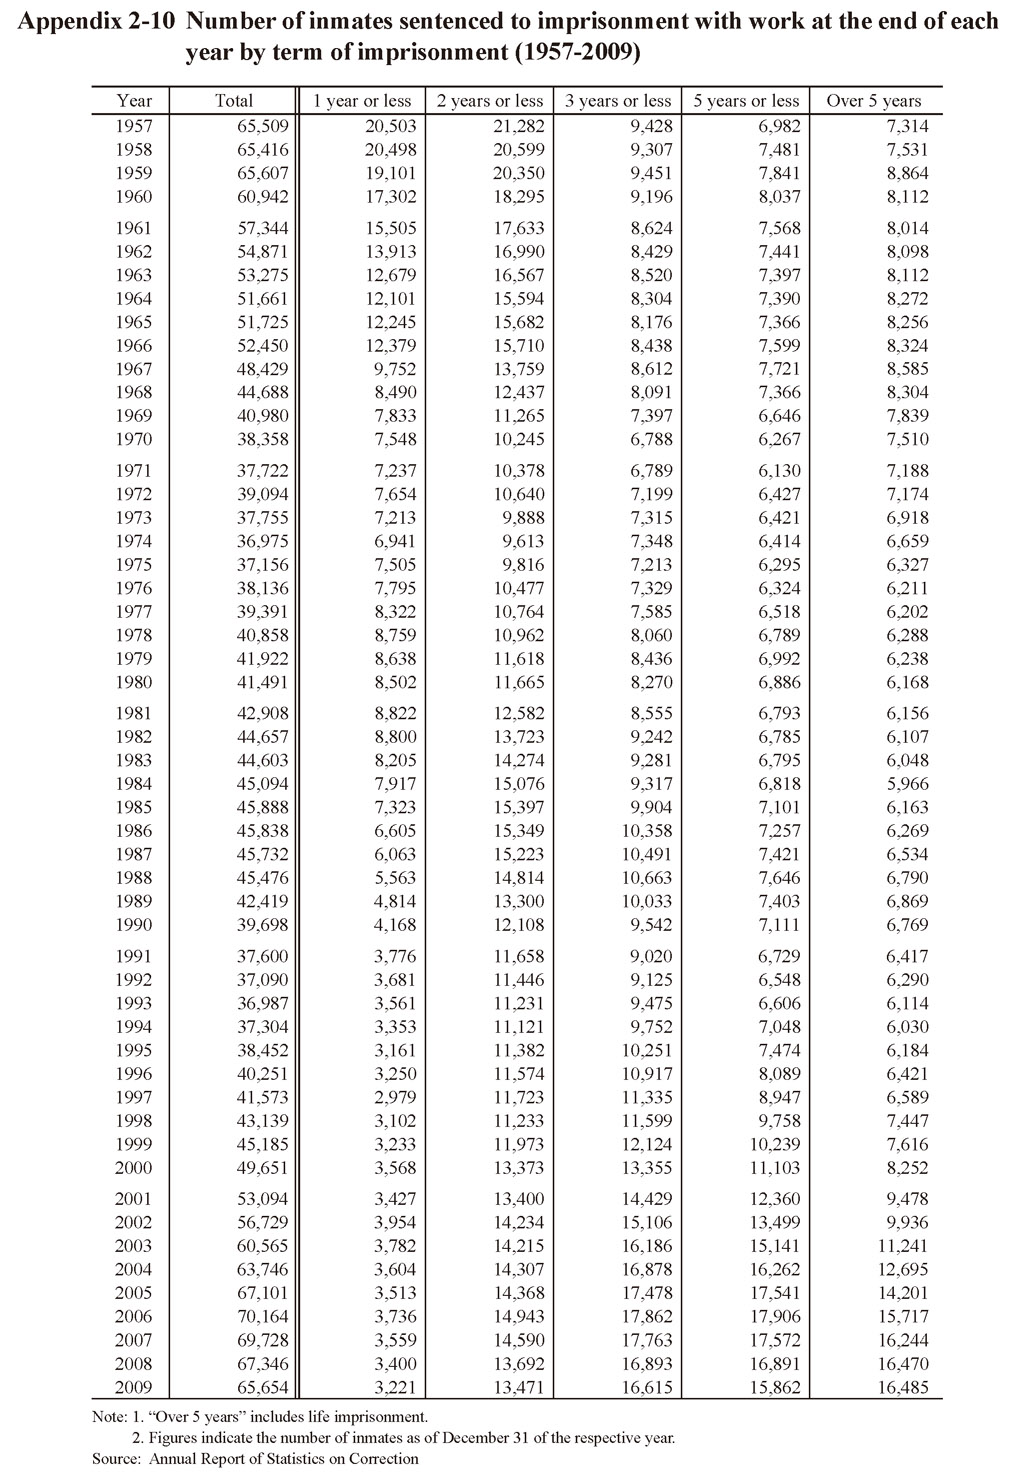
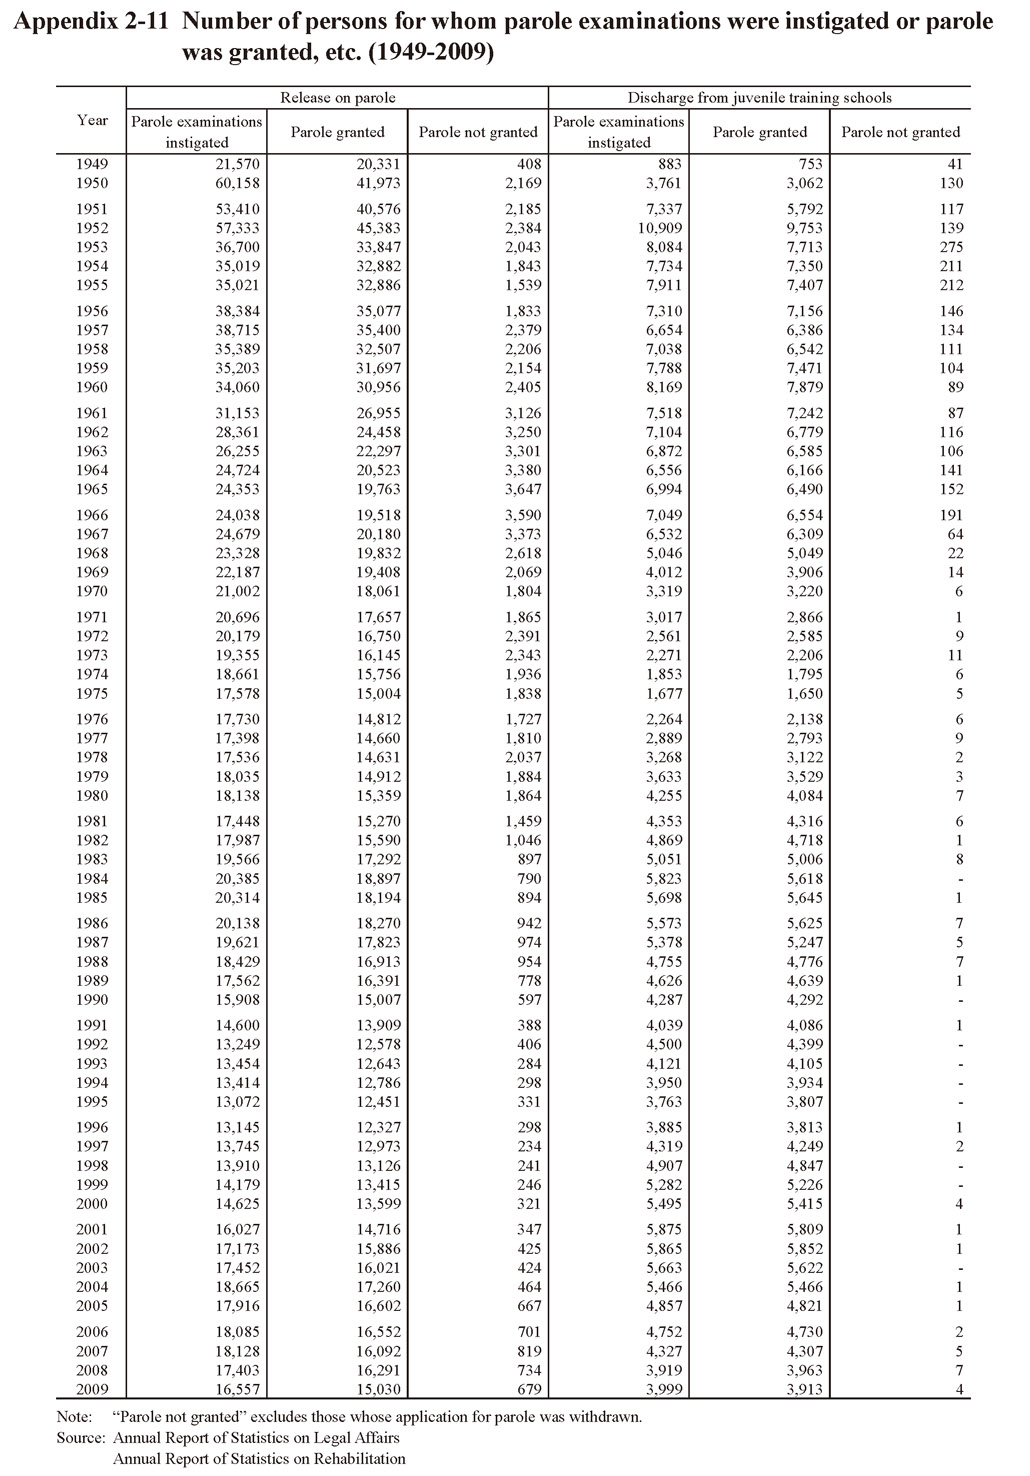
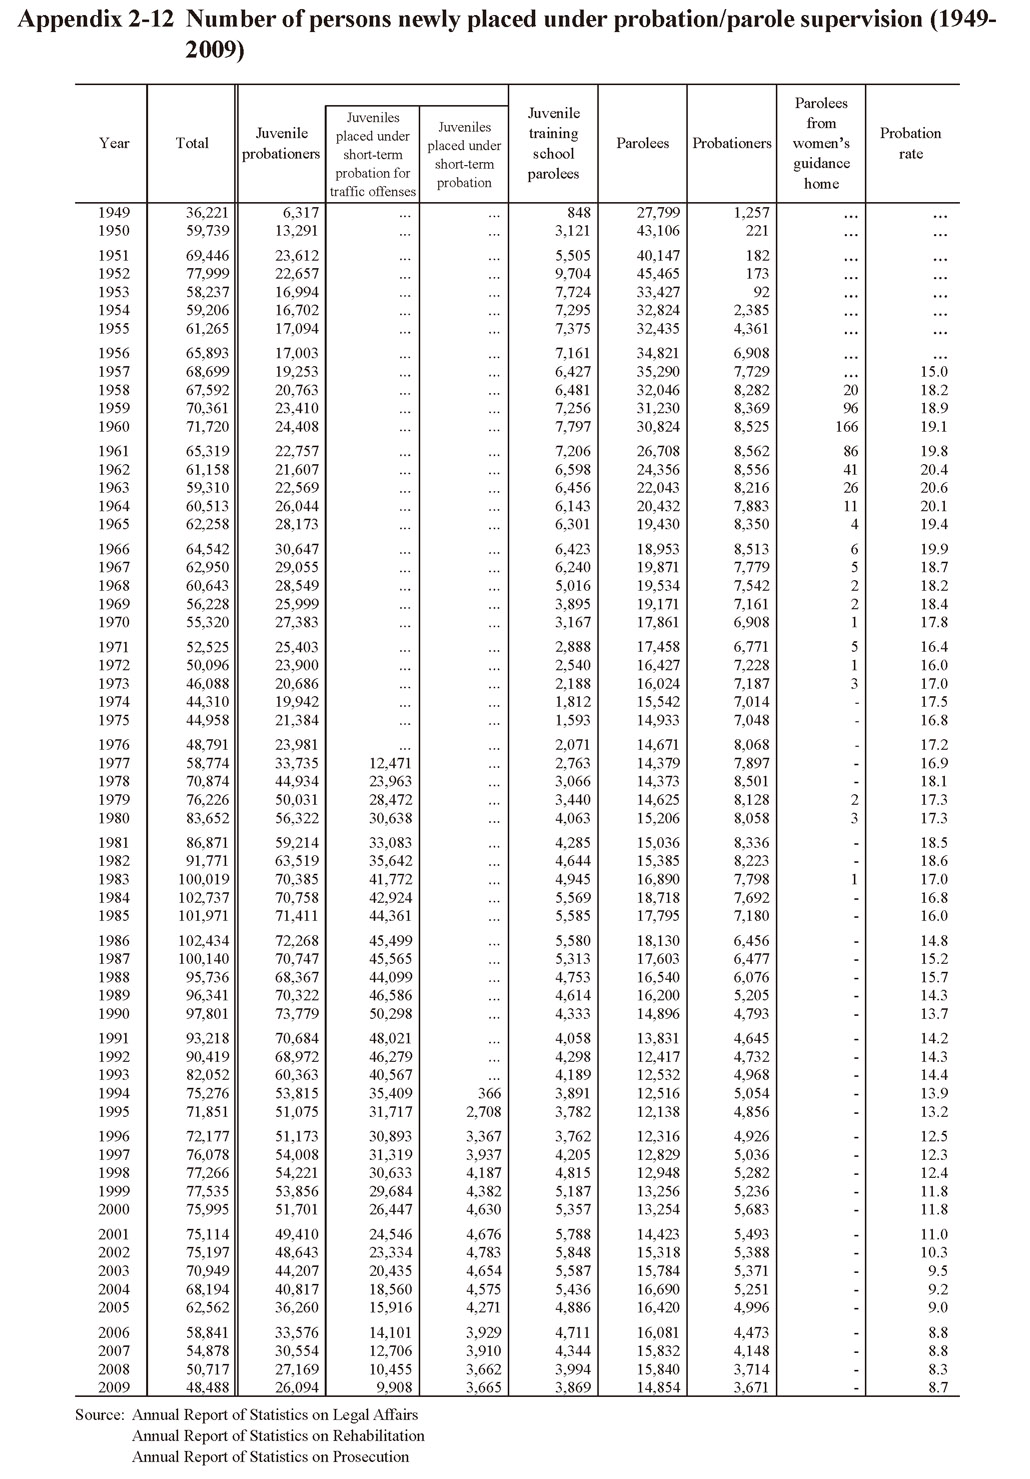 Table 2-12 Number of persons newly placed under probation/parole supervision (1949-2009)
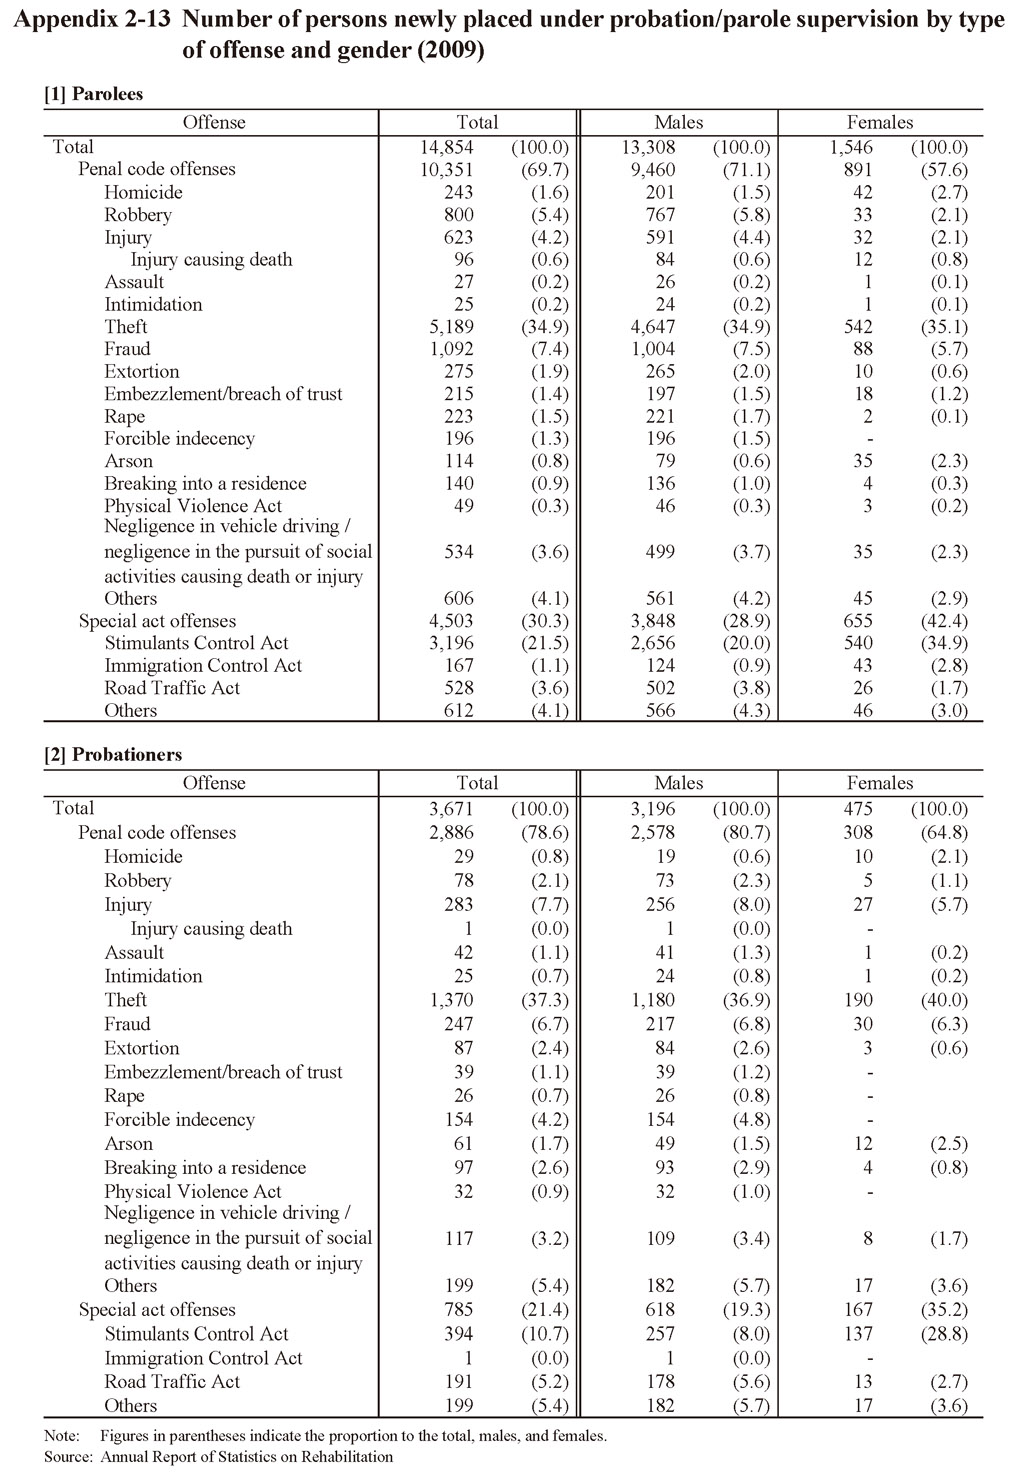
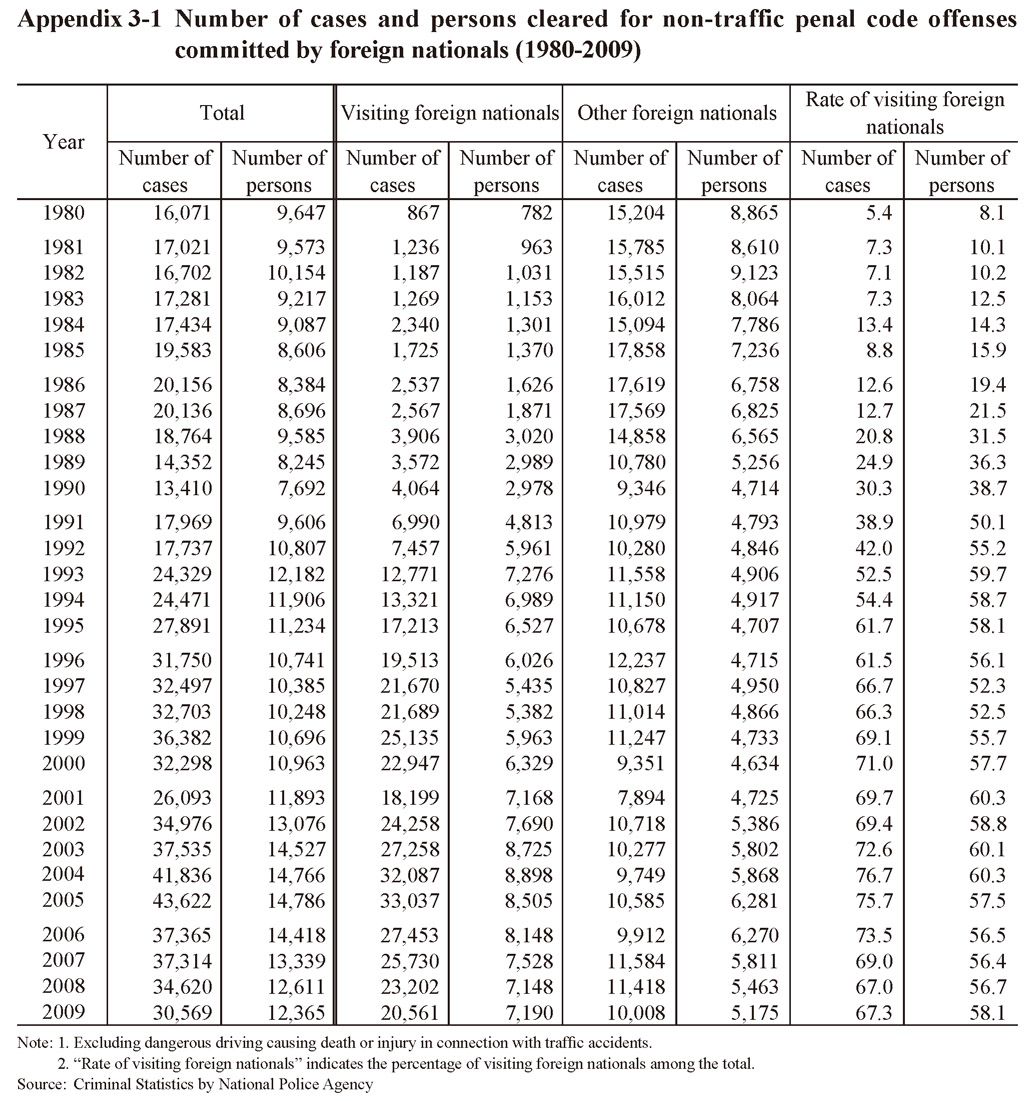

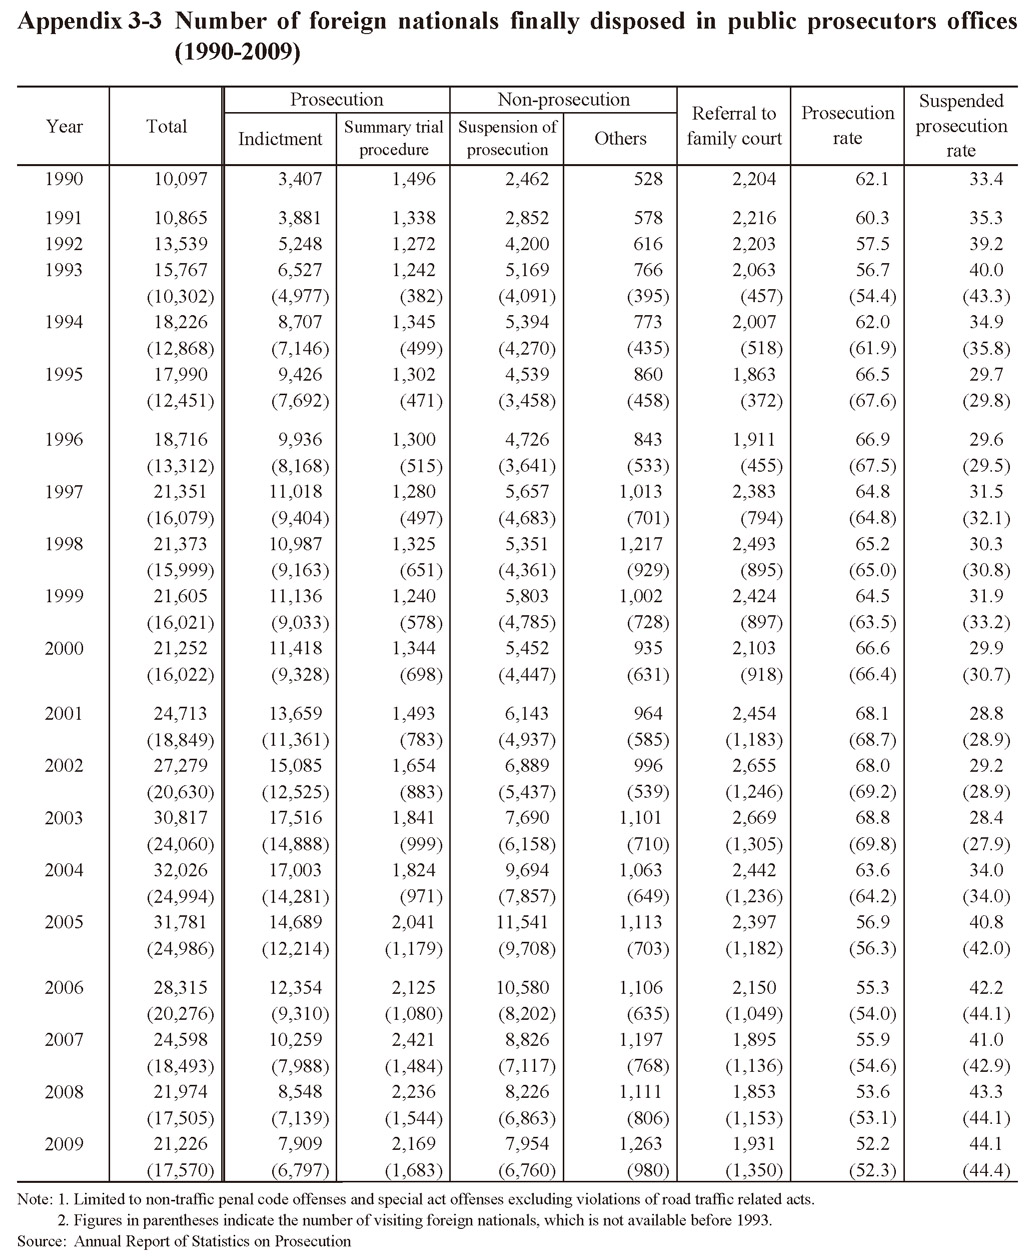 Table 3-3 Number of foreign nationals finally disposed in public prosecutors offices (1990-2009)
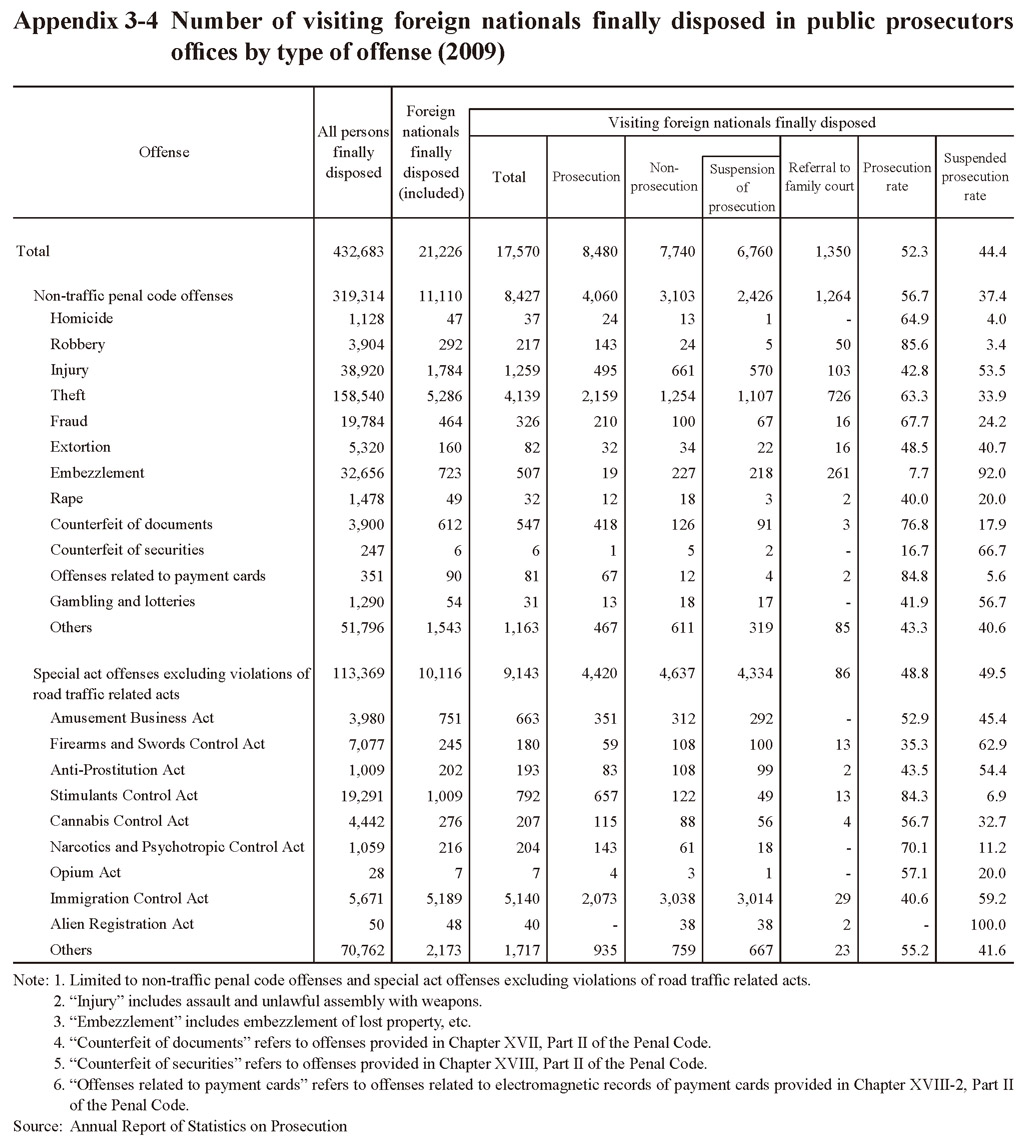
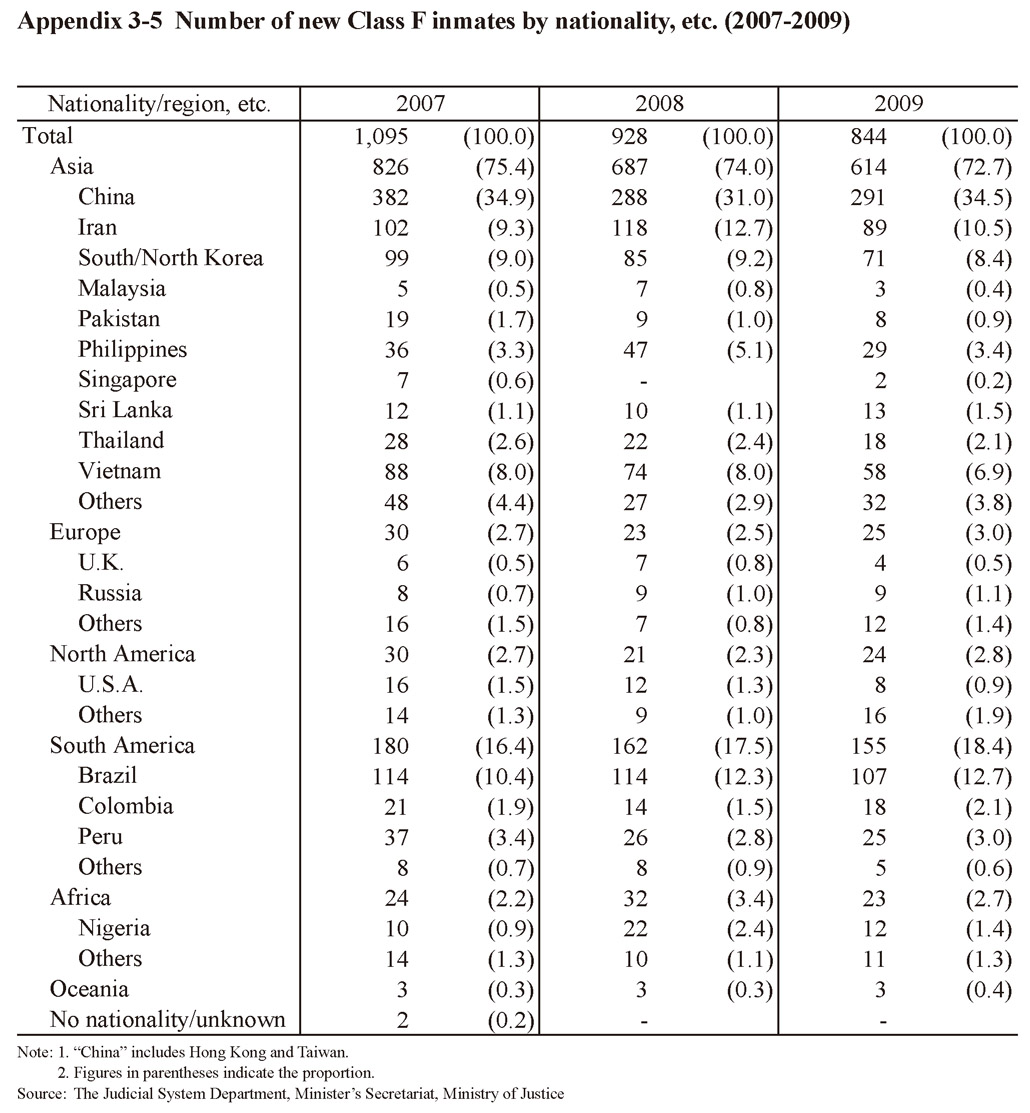 Table 3-5 Number of new Class F inmates by nationality, etc. (2007-2009)
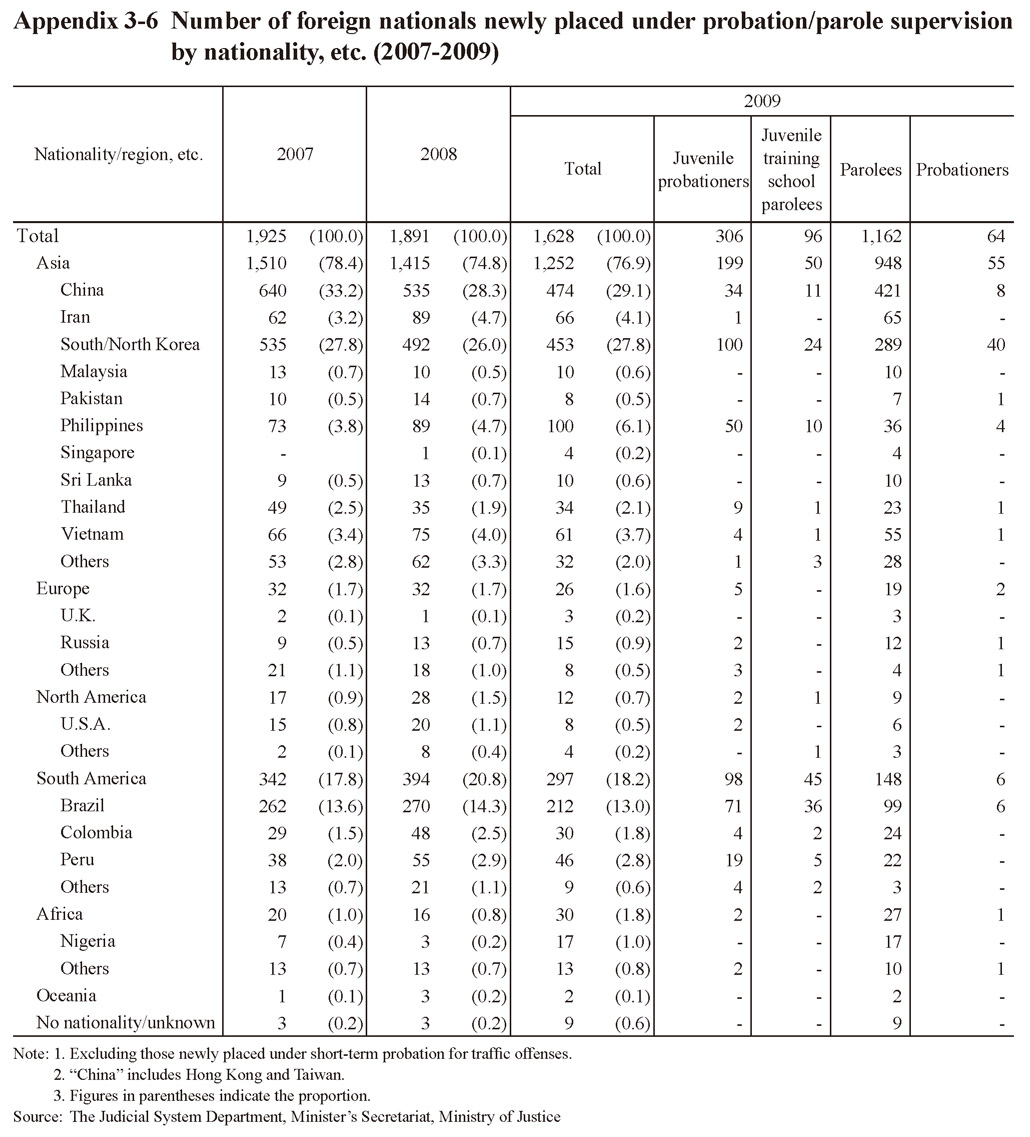

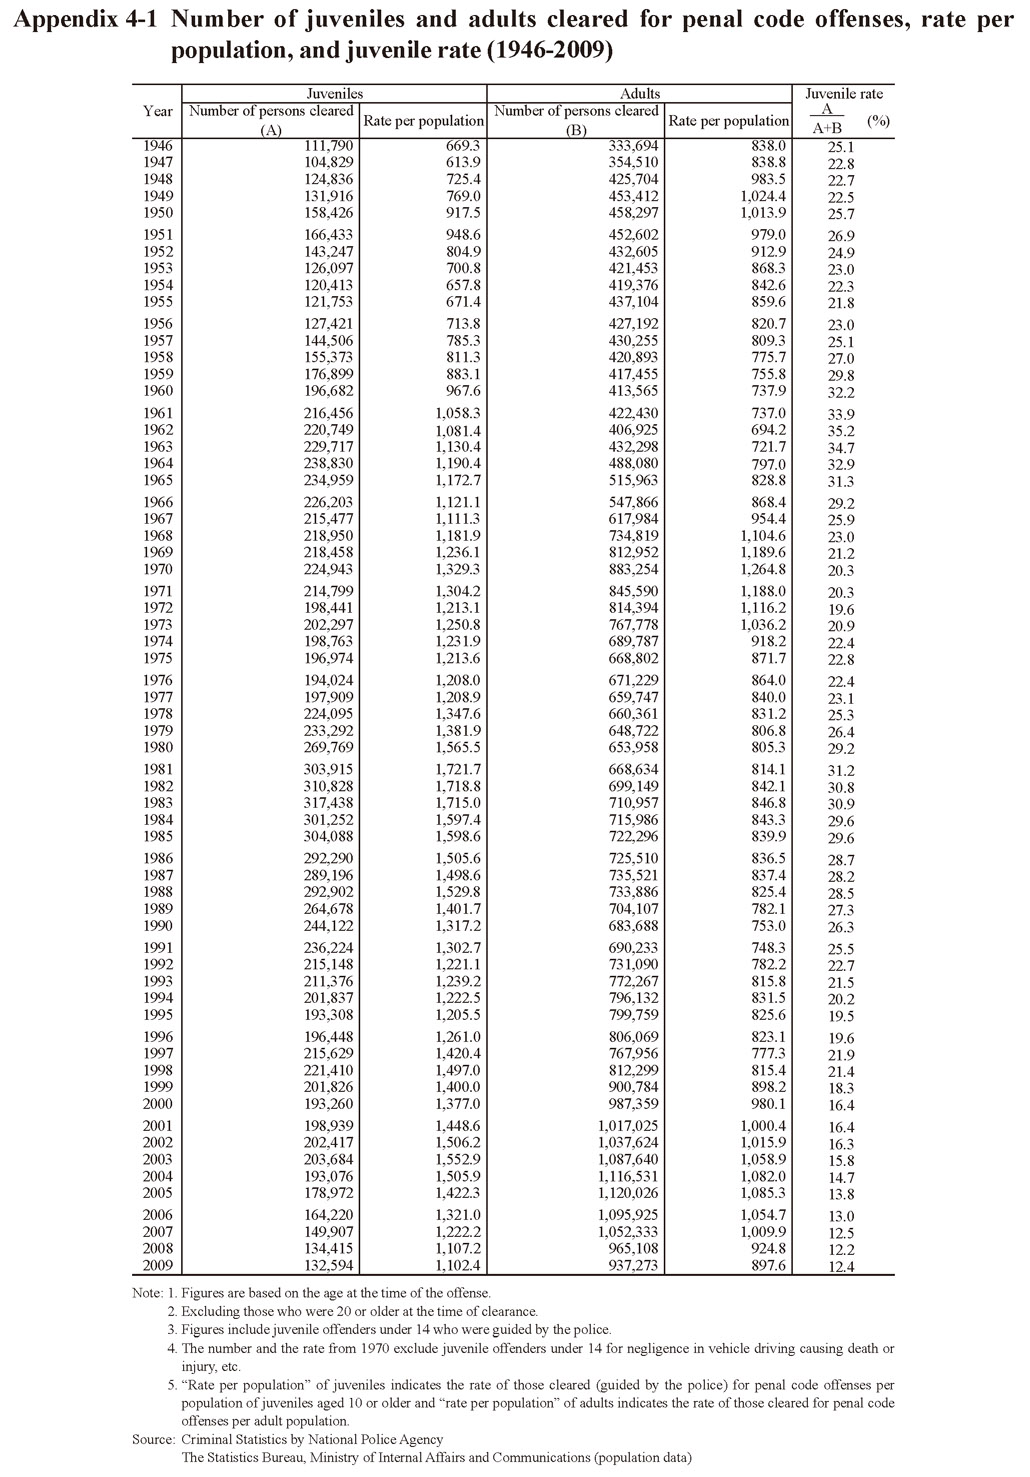
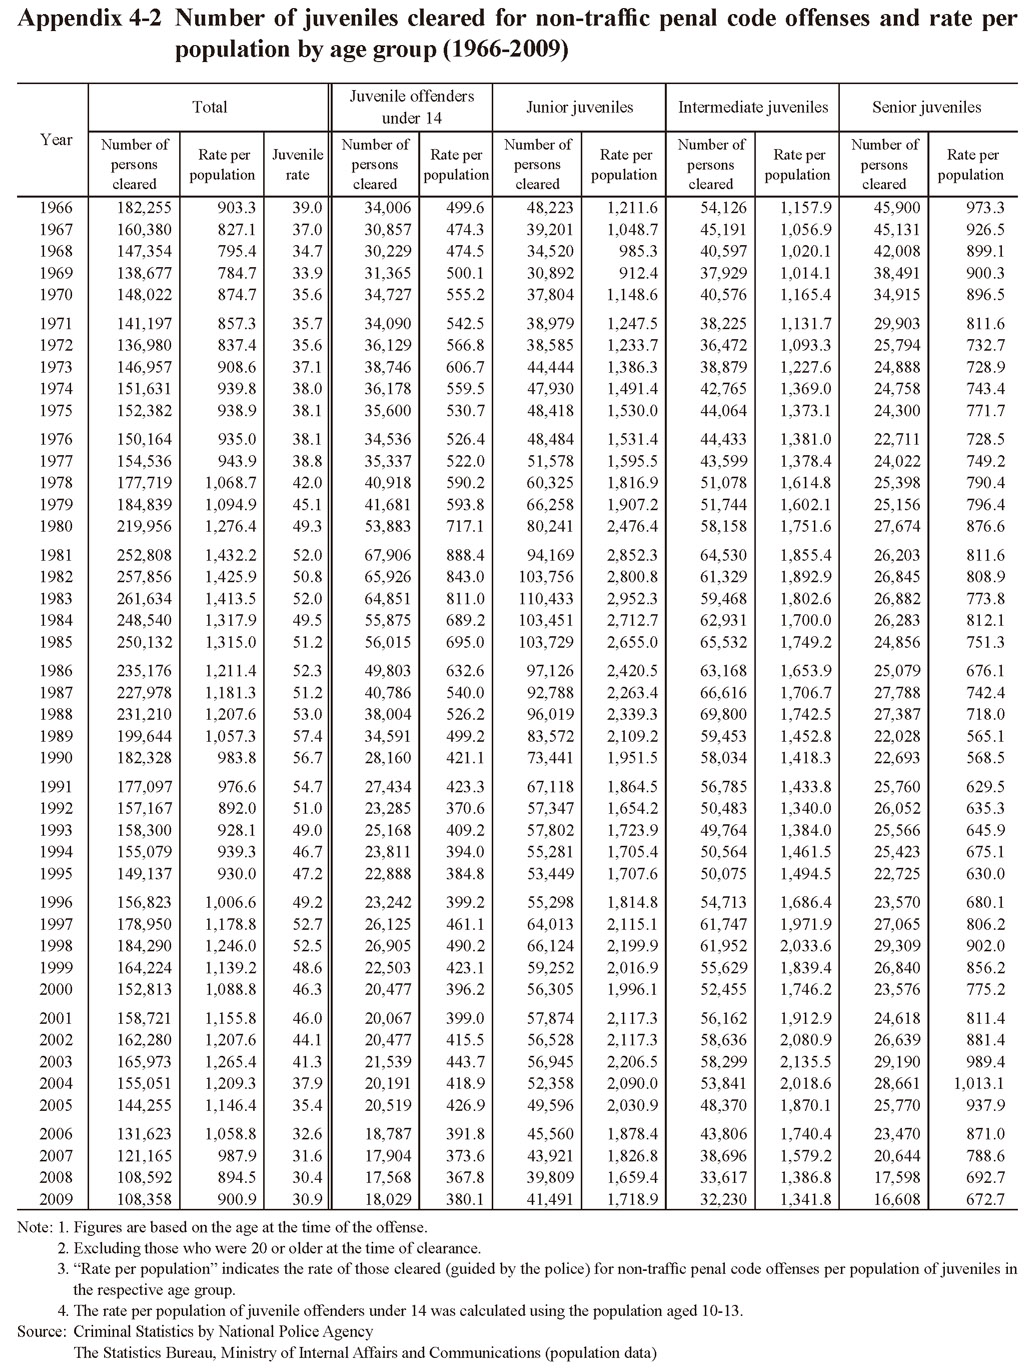
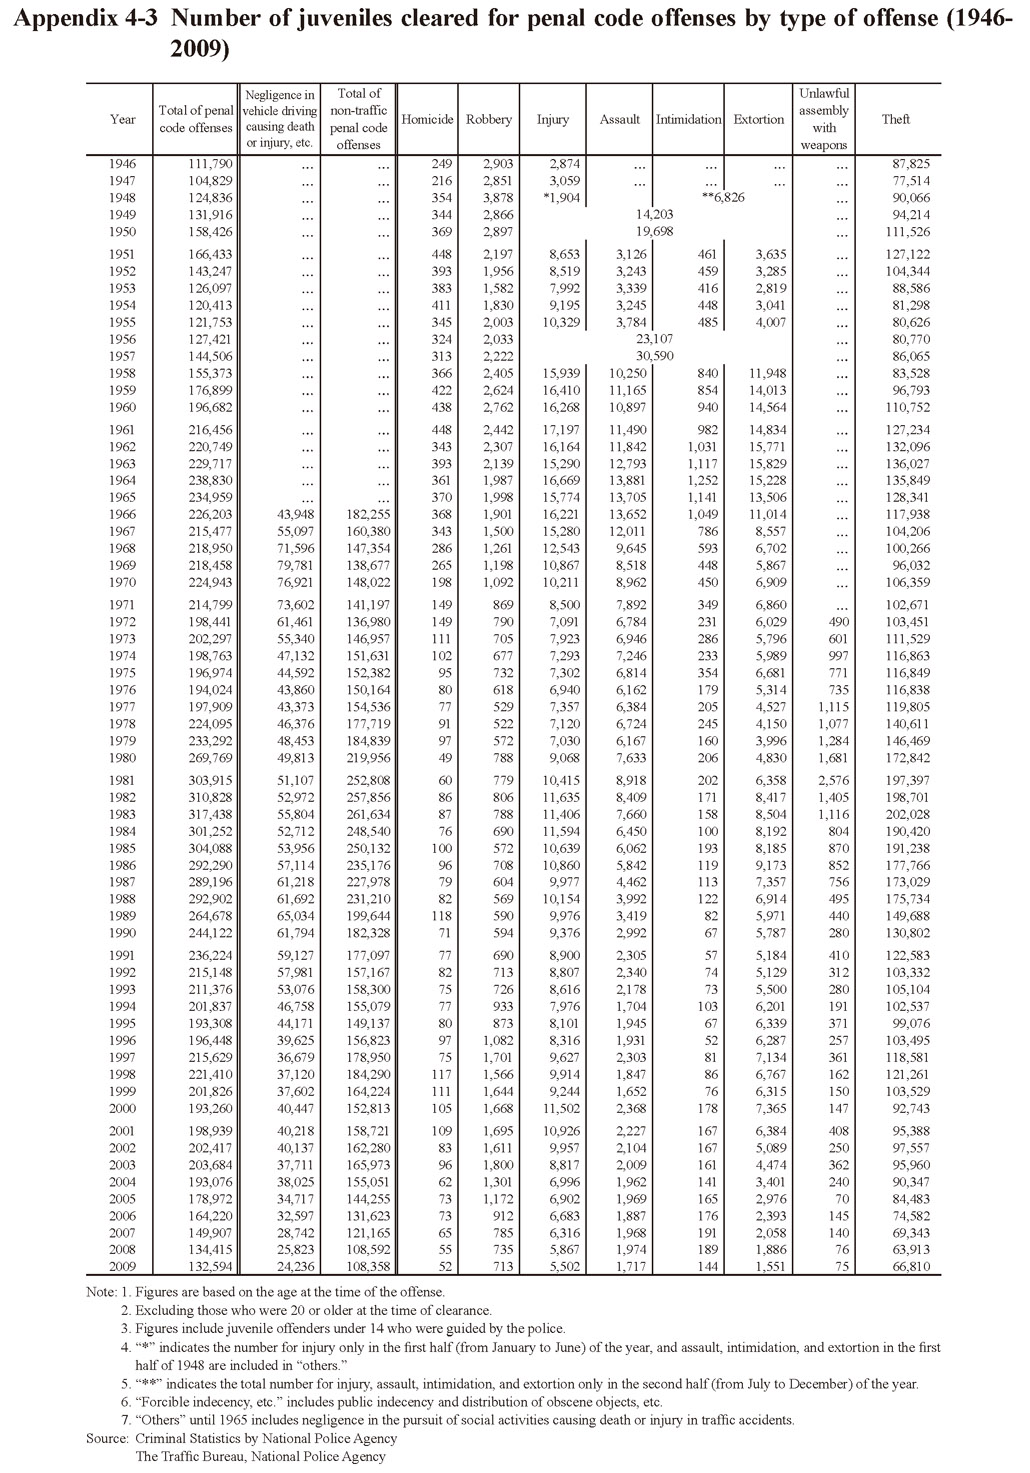 Table 4-3 Number of juveniles cleared for penal code offenses by type of offense (1946-2009)
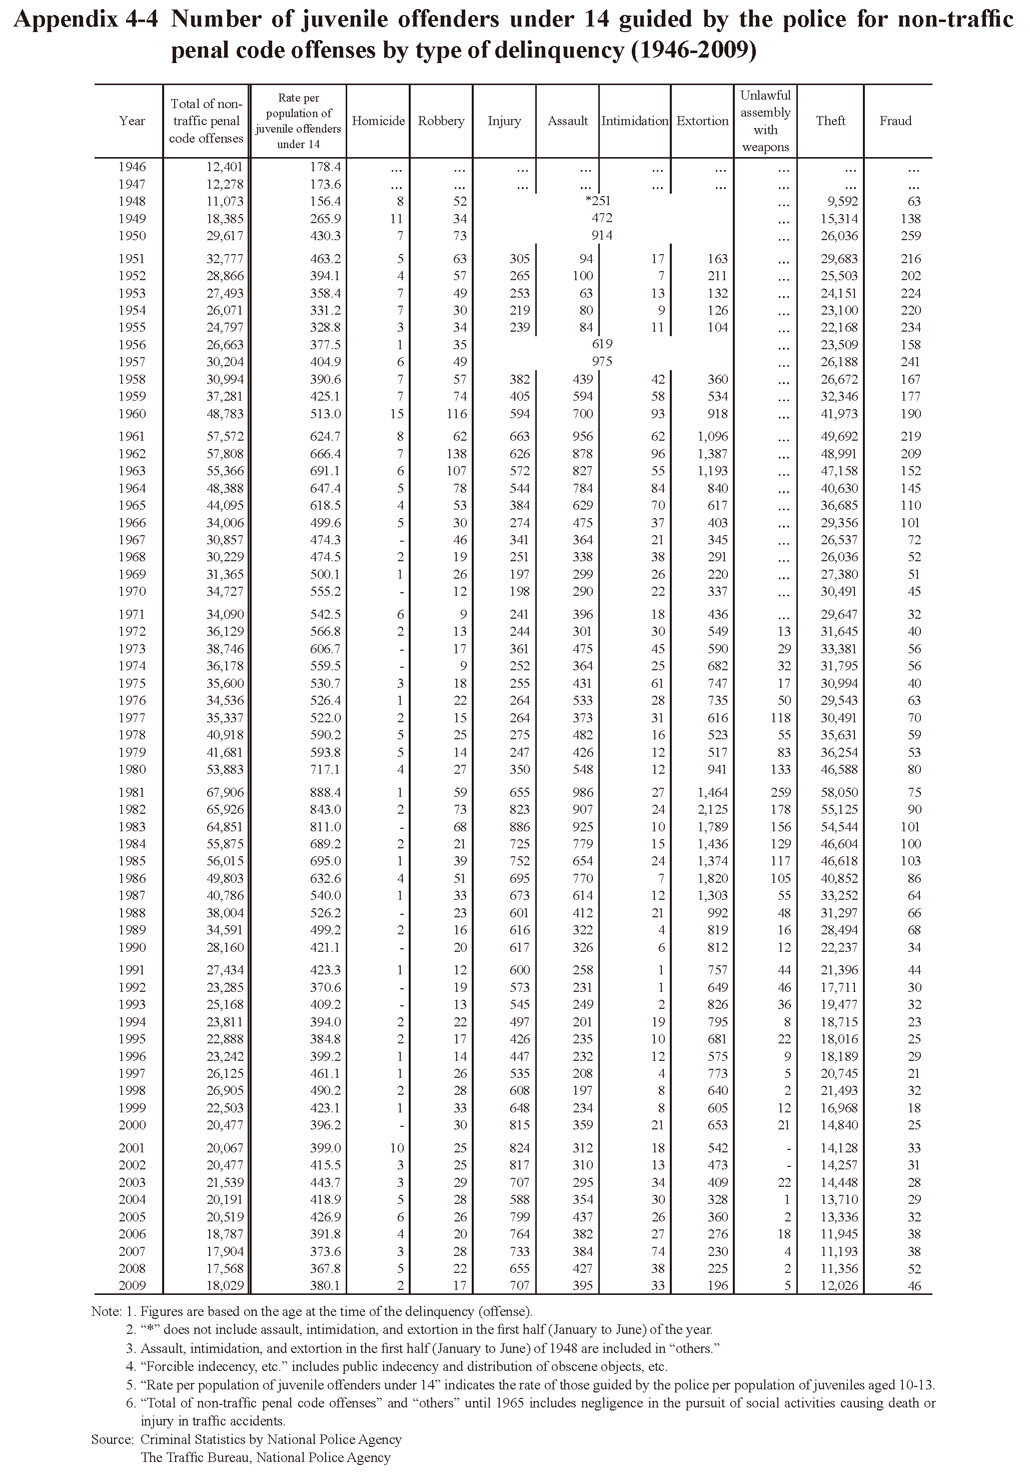
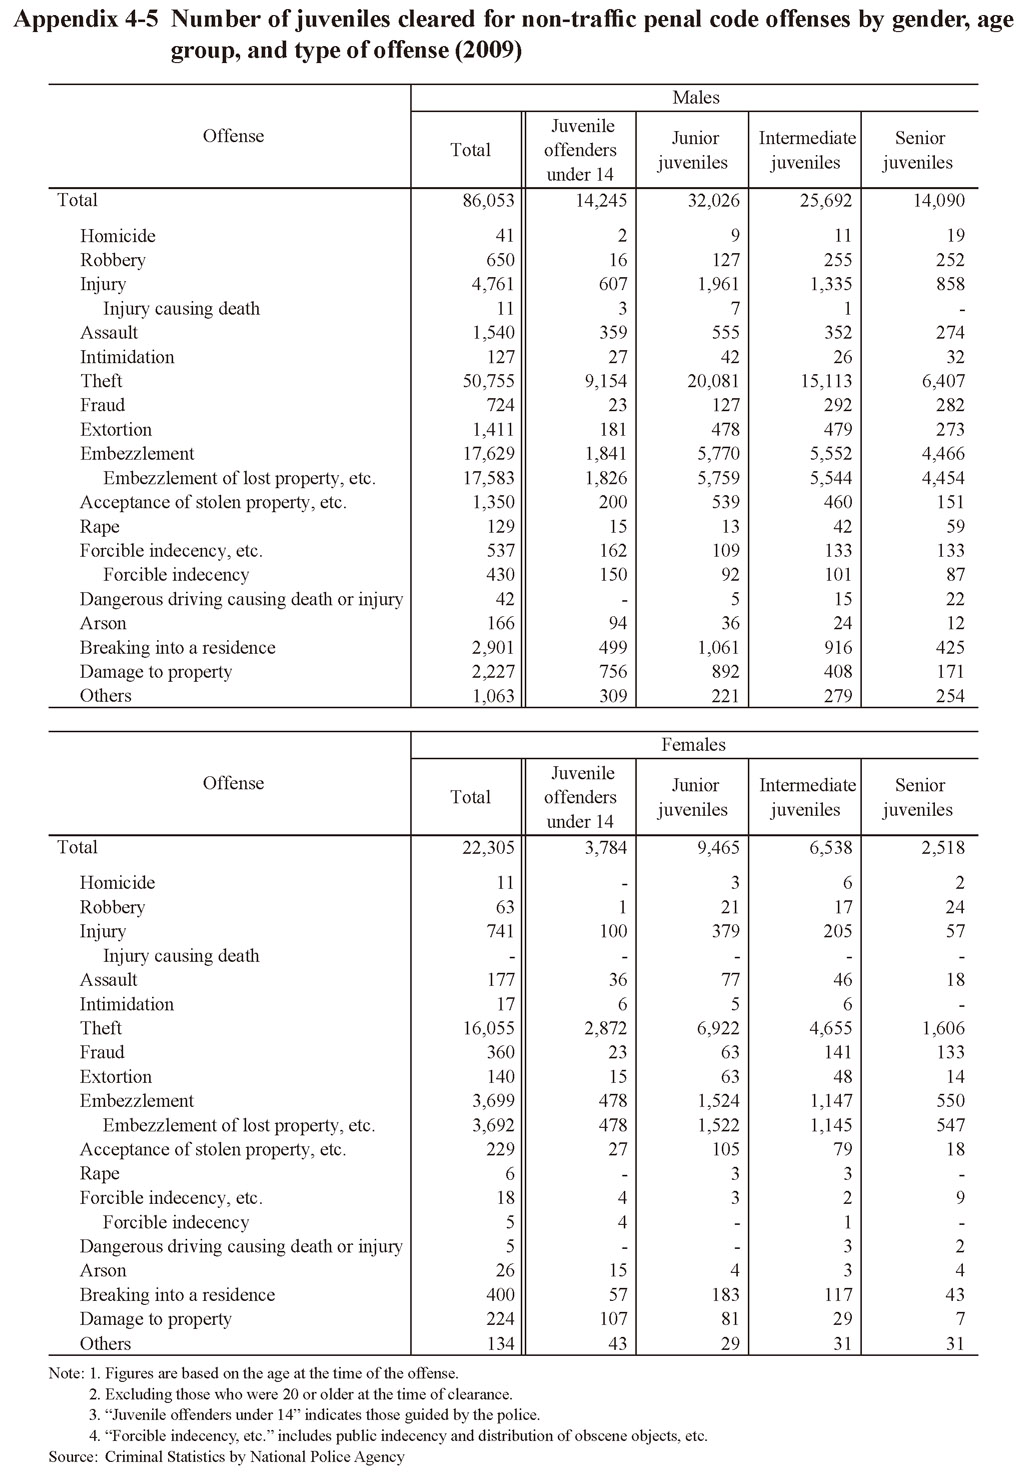
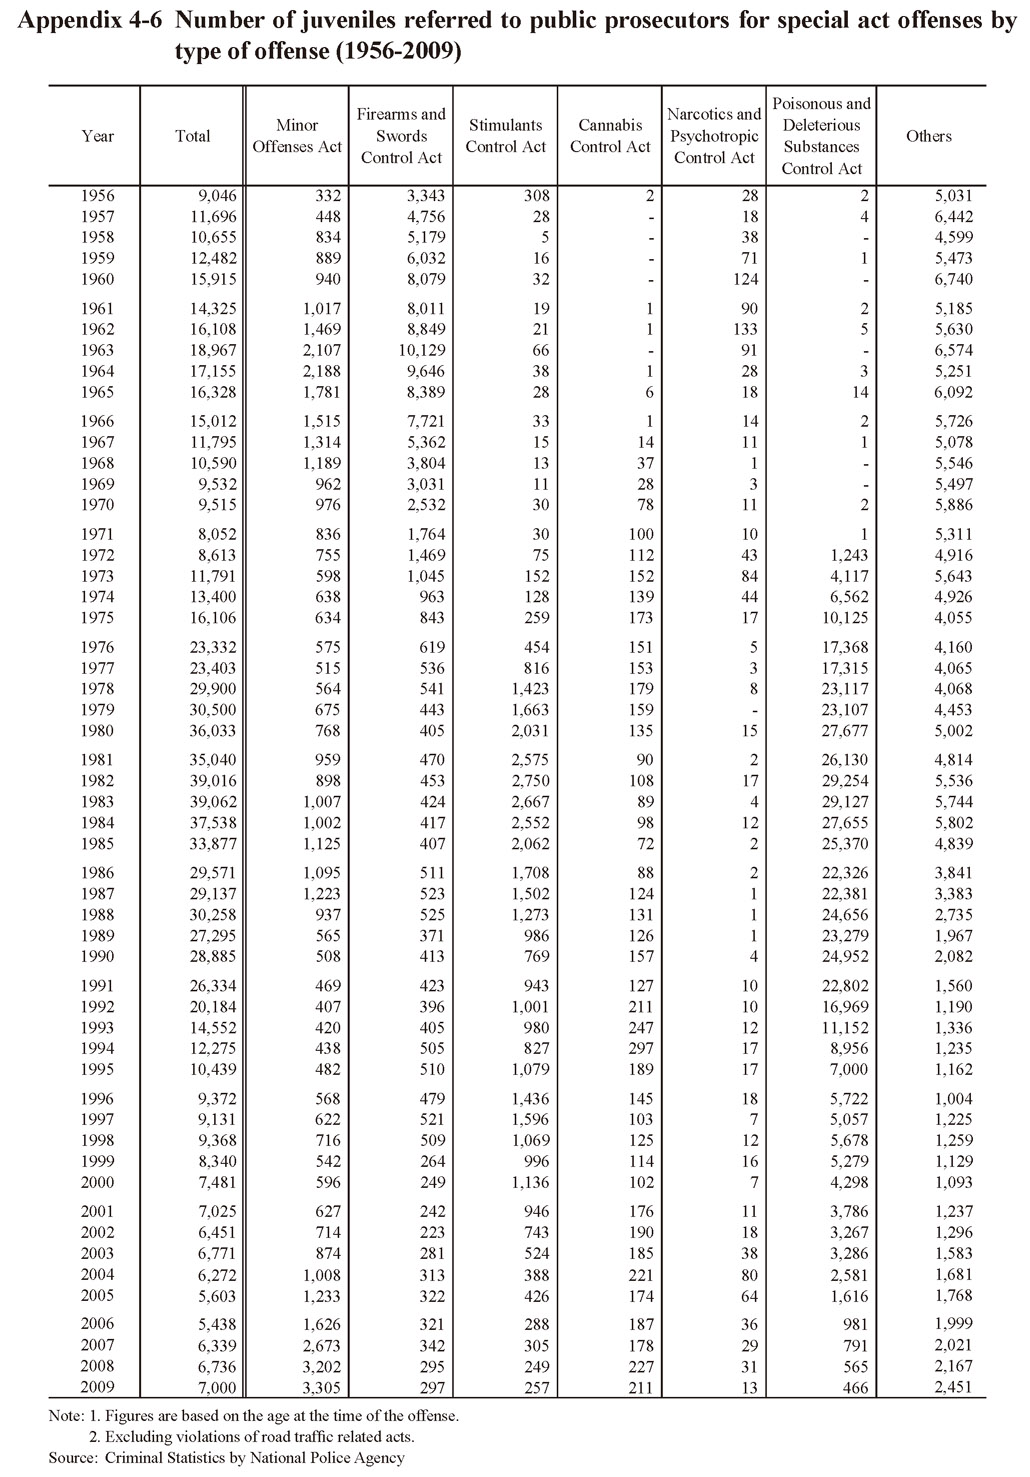
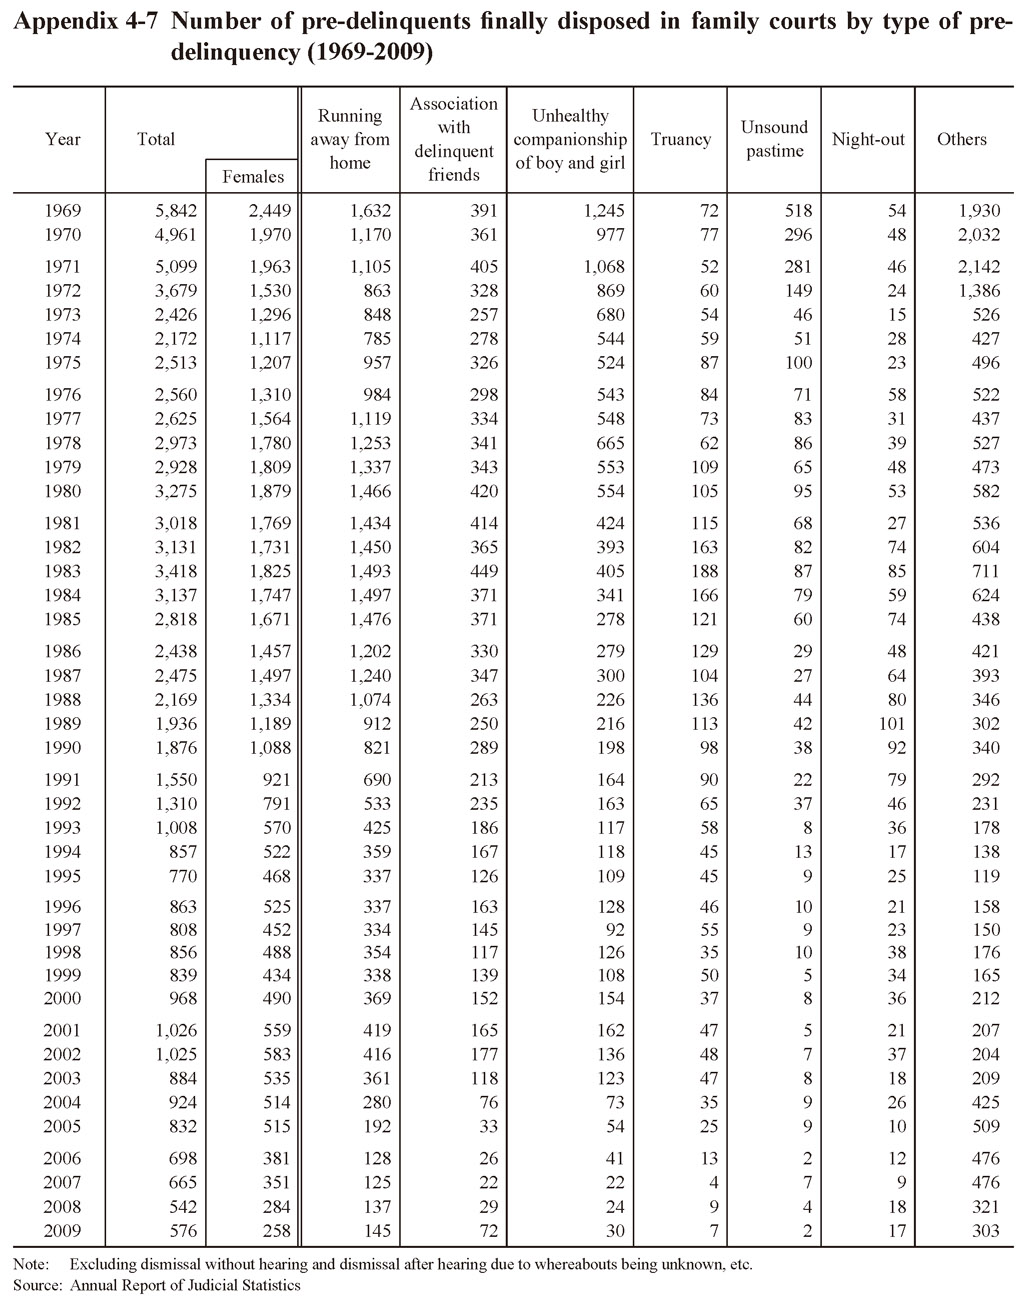
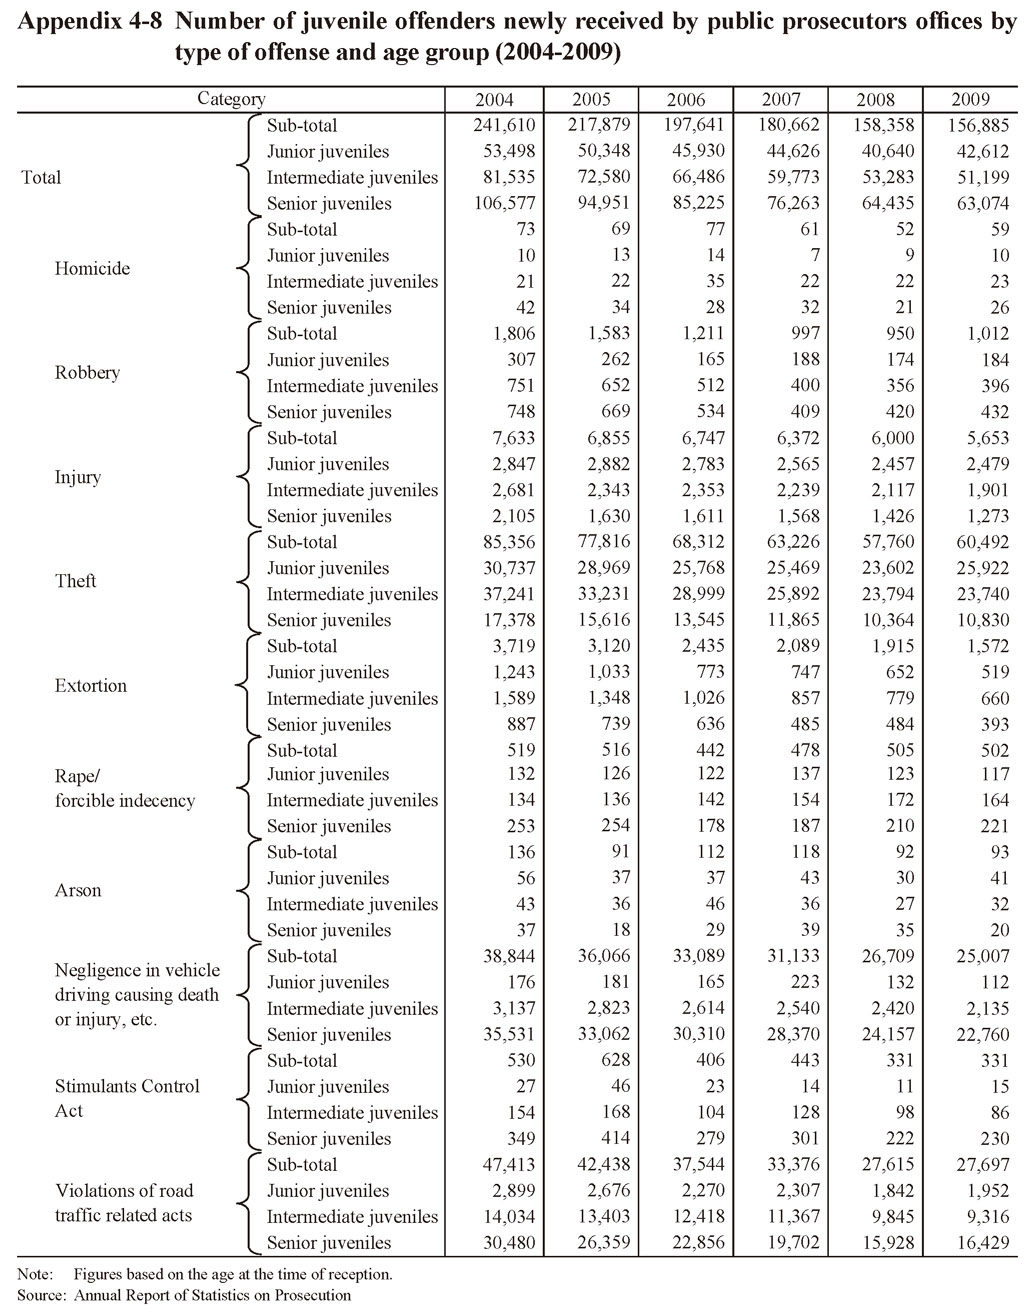

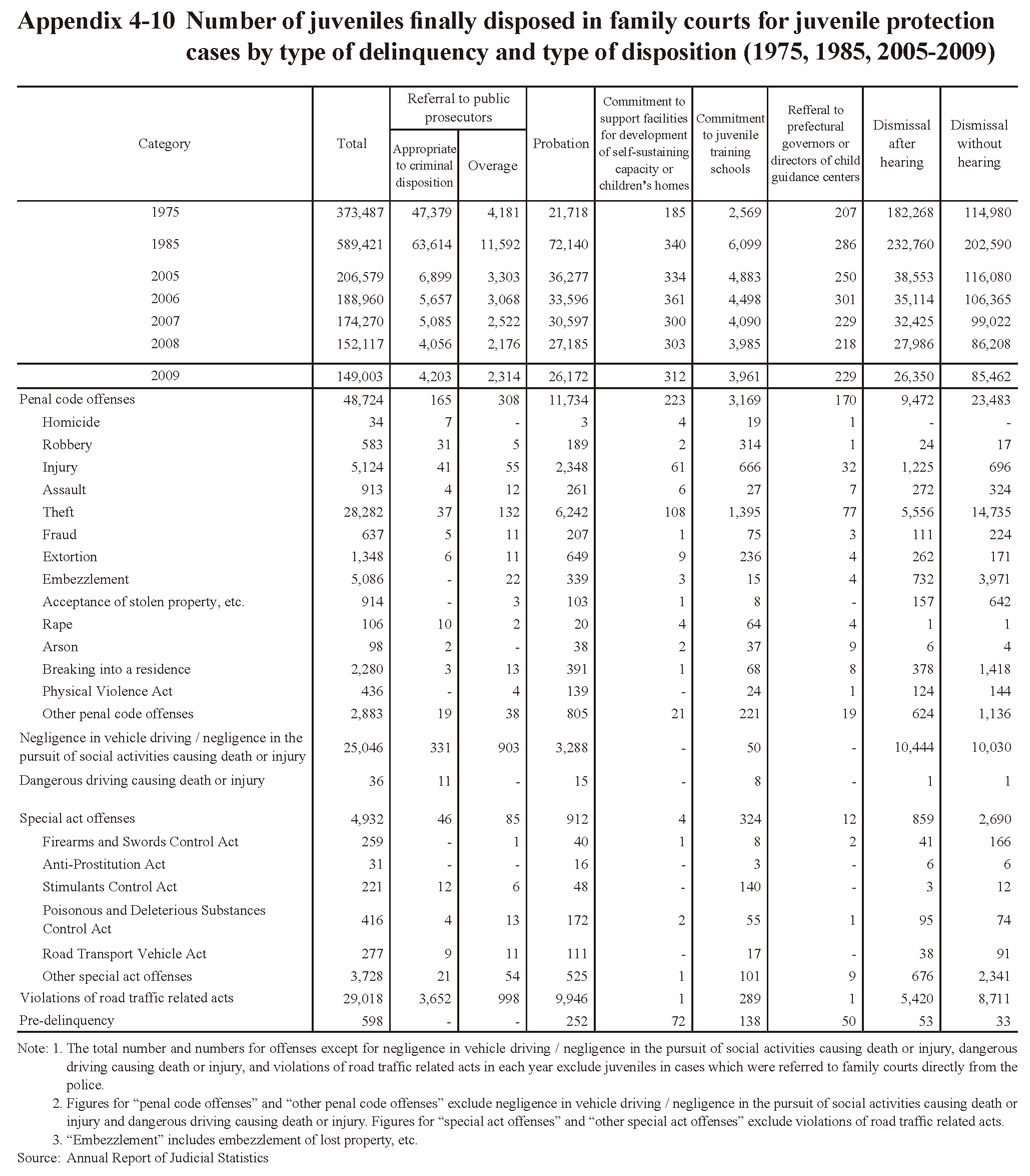
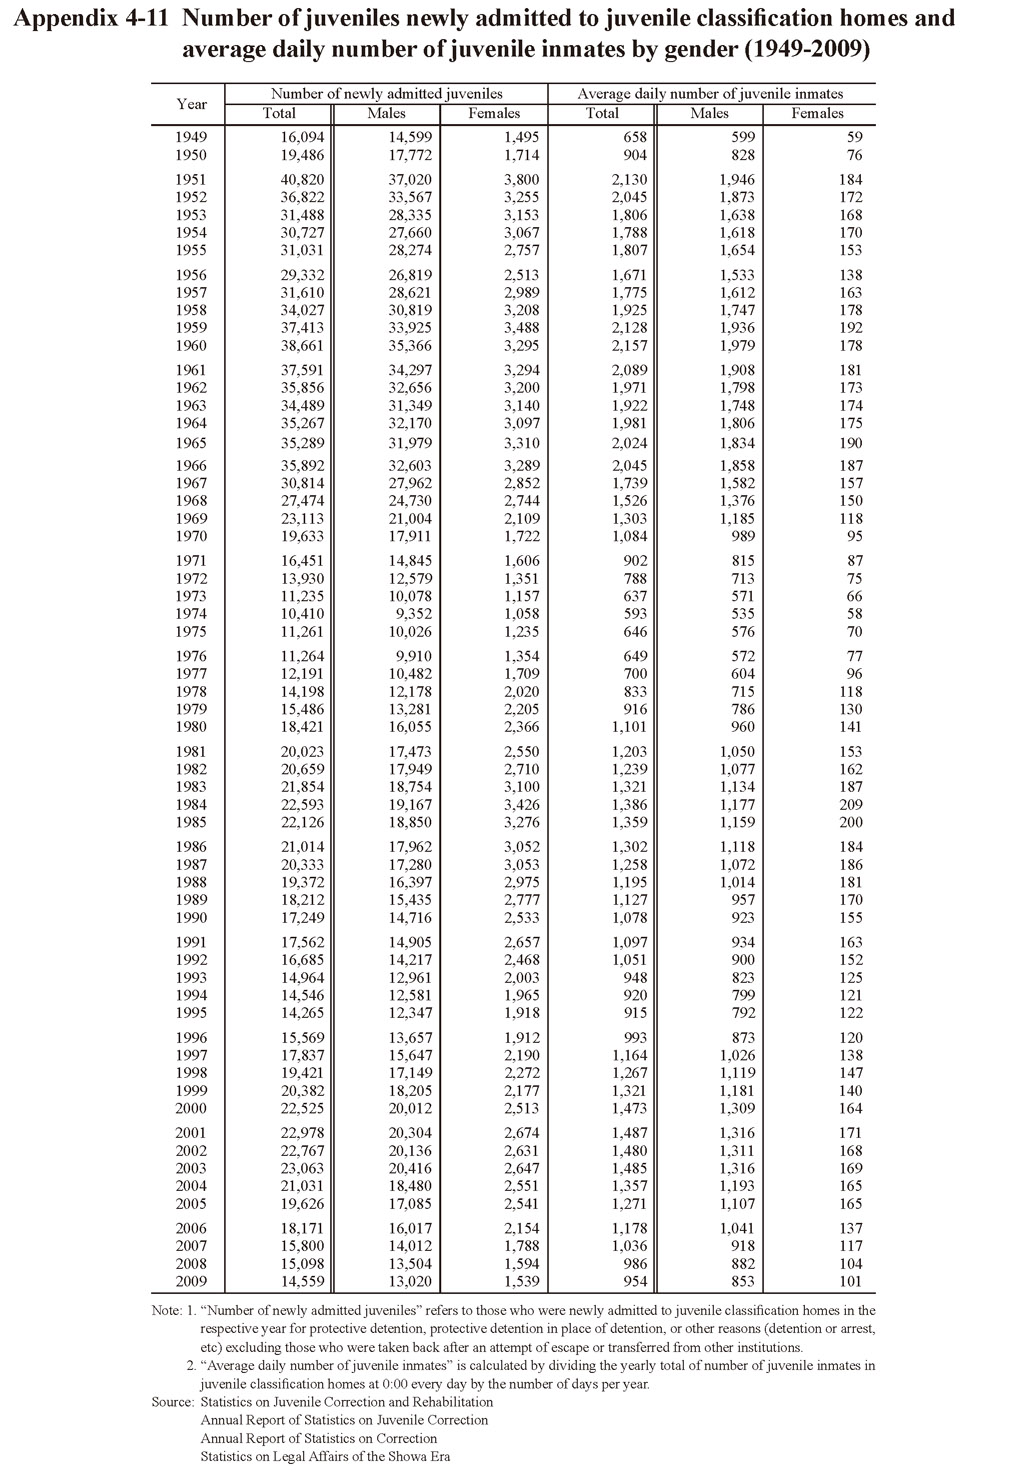
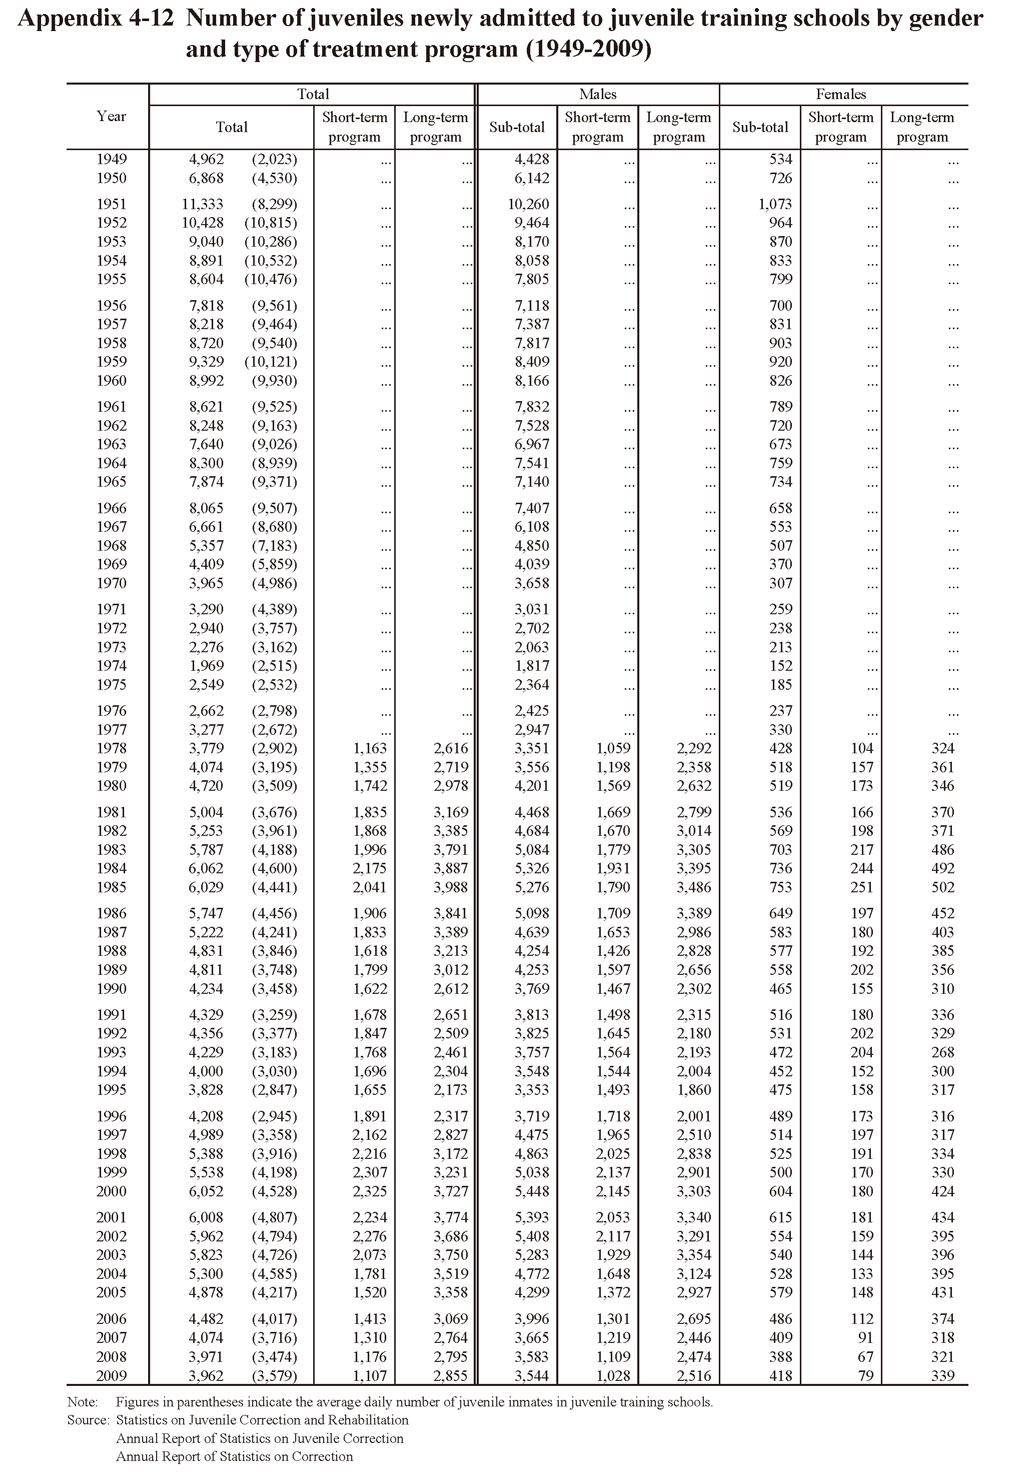
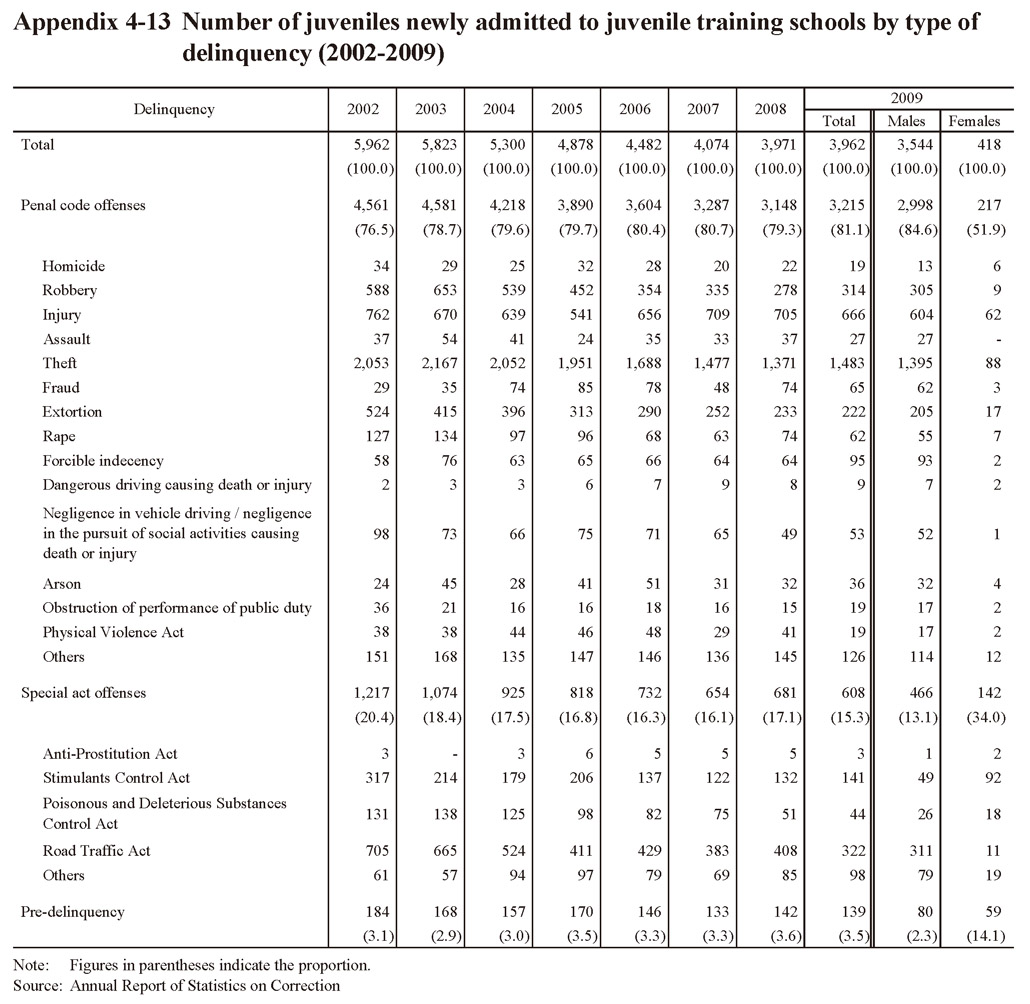
 Table 5-1 Application and payment of crime victim benefits (FY 1998-2009)
 Table 6-1 Chronological Table of “Criminal Justice System Reform”