Section 3 Classification in Juvenile Classification Homes
1 Admission and discharge
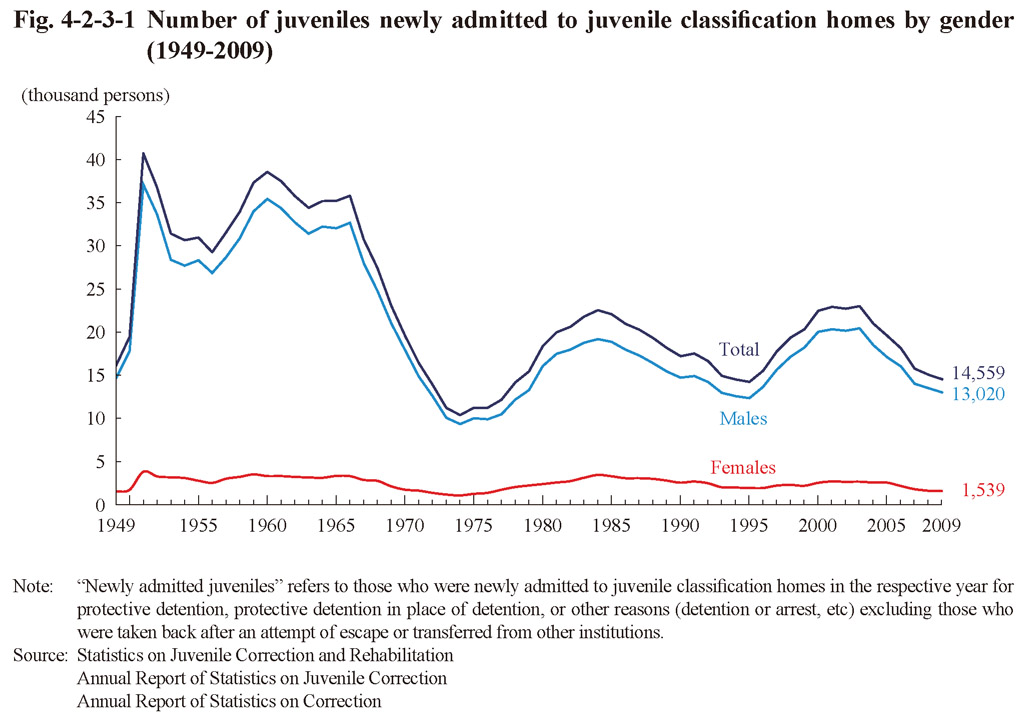
(1) Number of juveniles newly admitted to juvenile classification homes
Fig. 4-2-3-1 shows the number of juveniles newly admitted to juvenile classification homes from 1949 (those newly admitted in the respective year for protective detention, protective detention in place of detention, or other reason (detention, arrest, etc.), being equivalent to the “number of juveniles newly admitted to juvenile classification homes” in the Annual Report of Statistics on Correction). The number increased from 1996, eventually reaching the largest number since 1970 in 2003, but then continued to decrease over the next six consecutive years (See Appendix 4-11). In 2009, 86.0% were admitted for protective detention and 9.8% for protective detention in place of detention (Source: Annual Report of Statistics on Correction).
Fig. 4-2-3-1 Number of juveniles newly admitted to juvenile classification homes by gender (1949-2009)
(2) Characteristics of juveniles detained in juvenile classification homes
Fig. 4-2-3-2 shows the percent distribution of juveniles detained in juvenile classification homes (refers to those newly admitted for protective detention or protective detention in place of detention but not including those who escaped, died or were transferred to other institutions. The number of juvenile inmates was totaled on the year of their discharge, being the equivalent of the “newly admitted juveniles at juvenile classification homes” in the Annual Report of Statistics on Correction; hereinafter the same in this section and Chapter 5), by age group and gender over the last 20 years. Among males the proportion of junior juveniles has generally been on a rising trend while the proportion of senior juveniles on a declining trend. The proportion of those detained at a young age was higher with females than males.
Fig. 4-2-3-2 Percent distribution of juveniles detained in juvenile classification homes by age group and gender (1990-2009)
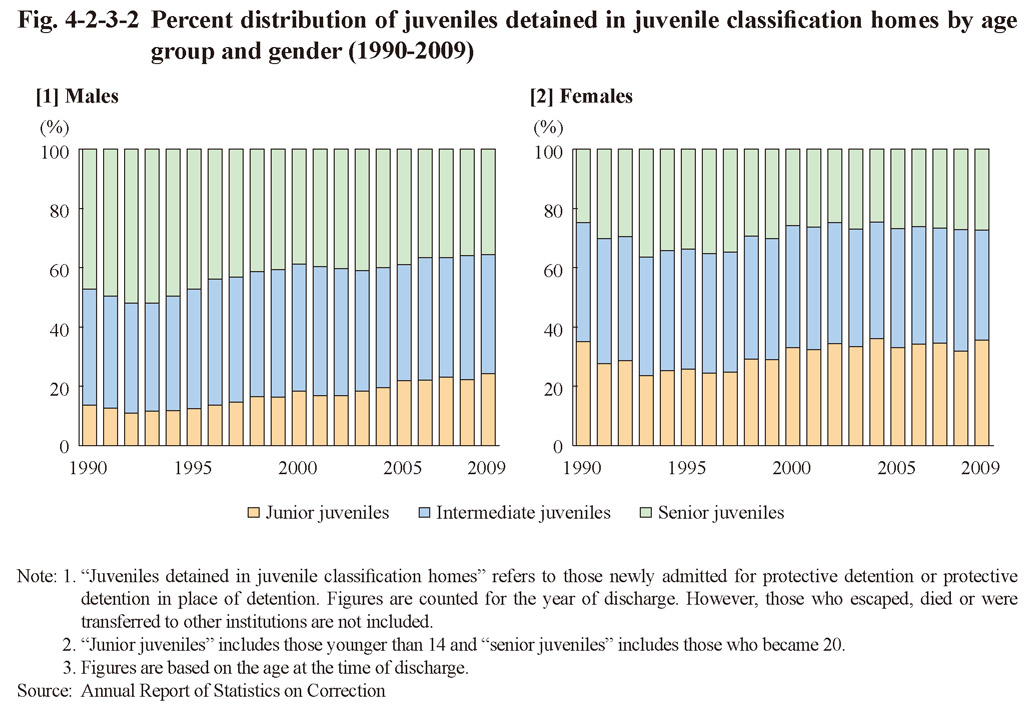
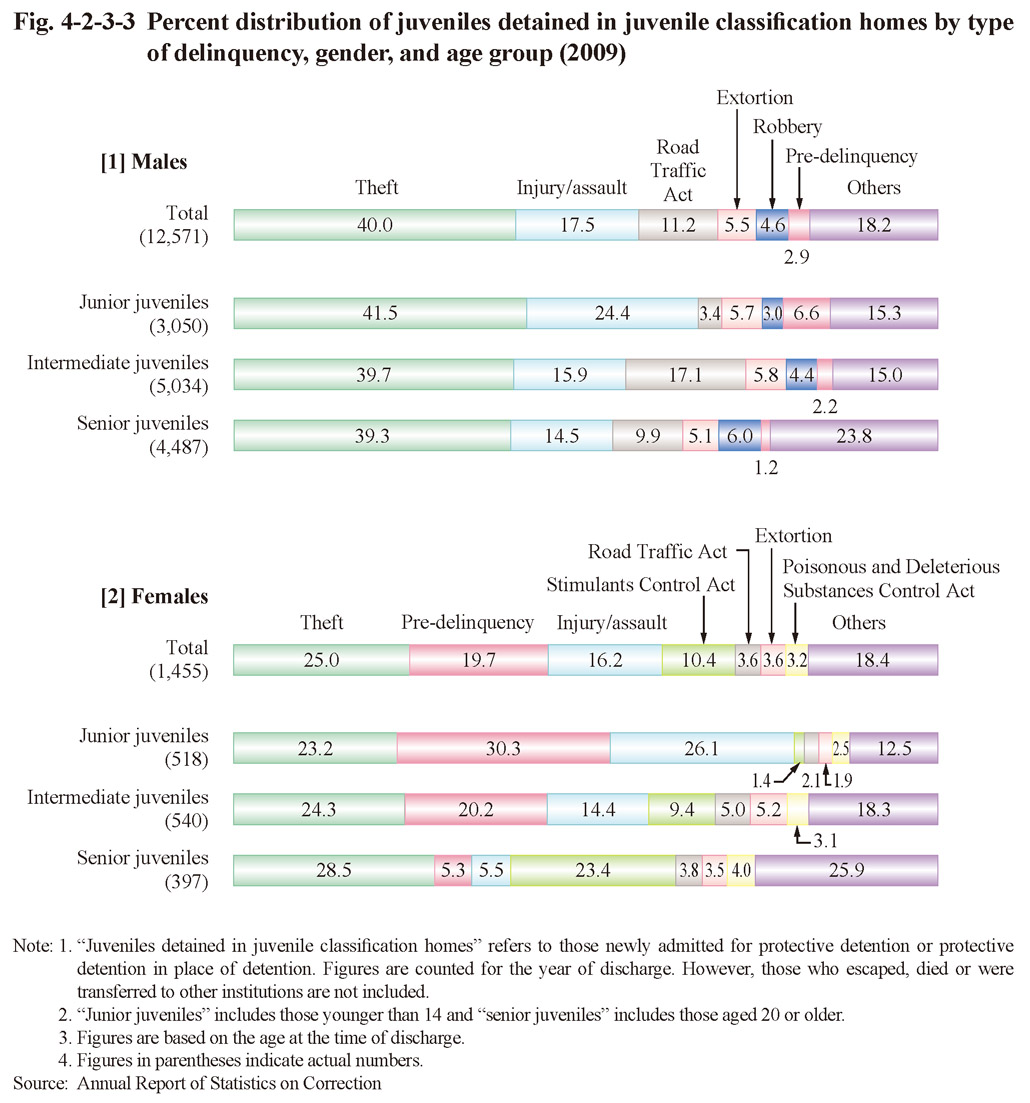
Fig. 4-2-3-3 shows the percent distribution of juveniles detained in juvenile classification homes by type of delinquency, gender, and age group in 2009. For males the proportion for theft was the highest across all age groups, followed by injury/assault, Road Traffic Act violations, and extortion, etc., with the proportion for Stimulants Control Act violations being remarkably low (the highest proportion was 1.3% with senior juveniles). For females the proportion for pre-delinquency and injury/assault declined as the age of the group rose while that of Stimulants Control Act violations rose.
Fig. 4-2-3-3 Percent distribution of juveniles detained in juvenile classification homes by type of delinquency, gender, and age group (2009)
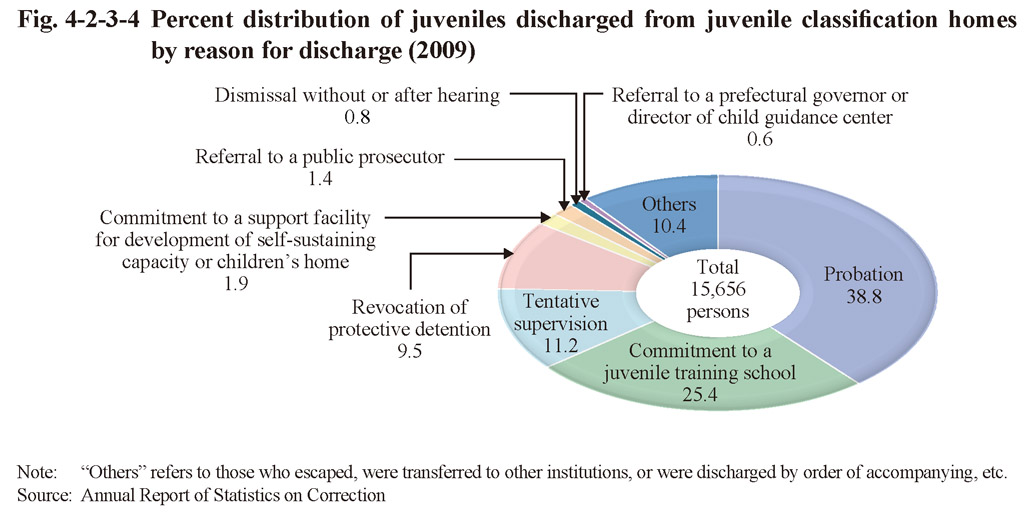
(3) Reason for discharge
Fig. 4-2-3-4 shows the percent distribution of juveniles discharged from juvenile classification homes by reason for discharge in 2009.
Fig. 4-2-3-4 Percent distribution of juveniles discharged from juvenile classification homes by reason for discharge (2009)