1 Juvenile probationers/parolees
(1) Number of juveniles newly placed under probation/parole supervision, etc.
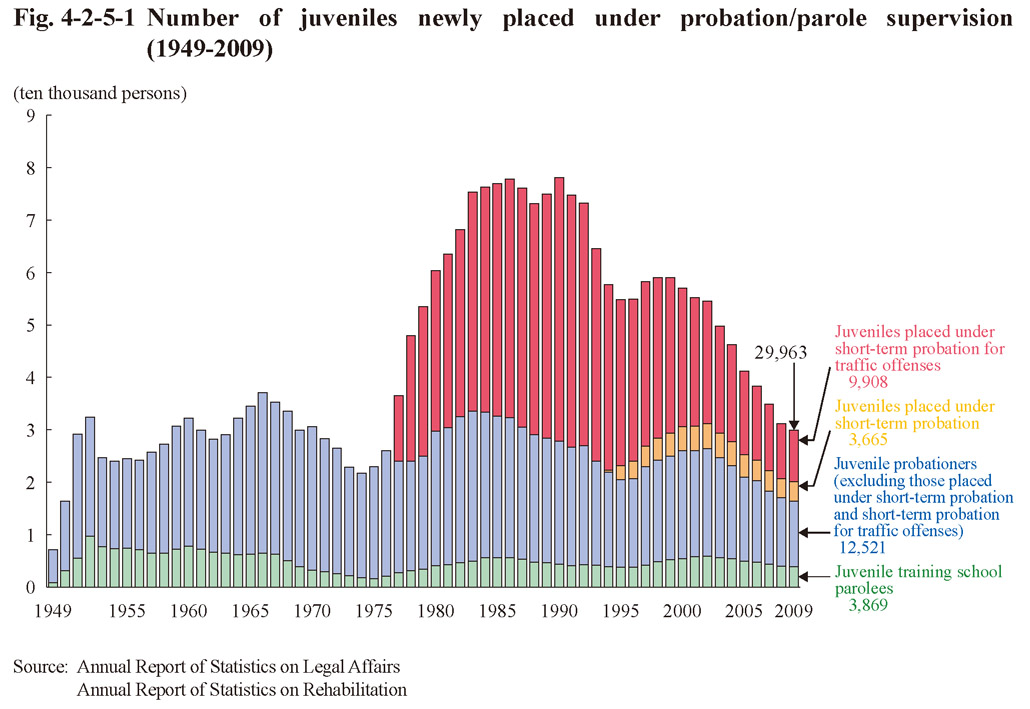
Fig. 4-2-5-1 shows the number of juvenile probationers (refers to those placed under probation in a decision made by a family court; hereinafter the same in this part) and juvenile training school parolees newly placed under probation/parole supervision since 1949. The number of juvenile probationers newly placed under probation reached a record high in 1990 at 73,779, but then turned to a decreasing trend, and was 26,094 (down 4.0% from the previous year) in 2009. The number of juvenile training school parolees newly placed under probation increased from 1997 to 5,848 persons in 2002 but then continued decreasing every year, being 3,869 (down 3.1% (id.)) in 2009 (See Appendix 2-12).
Fig. 4-2-5-1 Number of juveniles newly placed under probation/parole supervision (1949-2009)
(2) Characteristics of juvenile probationers/parolees
a. Age
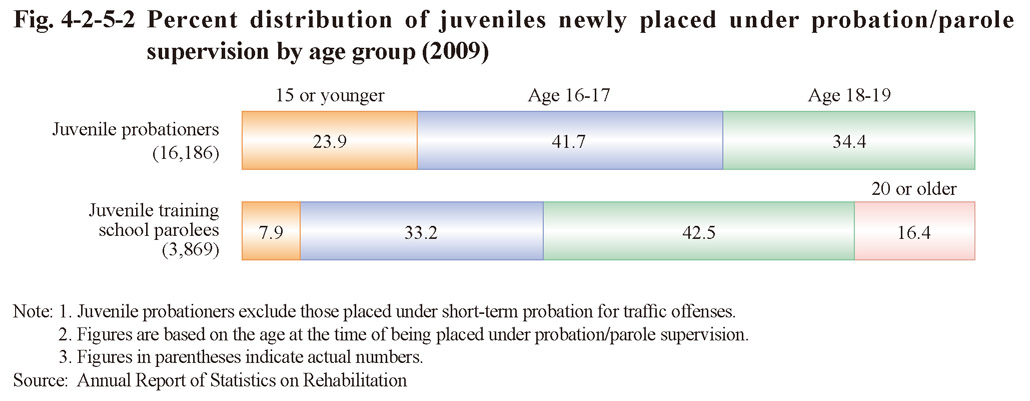
Fig. 4-2-5-2 shows the percent distribution of juvenile probationers (excluding those placed under short-term probation for traffic offenses; hereinafter the same in this part) and juvenile training school parolees newly placed under probation/parole supervision in 2009 by age group.
Fig. 4-2-5-2 Percent distribution of juveniles newly placed under probation/parole supervision by age group (2009)
b. Type of delinquency
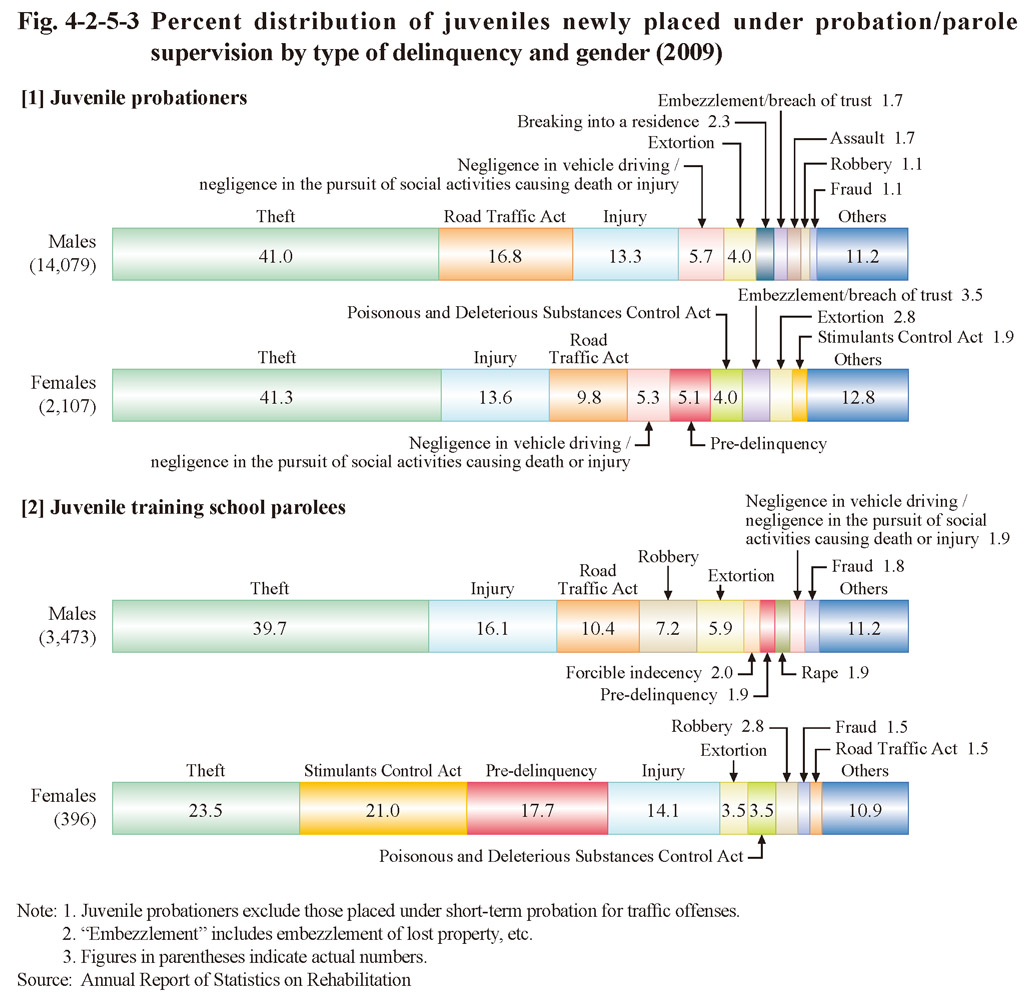
Fig. 4-2-5-3 shows the percent distribution of juveniles newly placed under probation/parole supervision in 2009 by type of delinquency and gender.
Fig. 4-2-5-3 Percent distribution of juveniles newly placed under probation/parole supervision by type of delinquency and gender (2009)
c. Residential status
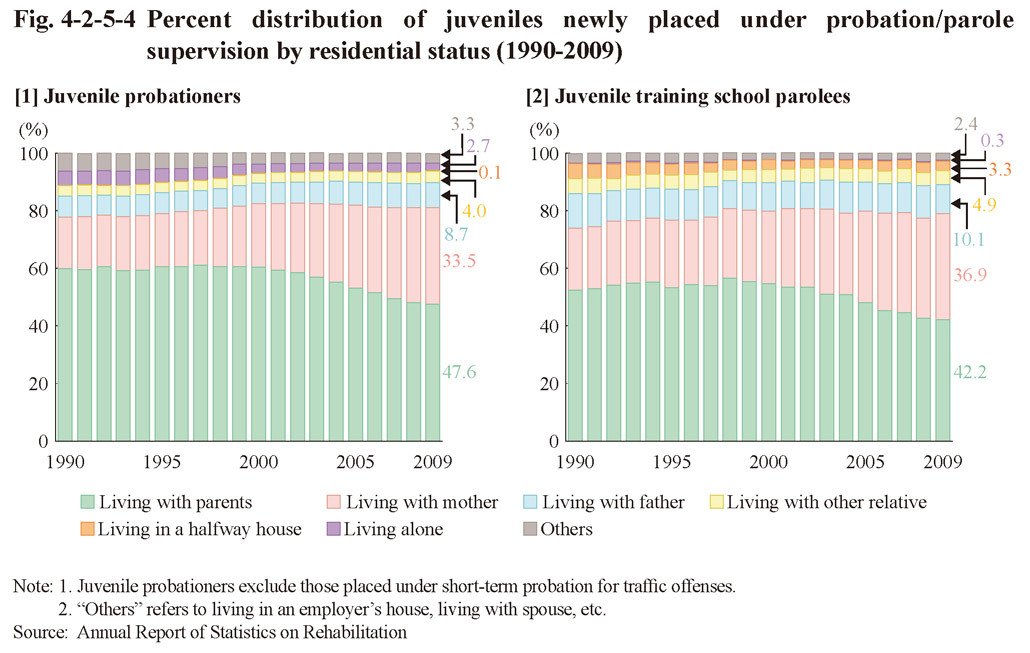
Fig. 4-2-5-4 shows the percent distribution of juveniles newly placed under probation/parole supervision by residential status over the last 20 years. The proportion of “living with their parents” has been declining while that of “living with mother” has been rising with both juvenile probationers and juvenile training school parolees.
Fig. 4-2-5-4 Percent distribution of juveniles newly placed under probation/parole supervision by residential status (1990-2009)
d. Educational/employment status
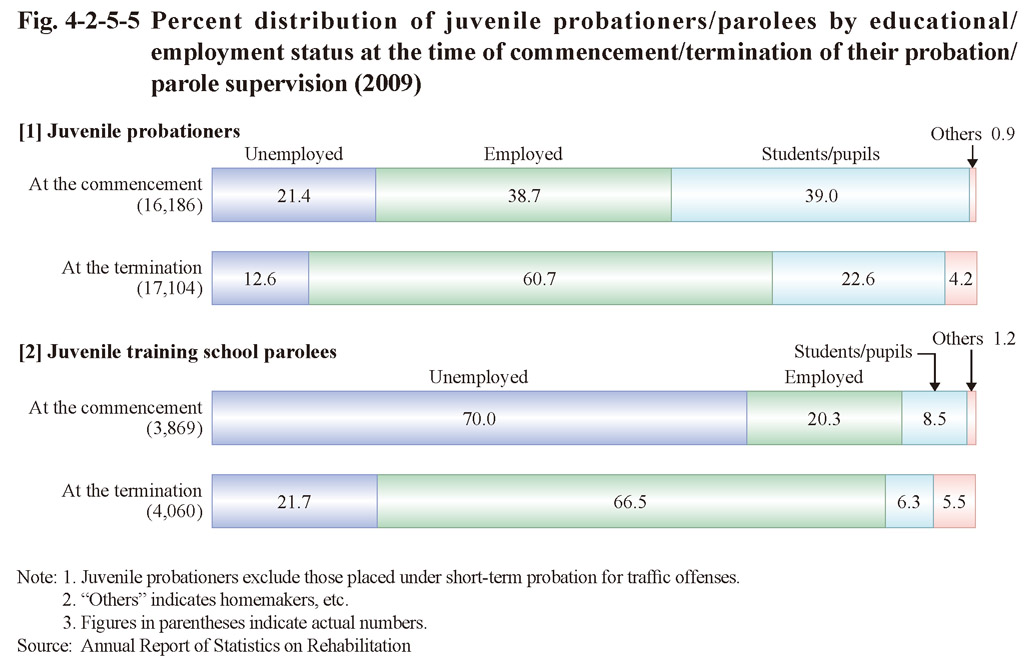
Fig. 4-2-5-5 shows the percent distribution of juvenile probationers and juvenile training school parolees by educational/employment status at the time of commencement/termination of probation/parole supervision in 2009. Although not purely speaking an exact comparison as those whose probation/parole supervision started and those whose probation/parole supervision terminated the same year were not necessarily the same person, the proportion of those employed was higher at the time of termination of their probation/parole supervision than at the time of commencement with both juvenile probationers and juvenile training school parolees. However, 12.6% of all juvenile probationers and 21.7% of all juvenile training school parolees were still unemployed when their probation/parole supervision terminated.
Fig. 4-2-5-5 Percent distribution of juvenile probationers/parolees by educational/ employment status at the time of commencement/termination of their probation/ parole supervision (2009)