Section 2 Bodily Damage
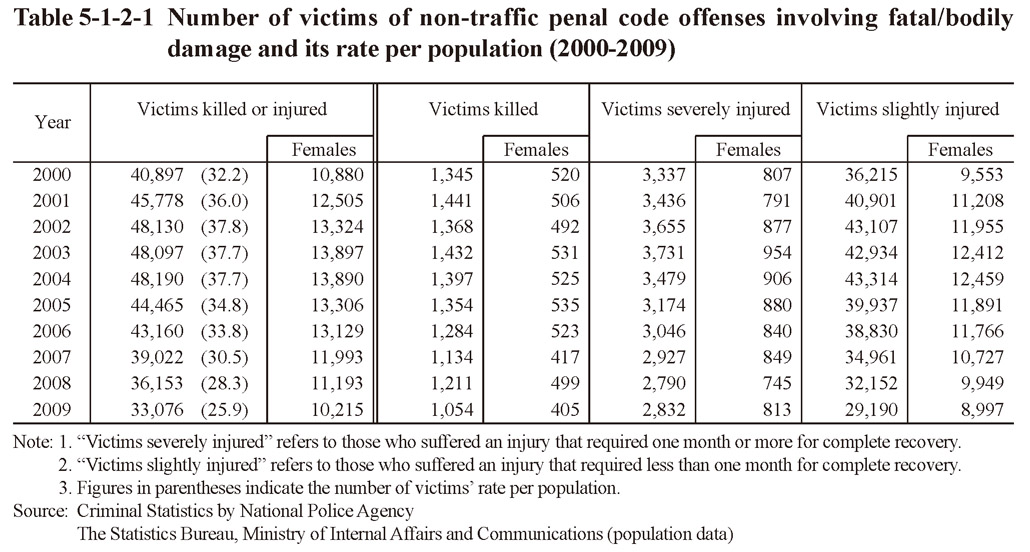
Table 5-1-2-1 shows the number of victims of non-traffic penal code offenses involving fatal/bodily damage and its rate per population over the last 10 years. The number of victims killed/injured was on an increasing trend until 2004 but then decreased over five consecutive years from 2005. The percentage of females of victims killed/injured rose from 26.6% in 2000 to 30.9% in 2009.
Table 5-1-2-1 Number of victims of non-traffic penal code offenses involving fatal/bodily damage and its rate per population (2000-2009)