2 Occupancy rate in penal institutions
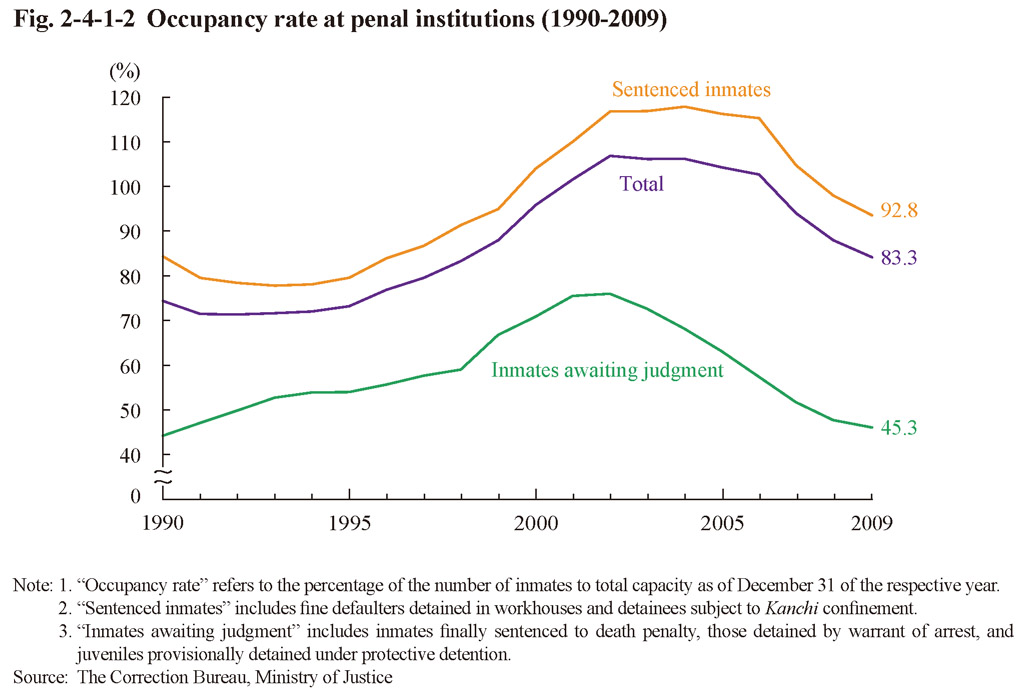
Fig. 2-4-1-2 shows the occupancy rate at penal institutions (percentage of imprisoned persons to total capacity as of the end of the year) over the last 20 years. The occupancy rate rose significantly from 1993 through to 2002, but then started decreasing every year from 2005 on. As of the end of 2009 the occupancy rate was 83.3% (92.8% for sentenced inmates and 45.3% for inmates awaiting judgment) of the total capacity of 90,354 persons (of which the capacity for sentenced inmates was 72,311 persons). 20 (26.0%) of 77 main penal institutions were accommodating more imprisoned persons than their official total capacity (Source: The Correction Bureau, Ministry of Justice). Examining the rate of burden per penal institution official (calculated by dividing the average daily number of persons imprisoned at all the penal institutions by the fixed number of officials) revealed that the rate had significantly risen from 3.04 in 1998 to 4.48 in 2006, still being at the high level of 4.04 in 2009 (Source: The Correction Bureau, Ministry of Justice).
Fig. 2-4-1-2 Occupancy rate at penal institutions (1990-2009)