7 Boryokudan members, etc.
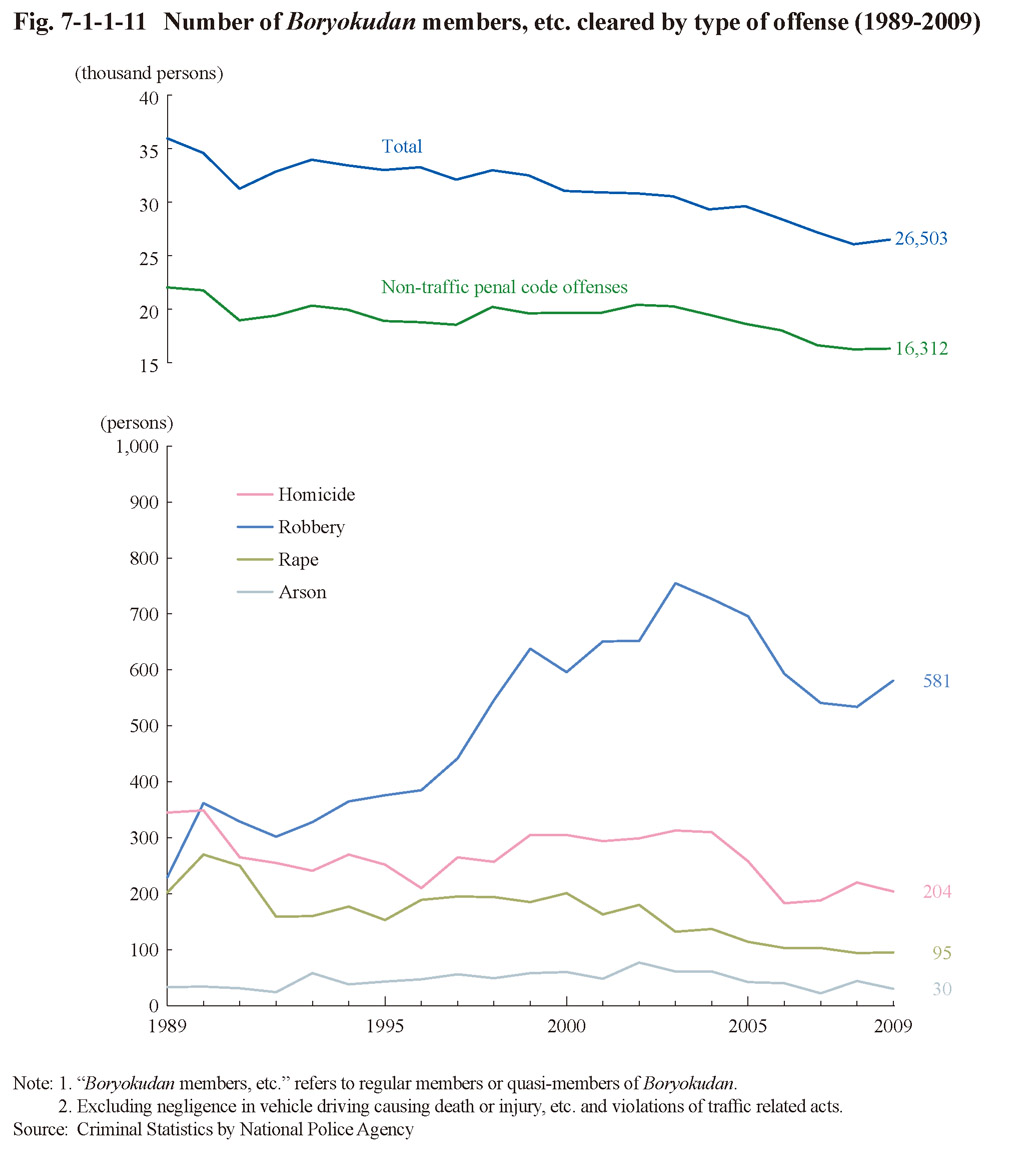
Fig. 7-1-1-11 shows the number of Boryokudan members, etc. (refers to regular members or quasi-members of Boryokudan; hereinafter the same in this subsection) cleared for serious offenses (excluding injury causing death for which statistical data is not available) in and after 1989. The number was on an increasing trend until 2003 for homicide and robbery and until 2000 for rape, but then turned to a decreasing trend. That for robbery, however, has remained at a considerably high level. The percentage of Boryokudan members, etc. to total persons cleared for homicide and robbery was significantly higher than that for non-traffic penal code offenses (See Subsection 1, Section 2, Chapter 2, Part 3).
Fig. 7-1-1-11 Number of Boryokudan members, etc. cleared by type of offense (1989-2009)