2 Non-traffic penal code offenses excluding theft
Fig. 1-1-2-4 shows the number of reported cases, number of cleared cases, and the clearance rate for non-traffic penal code offenses excluding theft over the last 30 years.
The number of reported cases increased rapidly from 2000 on, reaching a post WWII high of 581,463 cases in 2004, but then continued to decrease from 2005 on. In 2009 it was 404,075 (down 41,459 or 9.3% from the previous year).
The number of cleared cases/persons remained stable from 2003 on but then decreased for three consecutive years on and after 2007. In 2009 the number of cleared cases was 183,055 (down 10,849 or 5.6% from the previous year) and the number of cleared persons 157,382 (down 7,980 or 4.8% (id.)) (See also Fig. 1-1-1-1).
The clearance rate for non-traffic penal code offenses excluding theft used to be at around 90%, but then drastically declined from 2000 on. It reached a post WWII low of 37.8% in 2004 but then started to rise again from 2005 before remaining stable at around 43%. In 2009 it was 45.3% (up 1.8 points from the previous year).
Fig. 1-1-2-4 Number of reported/cleared cases and clearance rate for non-traffic penal code offenses excluding theft (1980-2009)
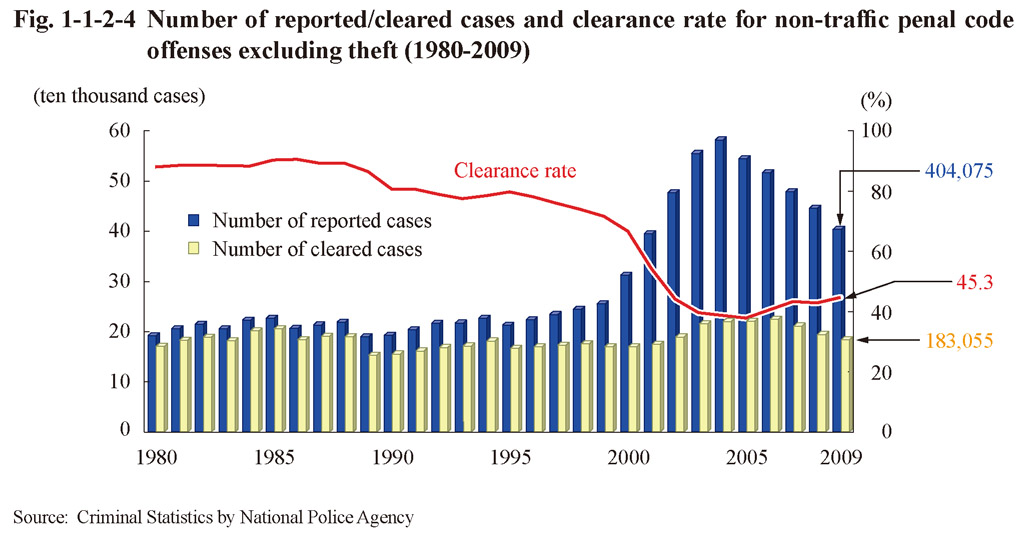
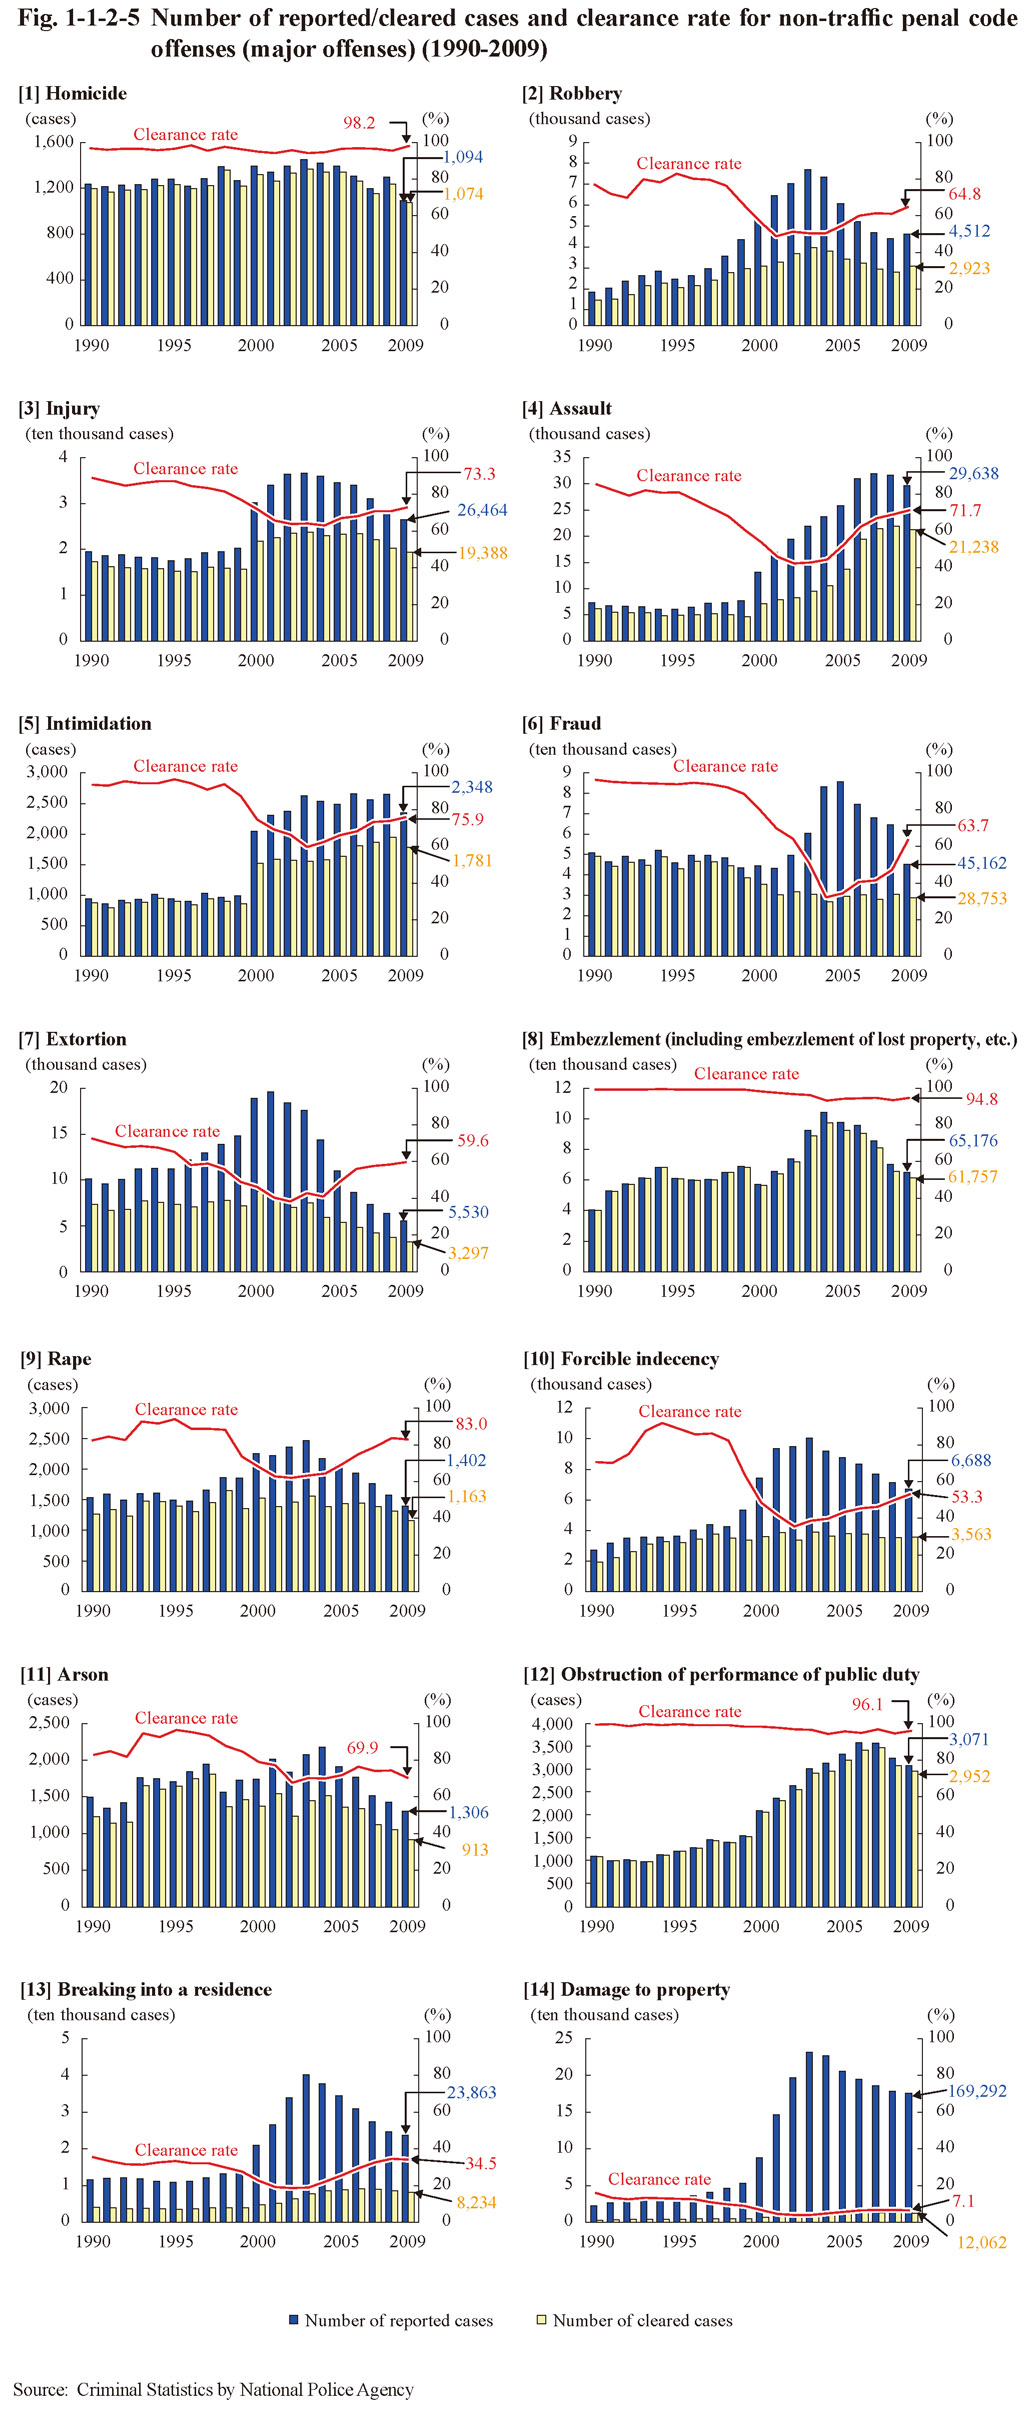
Fig. 1-1-2-5 shows the number of reported cases, number of cleared cases, and clearance rate for major offenses over the last 20 years (See Appendices 1-2 and 1-3). See the Appendices for the number of reported cases, etc. for acceptance of stolen property, etc., public indecency, distribution of obscene objects, etc., kidnapping/buying or selling of human beings, counterfeit of currency, counterfeit of documents, etc., and gambling and lotteries, and the number of cleared cases involving females and juveniles, etc.
Fig. 1-1-2-5 Number of reported/cleared cases and clearance rate for non-traffic penal code offenses (major offenses) (1990-2009)
(1) Homicide (See Fig. 1-1-2-5 [1])
Although the number of reported cases for homicide has generally remained stable it did constantly slightly decrease from 2004 through to 2007 before then slightly increasing in 2008. It decreased again in 2009 to 1,094 cases (down 203 or 15.7% from the previous year). The clearance rate for homicide has remained steady at a high level (98.2% in 2009).
(2) Robbery (See Fig. 1-1-2-5 [2])
The number of reported cases for robbery reached 7,664 in 2003, a record high since 1950, but then decreased for five consecutive years from 2004 on. It slightly increased to 4,512 cases (up 234 or 5.5% from the previous year) in 2009. The clearance rate continued to rise from 2005 on and was 64.8% (up 3.7 points (id.)) in 2009.
(3) Injury/assault/intimidation (See Fig. 1-1-2-5 [3]-[5])
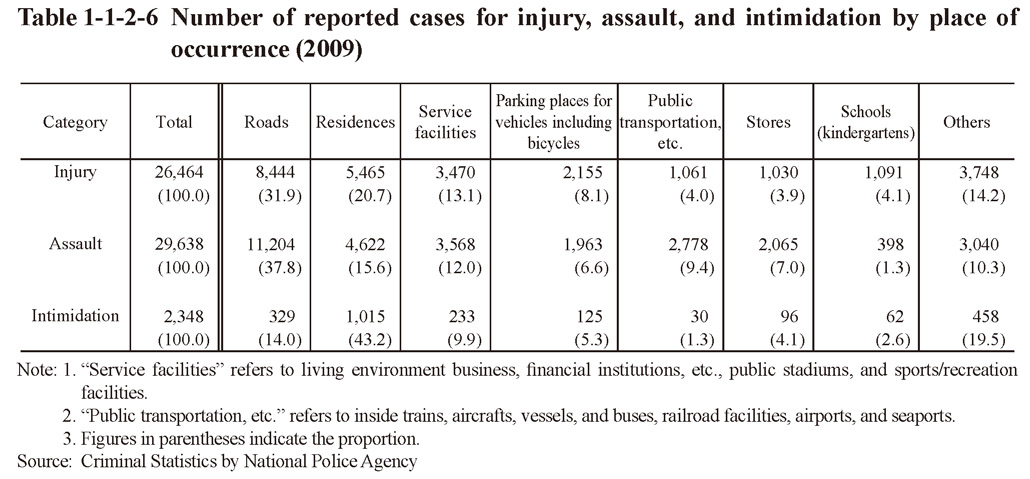
The number of reported cases for injury, assault, and intimidation all sharply increased in 2000. The number of reported cases for injury subsequently continued to increase and reached the highest since 1975 at 36,568 in 2003, but then decreased every year from 2004 on to be 26,464 in 2009 (down 1,827 or 6.5% from the previous year). The number of reported cases for assault continued to increase until 2007, but then slightly decreased from 2008 on and was 29,638 (down 2,003 or 6.3% (id.)) in 2009. The number of reported cases for intimidation was generally on an increasing trend until 2008, but decreased to 2,348 (down 303 or 11.4% (id.)) in 2009. The clearance rates for these offenses all significantly declined due to the sharp increase in number of reported cases, but then turned to a rising trend from around 2004 on.
Table 1-1-2-6 shows the number of reported cases for injury, assault, and intimidation by place of occurrence in 2009.
Table 1-1-2-6 Number of reported cases for injury, assault, and intimidation by place of occurrence (2009)
(4) Fraud (See Fig. 1-1-2-5 [6])
The number of reported cases for fraud increased significantly from 2002 on, reaching a record high since 1960 with 85,596 cases in 2005. It then turned to a decreasing trend from 2006 on and was 45,162 (down 19,265 or 29.9% from the previous year) in 2009. The clearance rate continued to drastically decline from 1997 on, reaching a post WWII low of 32.1% in 2004, but then turned to a rising trend from 2005 on, and was 63.7% (up 16.7 points (id.)) in 2009.
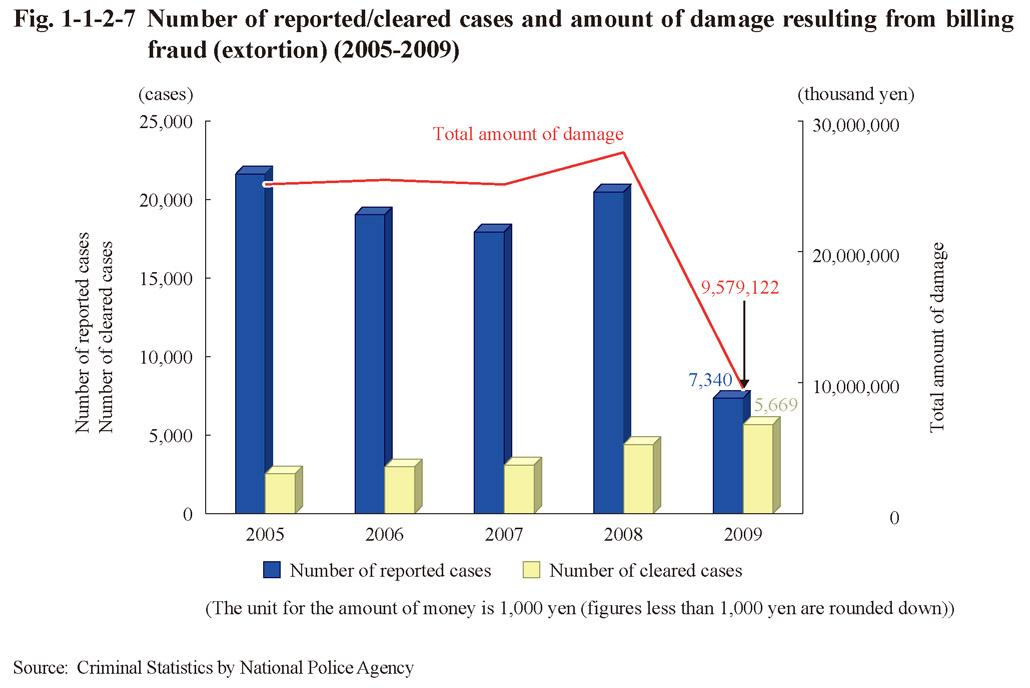
One of the major factors in the recent sharp increase in number of reported cases for fraud is the frequent occurrence of billing fraud. Fig. 1-1-2-7 shows the number of reported/cleared cases and amount of damage resulting from billing fraud (extortion) over the last five years. In 2009 the number of reported cases and amount of damage both significantly decreased (down 64.2% and 65.3%, respectively, from the previous year) whereas the number of cleared cases increased (up 28.8% (id.)), with the clearance rate therefore significantly risen. Various measures, including the “Action Plan to Wipe out Billing Fraud” that was published in July 2008, etc., are considered to have had a positive effect on these results, and thus will need to continue to be implemented in the future too.
Fig. 1-1-2-7 Number of reported/cleared cases and amount of damage resulting from billing fraud (extortion) (2005-2009)
(5) Rape (See Fig. 1-1-2-5 [9])
The number of reported cases for rape was on an increasing trend from 1997 on and reached the largest number in the last 20 years in 2003 at 2,472 cases. However, it then started decreasing on and after 2004 and was 1,402 (down 180 or 11.4% from the previous year) in 2009. The clearance rate consistently declined from 1998 on, reaching a post WWII low of 62.3% in 2002, but then turned to a rising trend from 2003 on, and was 83.0% (down 0.9 points (id.)) in 2009.
(6) Forcible indecency (See Fig. 1-1-2-5 [10])
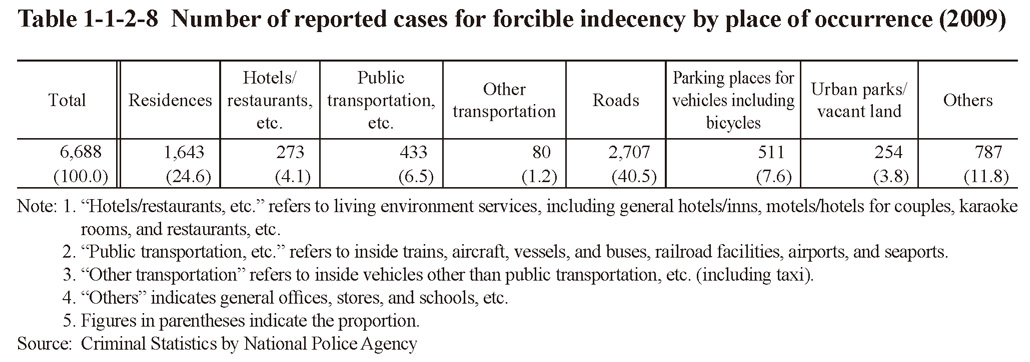
The number of reported cases for forcible indecency increased sharply from 1999 on, reaching a post WWII high of 10,029 cases in 2003, but has been decreasing since 2004 and was 6,688 (down 423 or 5.9% from the previous year) in 2009. The clearance rate drastically declined from 1999 on, reaching a post WWII low of 35.5% in 2002, but then turned to a rising trend from 2003 on, and was 53.3% (up 3.3 points (id.)) in 2009.
Table 1-1-2-8 shows the number of reported cases for forcible indecency by place of occurrence in 2009.
Table 1-1-2-8 Number of reported cases for forcible indecency by place of occurrence (2009)
(7) Obstruction of performance of public duty (See Fig. 1-1-2-5 [12])
The number of reported cases for obstruction of performance of public duty has naturally remained at basically the same level as the number of cleared cases. It was on a significant upward trend from 1994 on, reaching a post WWII high of 3,576 cases in 2006, but then started decreasing from 2007 on, and was 3,071 (down 168 or 5.2% from the previous year) in 2009.
(8) Damage to property (See Fig. 1-1-2-5 [14])
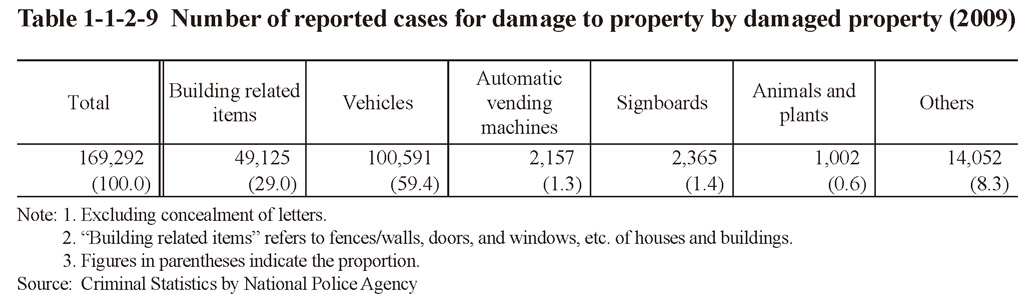
The number of reported cases for damage to property significantly increased from 2000 on, reaching 230,743 cases in 2003. It then continued decreasing from 2004 on, and was 169,292 (down 8,899 or 5.0% from the previous year) in 2009. The clearance rate was generally on a declining trend until 2003 when it then turned to a slight rising trend from 2004 on, and was 7.1% in 2009. It has remained low compared to total non-traffic penal code offenses.
Table 1-1-2-9 shows the number of reported cases for damage to property by damaged property in 2009.
Table 1-1-2-9 Number of reported cases for damage to property by damaged property (2009)
(9) Acceptance of bribe, etc.
Table 1-1-2-10 shows the number of persons newly received and finally disposed in public prosecutors offices for acceptance of bribe in 2009.
Table 1-1-2-10 Number of persons newly received and finally disposed in public prosecutors offices for acceptance of bribe (2009)
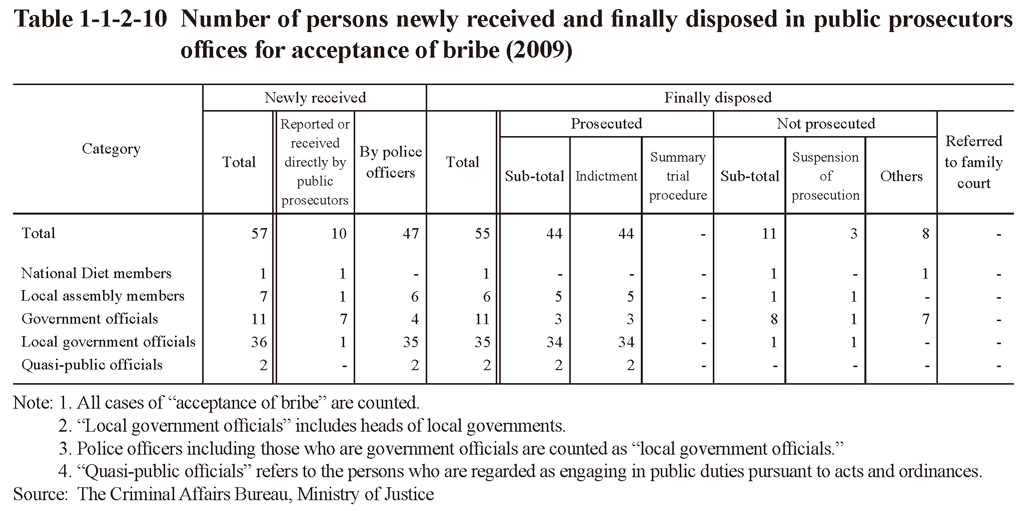
Table 1-1-2-11 shows the number of public officials newly received and finally disposed in public prosecutors offices by type of offense in 2009. Examining the number of persons newly received by type of offense revealed that 81.3% of the total was cleared for negligence in vehicle driving causing death or injury, etc.
Table 1-1-2-11 Number of public officials newly received and finally disposed in public prosecutors offices by type of offense (2009)

(10) Organized crime
Fig. 1-1-2-12 shows the number of persons newly received by public prosecutors offices for Anti-Organized Crime Act violations and the amount of money confiscated/collected in a court of first instance over the last nine years. The number of persons newly received has been on an increasing trend since enforcement of the said Act in 2000. It increased by 215 from the previous year to 758 in 2009. The amount of money confiscated/collected remained within the range of between 0.5 and 2 billion yen from 2004 on, but sharply increased to approximately 5 billion yen in 2009.
Fig. 1-1-2-12 Number of persons newly received by public prosecutors offices for Anti-Organized Crime Act violations and amount of money confiscated/collected in a court of first instance (2001-2009)
