Section 2 Non-traffic Penal Code Offenses
1 Theft
Theft accounted for 76.3% of reported non-traffic penal code offenses in 2009. Fig. 1-1-2-1 shows the number of reported cases, number of cleared cases, and clearance rate for theft over the last 30 years. The number of reported cases for theft increased whereas the clearance rate declined from 1995 through to 2001. However, the clearance rate then started to rise again in 2002 whereas the number of reported cases started to decrease in 2003, thus putting the brake on a worsening situation. The number of reported cases turned to a decreasing trend after reaching a post WWII high of 2,377,488 in 2002 and then subsequently continued to decrease every year from 2003 on. In 2009 it was 1,299,294, down 1,078,194 (45.4%) from 2002. The number of cleared cases was 361,969 (down 17,870 or 4.7% from the previous year) and the number of persons cleared 175,823 (up 1,085 or 0.6% (id.)) in 2009. The clearance rate, however, continued to rise every year from 2002 on and was 27.9% in 2009, up 12.2 points from the post WWII low of 2001.
Fig. 1-1-2-1 Number of reported/cleared cases and clearance rate for theft (1980-2009)
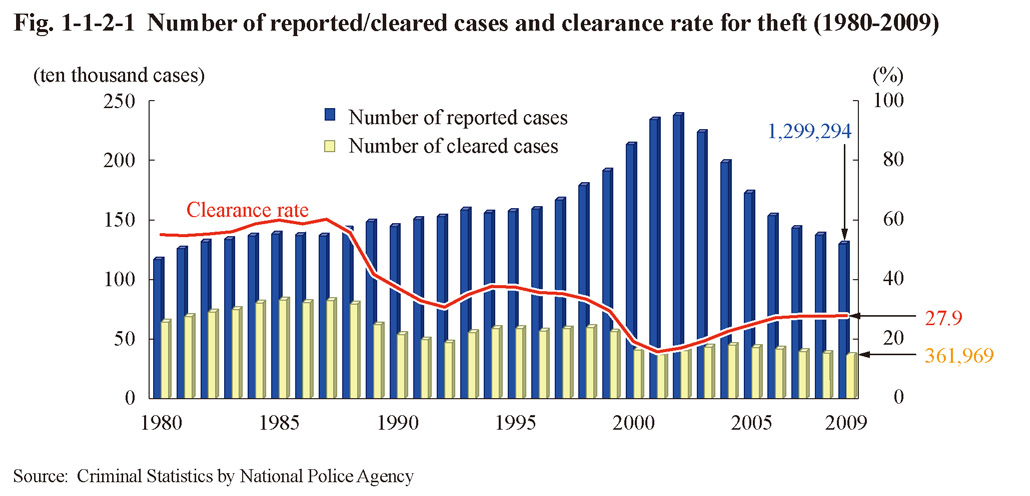
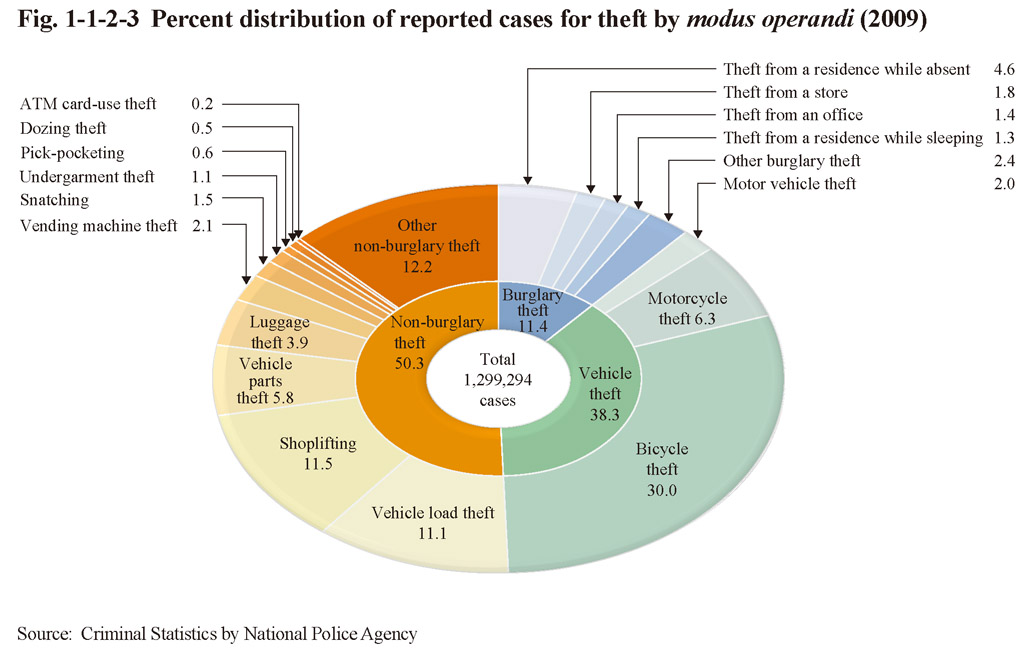
Fig. 1-1-2-2 [1] shows the number of reported cases for burglary theft, vehicle theft, and non-burglary theft over the last 20 years and Fig. 1-1-2-3 the percent distribution of reported cases for theft by modus operandi in 2009. The numbers of reported cases for all modus operandi have all been on a decreasing trend after reaching a peak around 2002 when the number of reported cases for all types of theft reached a peak. Fig. 1-1-2-2 [2] shows the number of reported cases for some of the modus operandi over the last 20 years. The number of reported cases for vending machine theft significantly decreased after reaching a peak in 1999 (approximately 220 thousand cases, accounting for 11.6% of all theft cases). That for shoplifting continued to increase until 2004 and has since remained stable (See Appendix of Fig. 1-1-2-3 for the number of reported cases by modus operandi).
Fig. 1-1-2-2 Number of reported cases for theft (by modus operandi) (1990-2009)
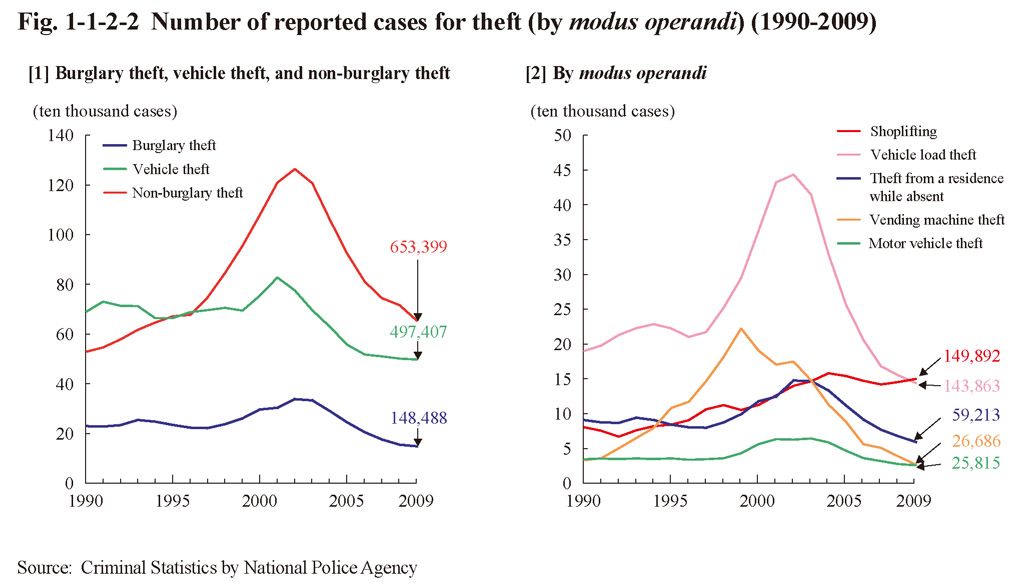
Fig. 1-1-2-3 Percent distribution of reported cases for theft by modus operandi (2009)