2 Analysis of repeat offense status
This subsection describes the status with repeat offenses by details of the index offense and history of offenses, etc. in identifying the risk of a repeat offense by a serious offender. Analysis based on this special research was conducted to identify differences in the status of repeat offenses arising from differing circumstances. The circumstances behind characteristic results being obtained will mainly be discussed here.
(1) Females
60 of the research subjects were females (See Table 7-2-1) and none of them repeated offenses. Of females the percentage of those with no history of protective measures was 98.3%, that with no history of a previous conviction 85.0%, and that with no history of previous imprisonment (first-time inmates) 98.3%, thus indicating that many females did not have advanced criminal tendencies. In addition, 95.0% of females were released on parole and an environment for their return was generally secured. The risk of a repeat offense is therefore considered low with females.
(2) Details of index offenses
a. Relationship with victims
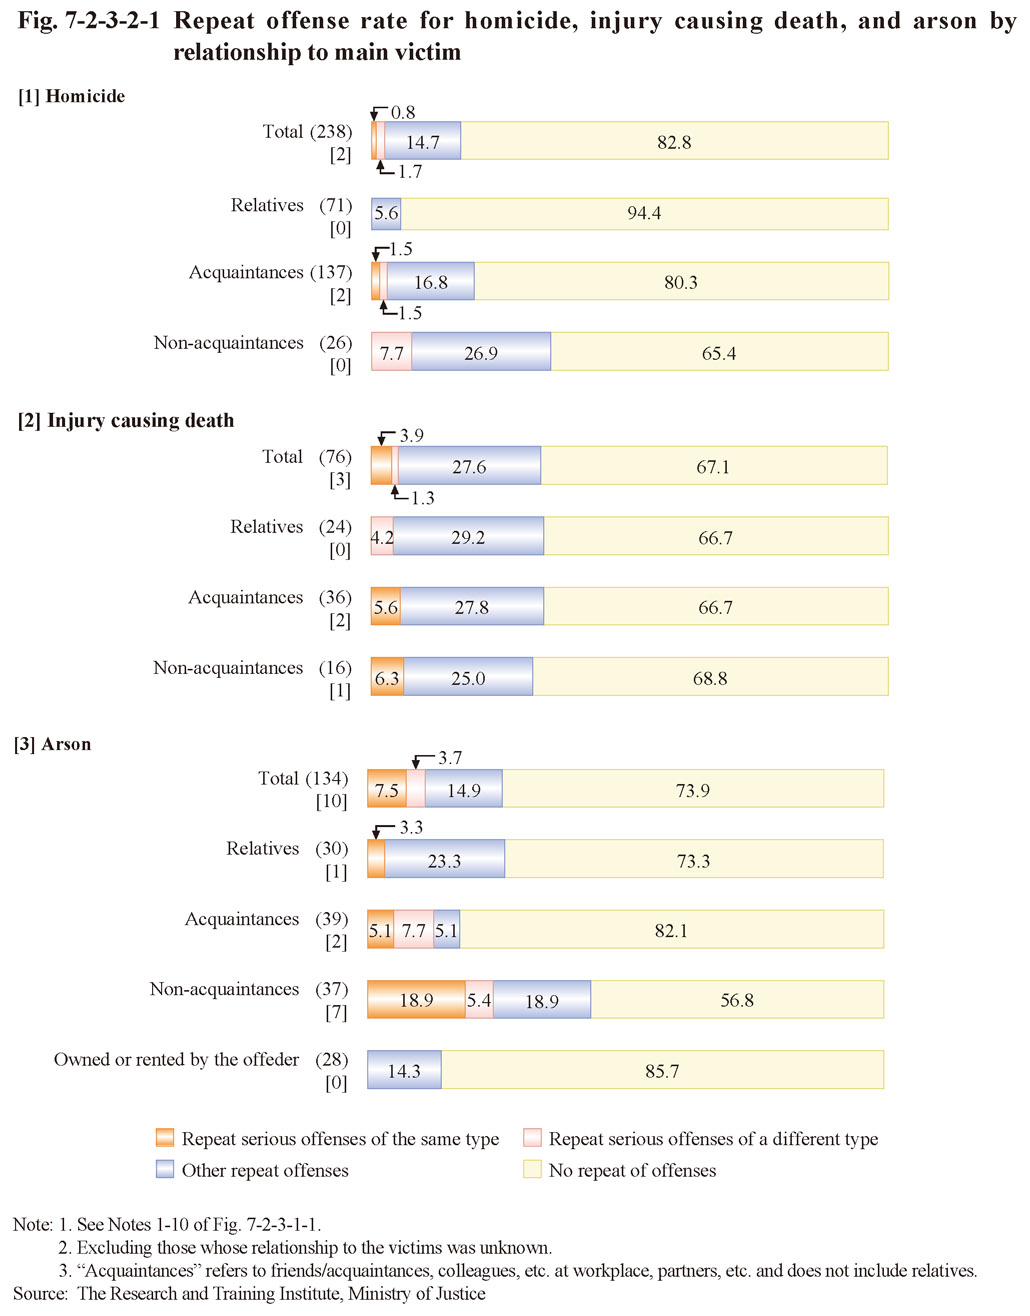
Fig. 7-2-3-2-1 shows the repeat offense rate by relationship to the main victim for homicide, injury causing death, and arson, which were of the high percentage of having been committed against relatives (See Fig. 7-2-1-1-1). For homicide those who had committed homicide against a relative had a lower repeat offense rate than all the research subjects that had committed homicide, and none of them repeated a serious offense. For injury causing death there was no difference in the repeat offense rate between those with a different relationship to the victim. Those who had committed injury causing death against a relative did not repeat homicide/injury causing death (no repeat serious offenses of the same type), but the repeat offense rate was still not very low. The reason for that difference with those who committed homicide against a relative was that it was typically committed due to exhaustion from nursing care/nurturing while injury causing death against a relative was typically committed due to anger/violent emotion or abuse/punishment (See Table 7-2-1-1-2). For arson the research subjects who had committed the offense against a non-acquaintance had a higher repeat offense rate than that of all the research subjects who had committed arson, with their repeat offense rate for arson also being high at 18.9% (10 research subjects repeated arson and seven of them were those who had committed arson against a non-acquaintance).
Fig. 7-2-3-2-1 Repeat offense rate for homicide, injury causing death, and arson by relationship to main victim
b. Motives
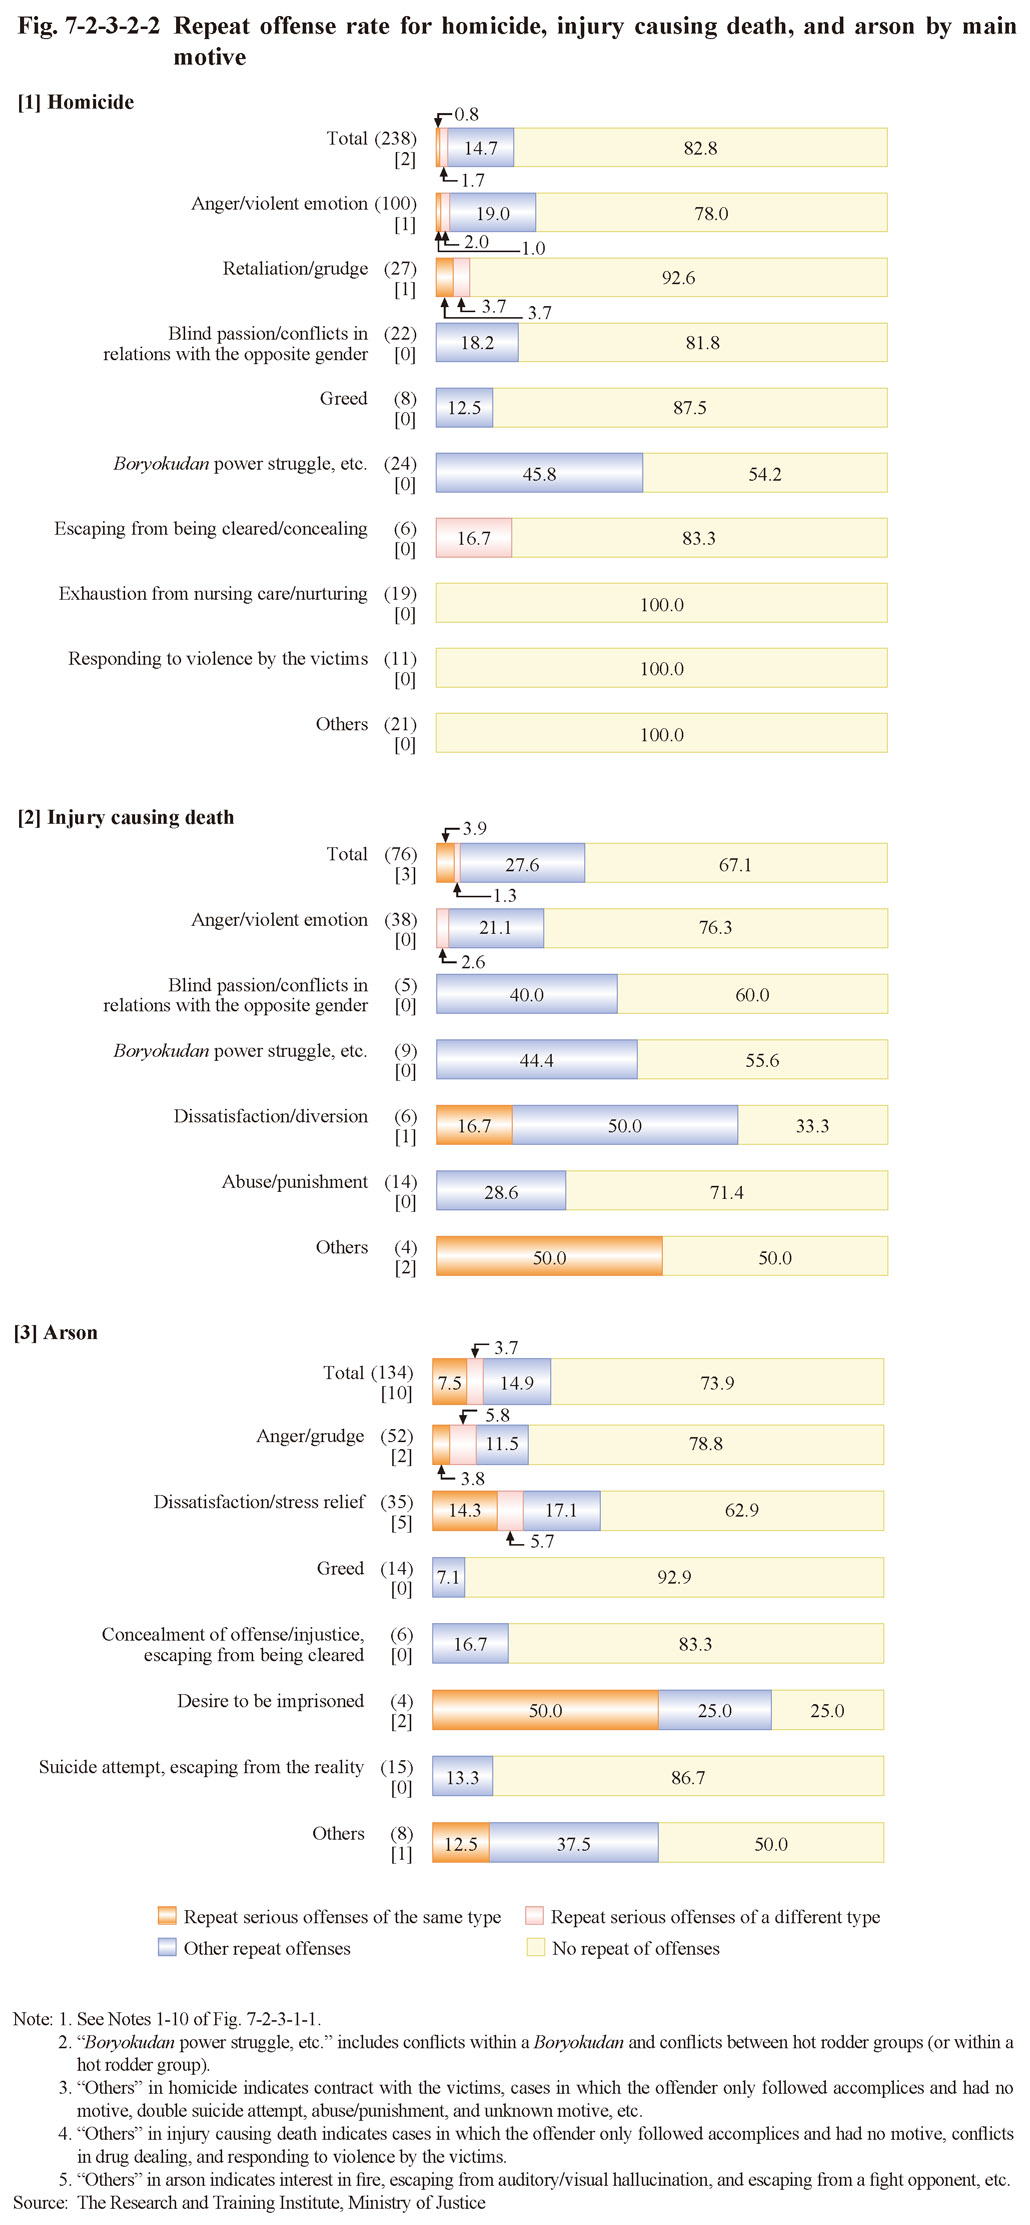
Fig. 7-2-3-2-2 shows the repeat offense rate for homicide, injury causing death, and arson by main motive (See Table 7-2-1-1-2) of the index offenses.
For homicide the repeat offense rate was the highest among those with the motive of a Boryokudan power struggle, etc. at 45.8%, whereas those with the motive of exhaustion from nursing care/nurturing, etc. did not repeat an offense. Of two persons who repeated homicide/injury causing death (repeat serious offenses of the same type) one had the motive of anger/violent emotion for the index offense and another retaliation/grudge. For injury causing death four of six persons with the motive of dissatisfaction/diversion repeated offenses, and one of them repeated homicide. For arson three of four persons with the motive of a desire to be imprisoned repeated offenses, and two of them repeated arson. In addition, five of 35 persons with the motive of dissatisfaction/stress relief repeated arson.
Fig. 7-2-3-2-2 Repeat offense rate for homicide, injury causing death, and arson by main motive
c. Leading roles in offenses
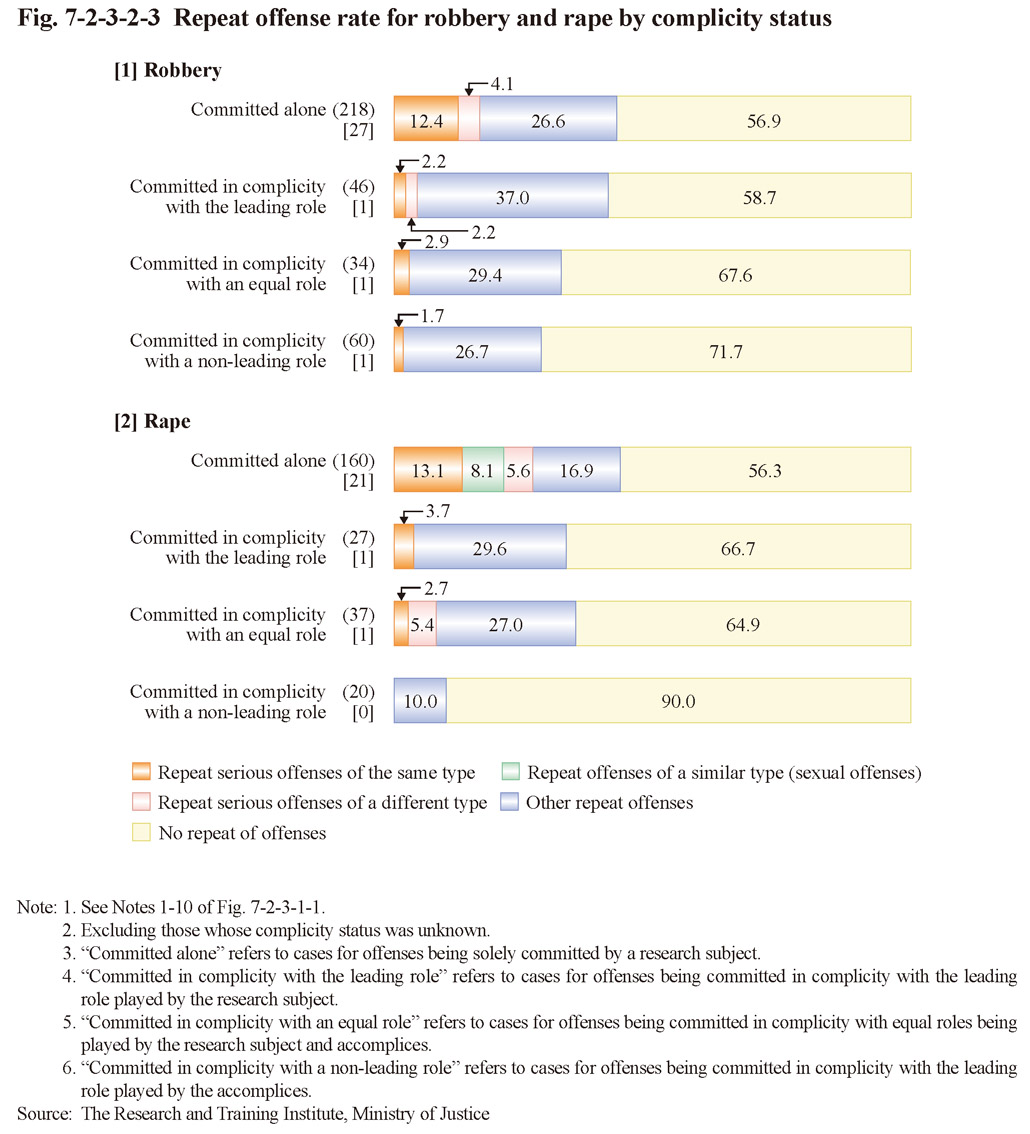
Fig. 7-2-3-2-3 shows the repeat offense rate for robbery and rape committed alone (solely committed by a research subject), in complicity with the leading role (committed in complicity with the leading role played by the research subject), in complicity with an equal role (committed in complicity with equal roles being played by the research subject and accomplices), and in complicity with a non-leading role (committed in complicity with the leading role played by the accomplices). The repeat offense rate was high among those who had committed an offense alone and low among those who had committed the offense in complicity with a non-leading role for every type of offense. The repeat offense rate was remarkably low among those that committed the offense in complicity with a non-leading role for rape. For robbery 30 repeated robbery and 27 of them committed the index offense alone. For rape 21 of 23 persons who repeated rape had committed the index offense alone and all 15 persons who repeated a forcible indecency (excluding those that repeated rape) had committed the index offense alone.
Fig. 7-2-3-2-3 Repeat offense rate for robbery and rape by complicity status
d. Form of offense, etc.
(a) Robbery
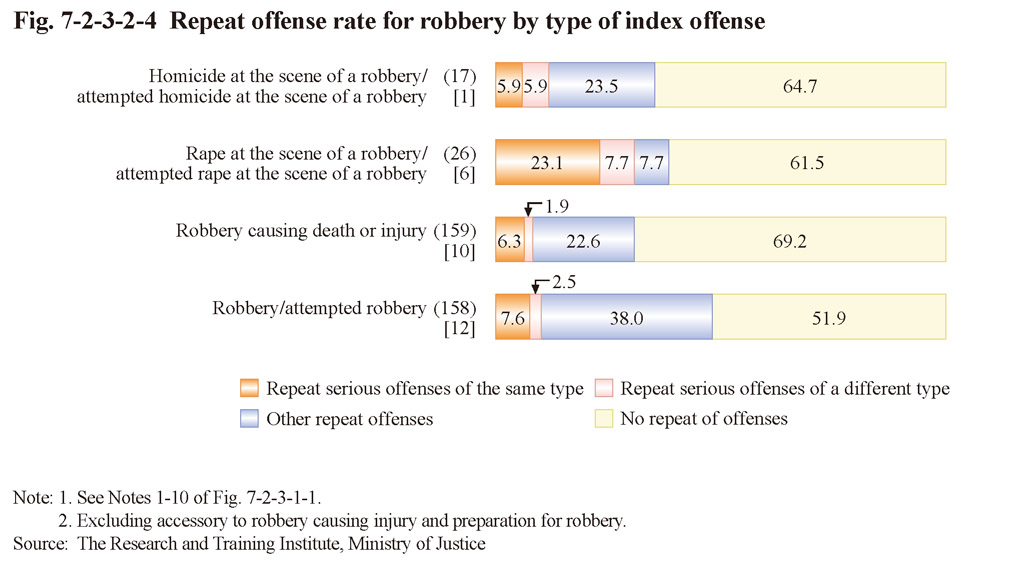
Fig. 7-2-3-2-4 shows the repeat offense rate for robbery by subdivision of type of index offense. Of 26 persons that had committed rape at the scene of a robbery, six (23.1%) repeated robbery (four repeated rape at the scene of a robbery) and two (7.7%) repeated rape.
Fig. 7-2-3-2-4 Repeat offense rate for robbery by type of index offense
Examining the repeat offense rate by form of robbery (See Fig. 7-2-1-1-7) revealed that it was low at 28.2% for financial institution robbery, but around 40% to 50% for the other types. The percentage of those who repeated robbery was the highest among those who had committed residential robbery at 17.9% (8.3% of all research subjects that had committed robbery) and 10 of 30 persons who repeated robbery had committed residential robbery as the index offense.
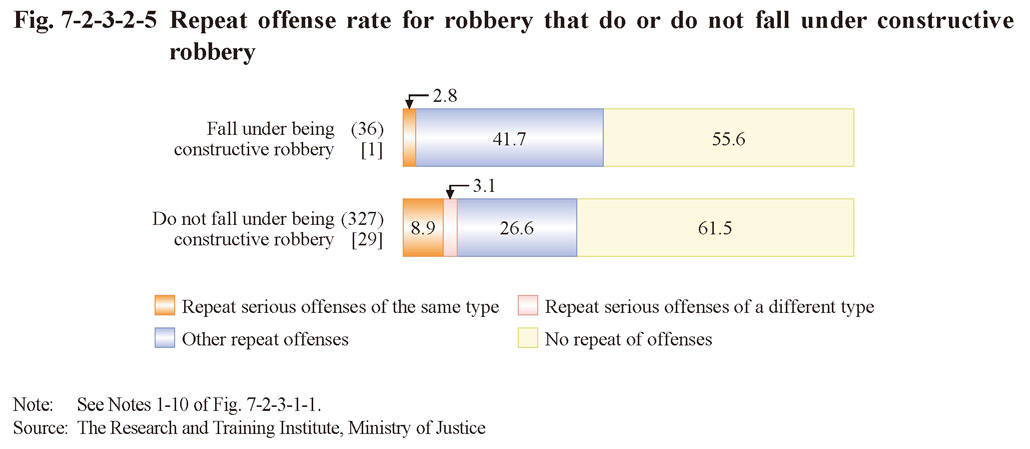
Fig. 7-2-3-2-5 shows the repeat offense rate of 36 persons that fall under constructive robbery (by modus operandi of the initial theft nine were for theft from an office, six theft by breaking into a residence, and six shoplifting, etc.). Although the repeat offense rate was high (mostly for repeating theft) the percentage of those who repeated robbery (one person) was lower than that of all research subjects who had committed robbery.
Fig. 7-2-3-2-5 Repeat offense rate for robbery that do or do not fall under constructive robbery
(b) Rape
Examining the status with repeat offenses for rape by the form of the offense revealed that the percentage of those who had committed the offense by breaking into a residence of a victim that was a non-acquaintance (43 persons) who then repeated rape was 23.3% (10 persons) and that including the repeat offense of forcible indecency was 30.2% (13 persons), both significantly higher than that of all the research subjects who had committed rape (23 persons or 9.4% repeated rape and 38 persons or 15.6% repeated rape or forcible indecency).
(3) History of offenses, etc.
a. Previous convictions
Fig. 7-2-3-2-6 shows the repeat offense rate by number of previous convictions and type of index offense. The repeat offense rate generally tended to be higher among those with a larger number of previous convictions for each type of offense.
Fig. 7-2-3-2-6 Repeat offense rate by number of previous convictions and type of index offense

Fig. 7-2-3-2-7 shows the repeat offense rate of those that had committed robbery as the index offense with previous convictions for robbery, property offenses, or violent offenses. The percentage of those who repeated robbery was high at 25.0% (seven persons) among those with previous convictions for robbery and also high at 21.2% (11 persons) among those with three or more convictions for property offenses.
Fig. 7-2-3-2-7 Repeat offense rate for robbery by number of previous convictions
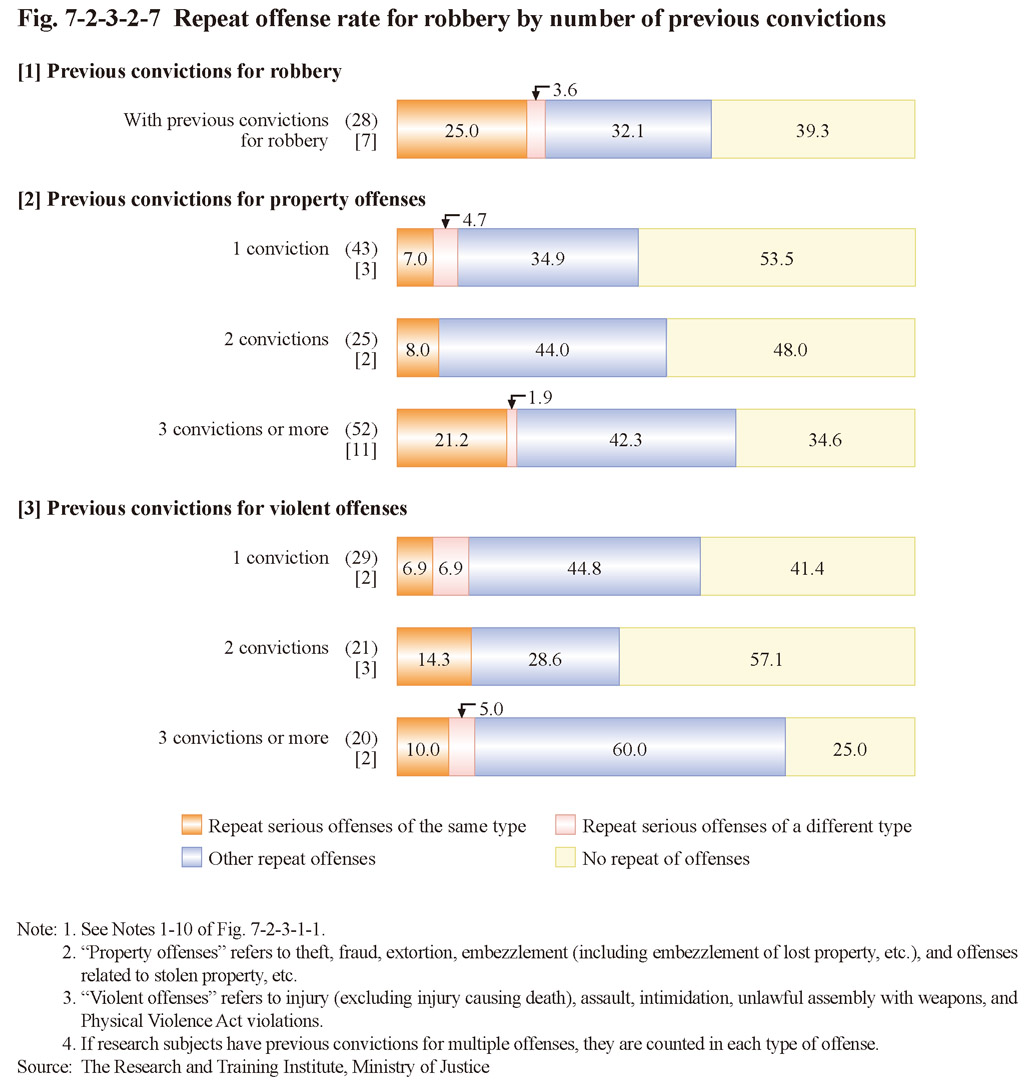
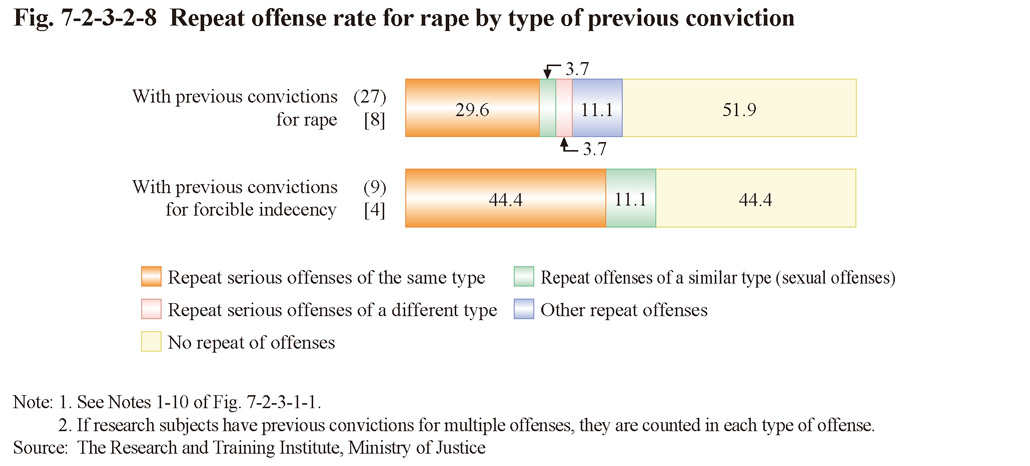
Fig. 7-2-3-2-8 shows the repeat offense rate of those who had committed rape as the index offense with previous convictions for rape or forcible indecency. 29.6% (eight persons) of those with previous convictions for rape (those who had repeated rape) and 44.4% (four persons) of those with previous convictions for forcible indecency repeated rape.
Fig. 7-2-3-2-8 Repeat offense rate for rape by type of previous conviction
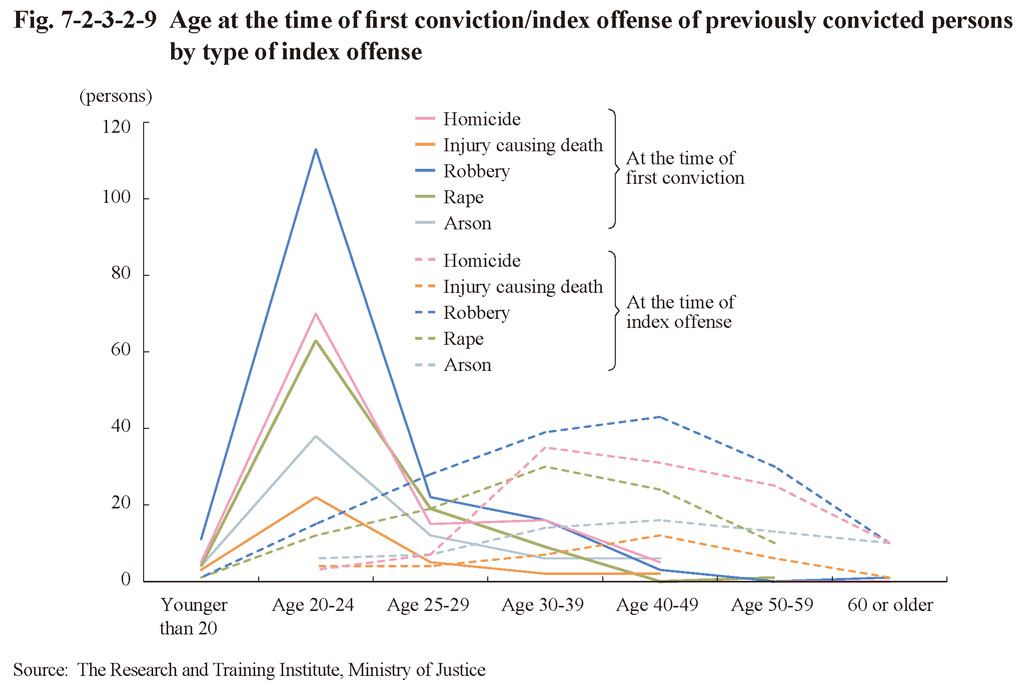
As described above the repeat offense rate of those with larger numbers of previous convictions tended to be high (See Fig. 7-2-3-2-6). In order to identify the attributes of persons who were repeatedly convicted but then committed serious offenses again, their age at the time of their first conviction (hereinafter referred to as “age at first offense” in this subsection) by type of index offense was first examined, and is shown in Fig. 7-2-3-2-9. It peaked at the first half of their 20s for each type of offense.
Fig. 7-2-3-2-9 Age at the time of first conviction/index offense of previously convicted persons by type of index offense
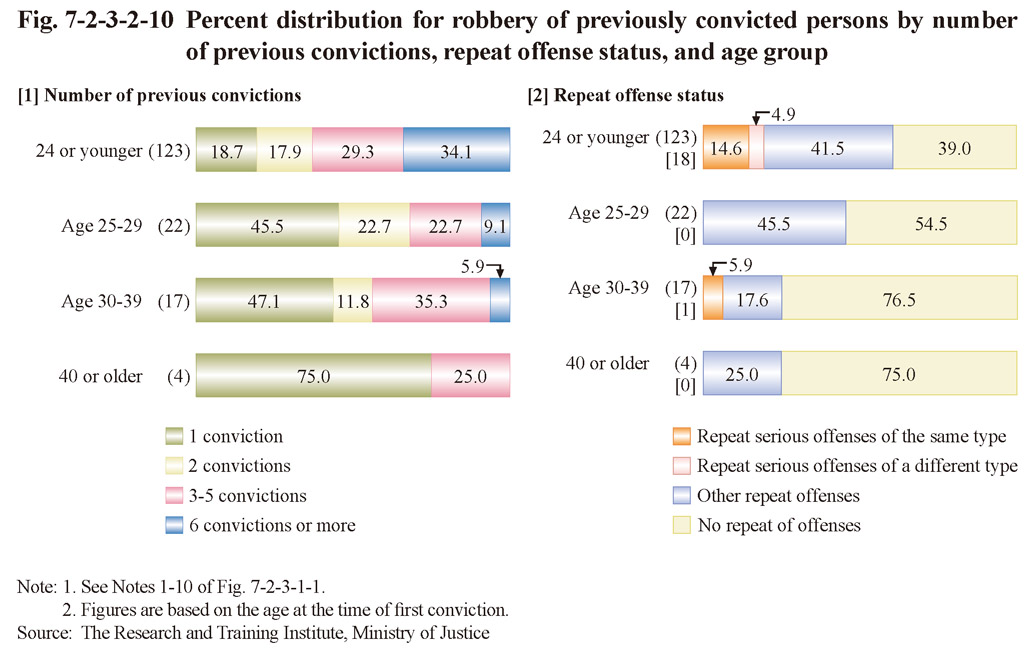
Next the percent distribution of previously convicted research subjects who had committed robbery as the index offense by age at first offense and number of previous convictions was examined, and is shown in Fig. 7-2-3-2-10 [1]. Among those with an age at first offense being 24 or younger the proportion of those with six or more previous convictions was extremely high at 34.1%, with many having previous convictions for serious offenses (33.3%; 9.8% for those with two or more previous convictions for serious offenses). In addition, the repeat offense status after the index offense by age at first offense was examined, and is shown in Fig. 7-2-3-2-10 [2]. Among those with an age at first offense being 24 or younger the percentage of those who repeated serious offenses after the index offenses was high at 19.5% (15.1% among those with previous convictions). Among those with an age at first offense being 24 or younger with six or more previous convictions (42 persons), 11 (26.2%) then repeated serious offenses after the index offenses.
Examining other types of offense revealed that the percentage of previously convicted research subjects with an age at first offense of 24 or younger with six or more previous convictions was 25.0% for homicide, 29.2% for injury causing death, 21.5% for rape, and 27.5% for arson. For rape the percentage of those who repeated serious offenses after the index offense was higher at 32.3% among previously convicted research subjects with an age at first offense being 24 or younger than that of all previously convicted research subjects (26.0%). For homicide four of five previously convicted persons who repeated serious offenses after the index offenses had an age at first offense of 24 or younger. For injury causing death two of three such persons had an age at first offense of 24 or younger. For arson 13 previously convicted persons repeated serious offenses after the index offenses and eight had an age at first offense of 24 or younger (three of six persons with an age at first offense being 40-49 also repeated serious offenses after the index offenses).
Fig. 7-2-3-2-10 Percent distribution for robbery of previously convicted persons by number of previous convictions, repeat offense status, and age group
b. Number of times imprisoned in a penal institution
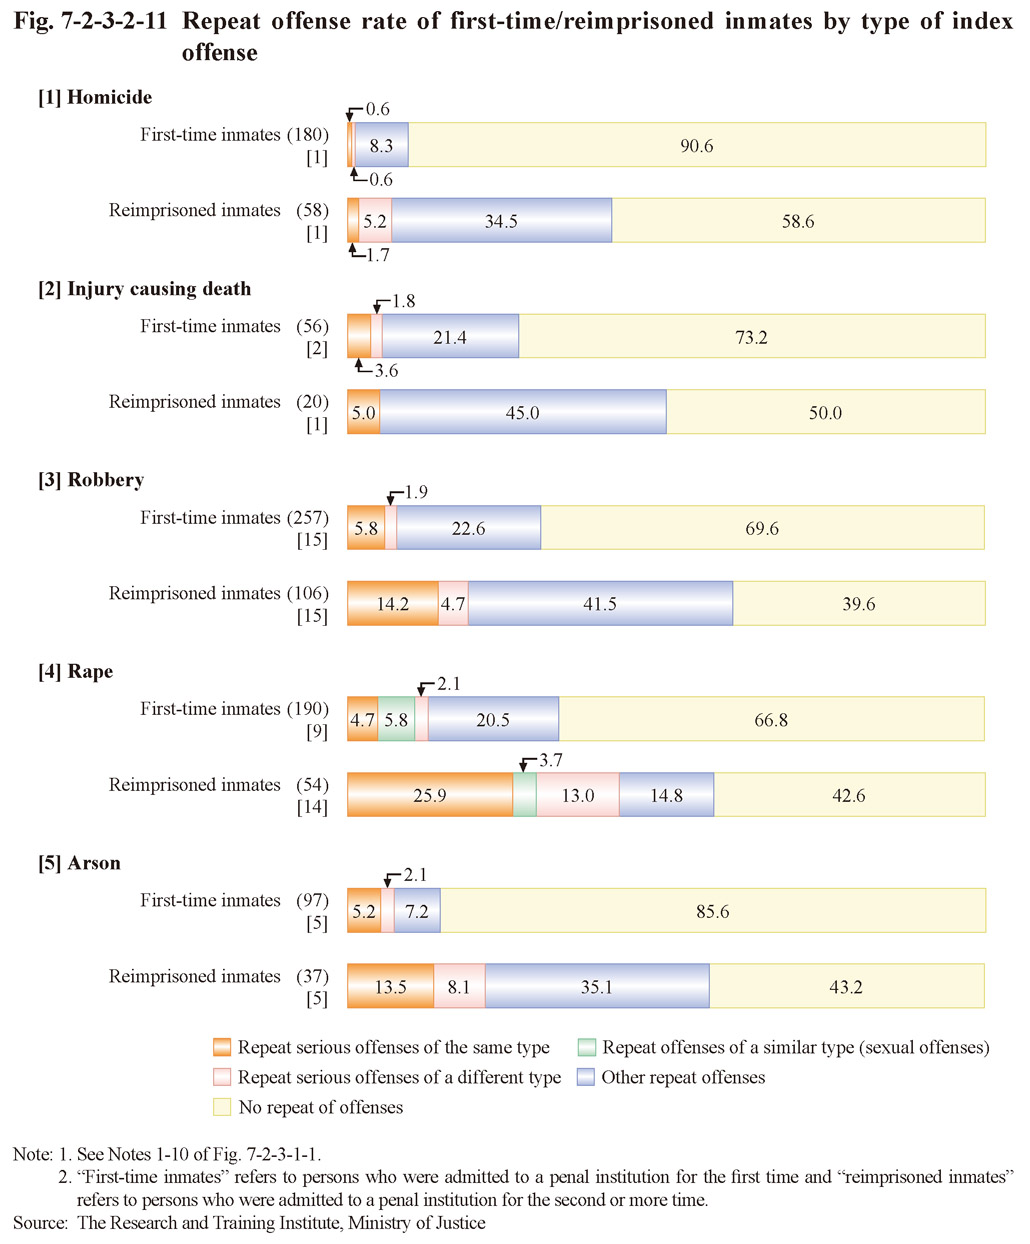
Fig. 7-2-3-2-11 shows the repeat offense rate of first-time/reimprisoned inmates by type of index offense. The repeat offense rate of those admitted to a penal institution for the second or more time (reimprisoned inmates) for an index offense was higher than that of first-time inmates for each type of offense. The same trend can be observed for the rate of repeated serious offenses of the same type for robbery, rape, and arson.
Fig. 7-2-3-2-11 Repeat offense rate of first-time/reimprisoned inmates by type of index offense
c. History of protective measures
Fig. 7-2-3-2-12 shows the repeat offense rate by history of protective measures and type of index offense. The repeat offense rate of those with a history of protective measures was remarkably higher than that of those without a history of protective measures for each type of offense. The same trend can be observed for the rate of repeated serious offenses of the same type for robbery, rape, and arson.
Fig. 7-2-3-2-12 Repeat offense rate by history of protective measures and type of index offense

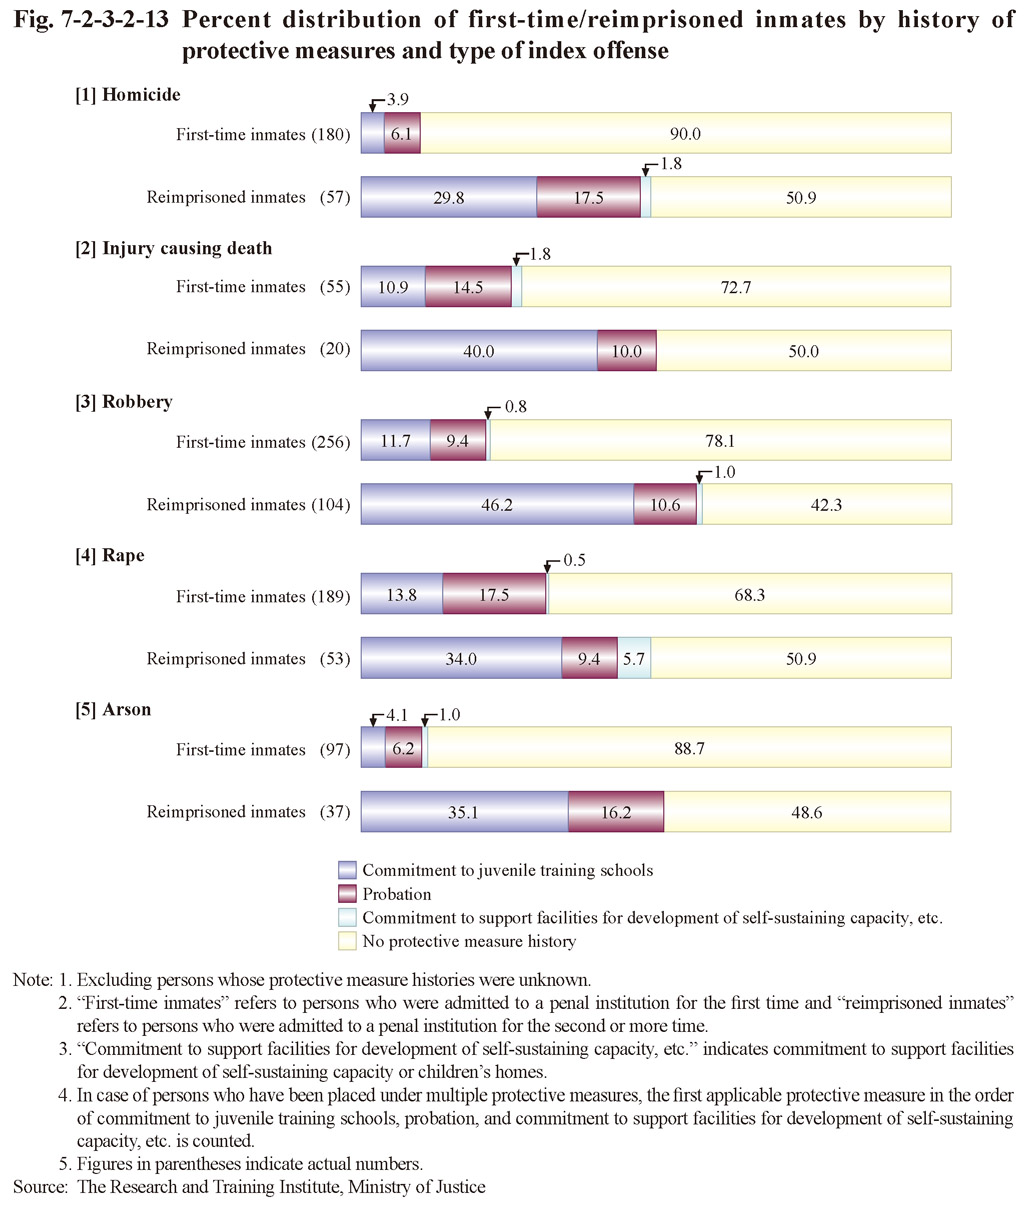
Fig. 7-2-3-2-13 shows the percent distribution of first-time/reimprisoned inmates by history of protective measures and type of index offense. Of all new inmates the percentage of those with a history of protective measures was higher among reimprisoned inmates than that among first-time inmates (See Fig. 4-4-7). The same trend can be observed for inmates for serious offenses. This trend indicates that many of those with a history of protective measures repeat offenses after becoming adults. This is considered to be a cause of the high repeat offense rate of serious offenders with a history of protective measures.
Fig. 7-2-3-2-13 Percent distribution of first-time/reimprisoned inmates by history of protective measures and type of index offense
(4) Living status at the time of index offenses
a. Residential status
Examining the offender's residential status at the time of the index offense, it was revealed that the repeat offense rate of those without a fixed residence was higher than that of those with a fixed residence for all the index offenses. The repeat offense rates for those without a fixed residence were 37.9% for homicide (14.4% for those with a fixed residence), 62.5% for injury causing death (29.4% (id.)), 42.7% for robbery (37.4% (id.)), 66.7% for rape (36.3% (id.)), and 55.6% for arson (18.7% (id.)).
b. Employment status
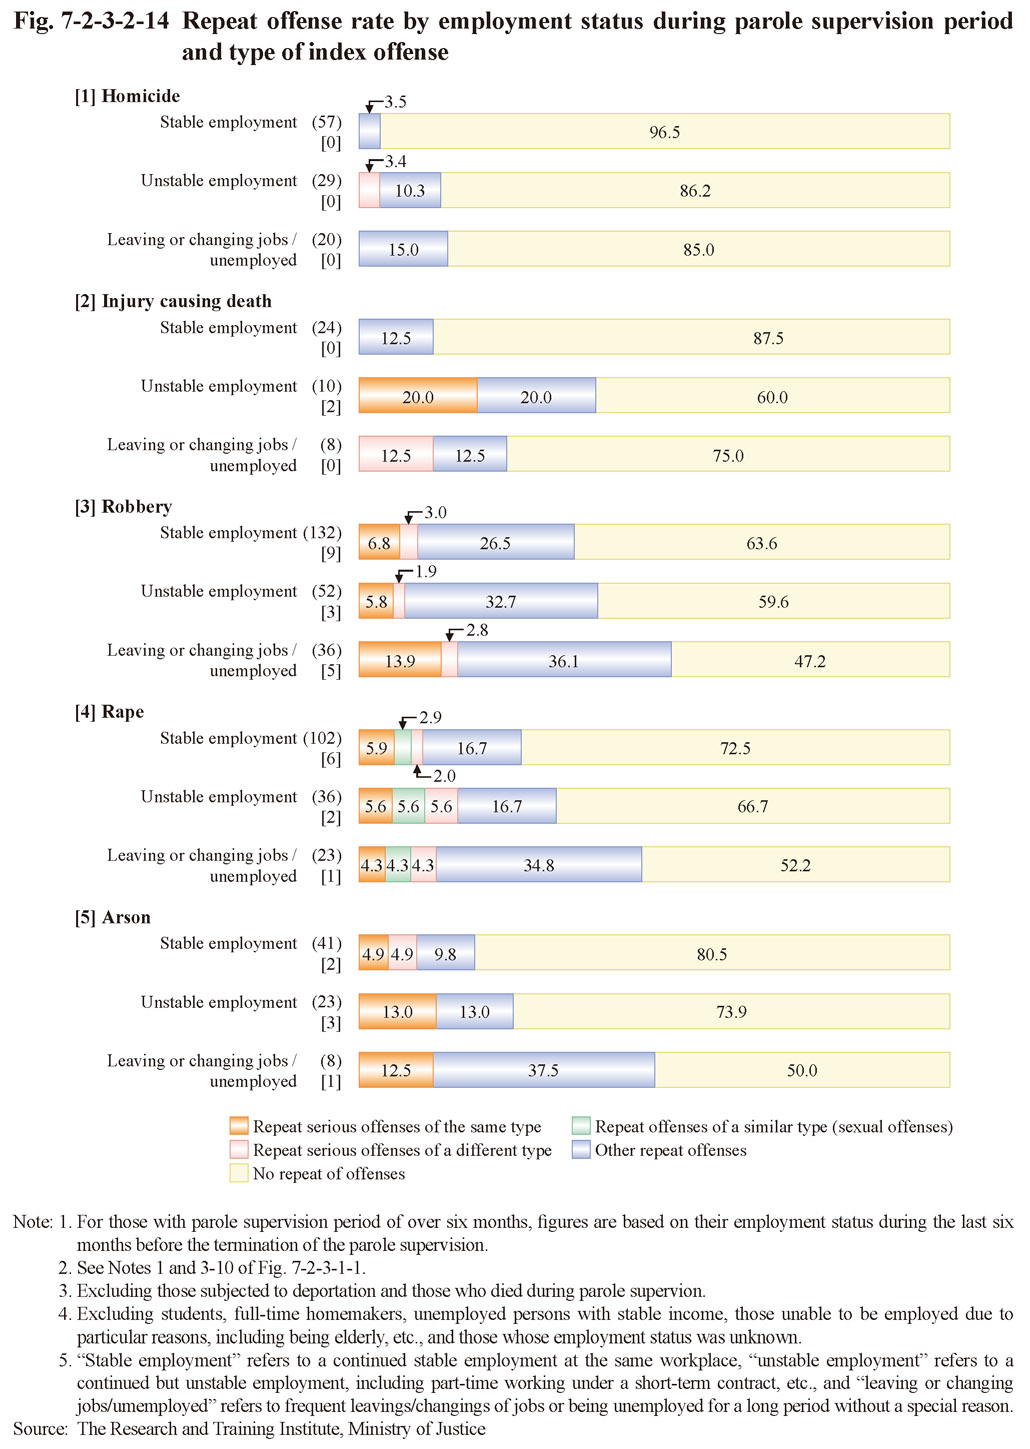
Examining the offender's employment status at the time of the index offense (excluding those whose employment status was unknown and full-time homemakers, etc.), it was revealed that the repeat offense rates of those unemployed were higher than those employed for all the index offenses except for injury causing death (with regard to injury causing death, no clear difference was observed depending on their employment status). The repeat offense rates of those unemployed were 25.7% for homicide (12.0% for those employed), 41.9% for robbery (35.0% (id.)), 50.0% for rape (33.7% (id.)), and 28.8% for arson (25.0% (id.)).
Fig. 7-2-3-2-14 shows the repeat offense rate of parolees by employment status during their parole supervision period (for those with parole supervision period of over six months, employment status during the last six months before the termination of their parole supervision). In general the repeat offense rate was lower for those with stable employment, but for rape, no difference was observed in the rate of repeating the same type of serious offenses depending on their employment status.
Fig. 7-2-3-2-14 Repeat offense rate by employment status during parole supervision period and type of index offense
c. Problems in life
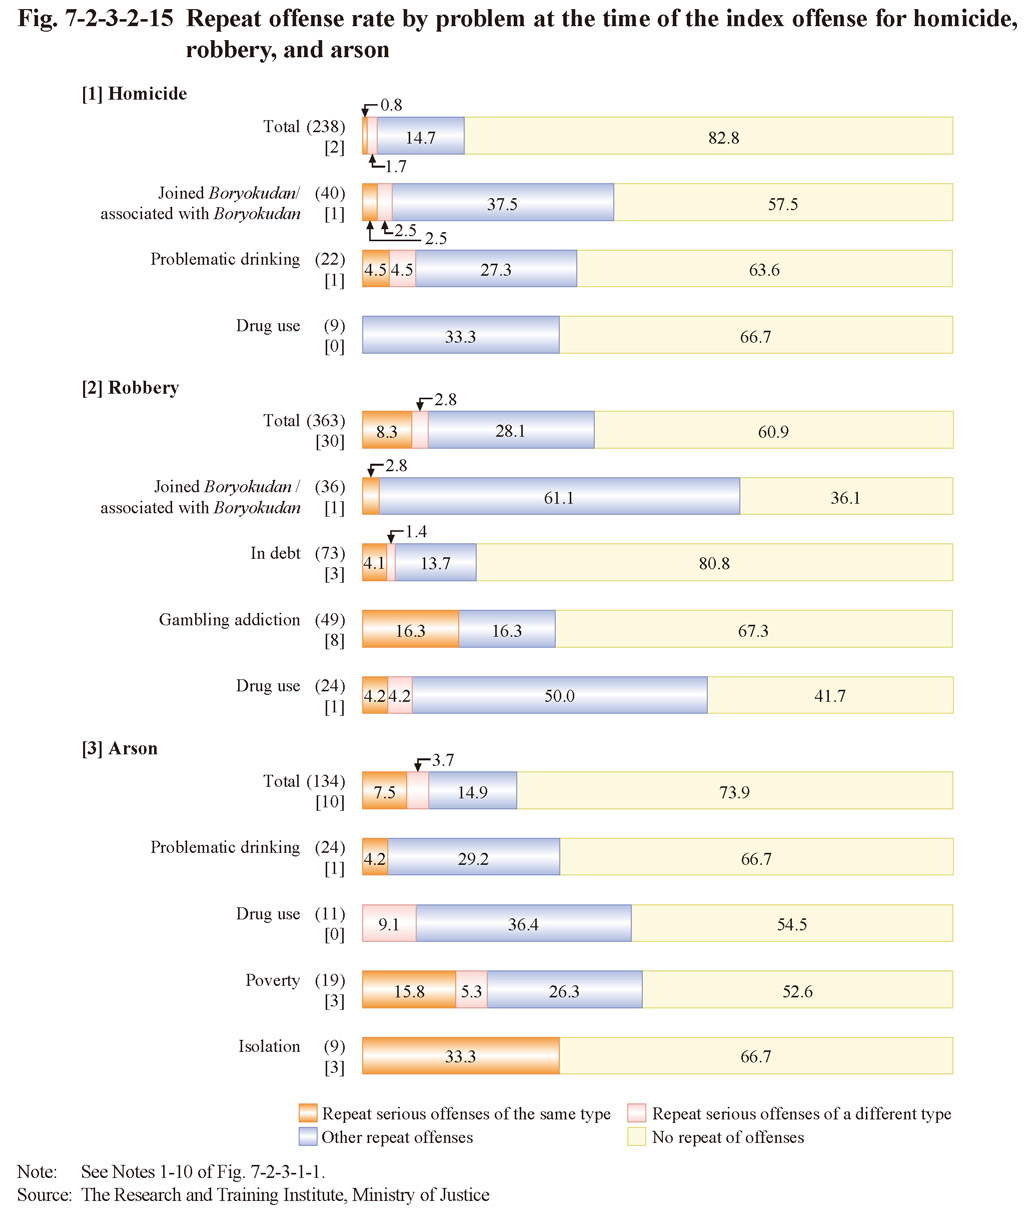
Fig. 7-2-3-2-15 shows the repeat offense rate for homicide, robbery, and arson by type of offender's problem at the time of the index offense, as estimated in its judgment (basically, the problems with high repeat offense rate are shown). For robbery the repeat offense rate for robbery was high among those with a gambling addiction problem at the time of the index offenses. For arson three (15.8%) of 19 persons with a poverty problem and three (33.3%) of nine persons with an isolation problem repeated arson.
Fig. 7-2-3-2-15 Repeat offense rate by problem at the time of the index offense for homicide, robbery, and arson
(5) Existence of supervisor
The percentage of those with a pledged supervisor (refers to a person (relatives, etc.) who pledged to supervise the defendants after their release by testifying before the court as a witness or by submitting a written statement to the court; hereinafter the same in this subsection) at the trial for the index offense was 19.7% for homicide, 32.9% for injury causing death, 28.1% for robbery, 48.0% for rape, and 32.1% for arson.
No clear difference was observed in the repeat offense rate of those with and without a pledged supervisor. However, among those without a fixed residence at the time of the index offense (193 persons), the rate of repeated serious offenses was 16.1% for those without a pledged supervisor (161 persons), while for those with a pledged supervisor (total of 32 persons with two for homicide, one for injury causing death, 20 for robbery, three for rape, and six for arson as their index offenses), there was one person (3.1%) whose index offense was rape that repeated a serious offense.
(6) Disciplinary punishment in penal institutions
Fig. 7-2-3-2-16 shows the repeat offense rates of those who had served in the penal institution more than two years, by whether they had received a disciplinary punishment within one year before their release (See (4) of Subsection 1, Section 2) for each index offense. In general the repeat offense rate was high with those with disciplinary punishments, but for arson, the repeat offense rate was not low with those without disciplinary punishments.
Fig. 7-2-3-2-16 Repeat offense rate by type of index offense and whether the person received a disciplinary punishment within one year before release

(7) Reason for release
Fig. 7-2-3-2-17 shows the repeat offense rate by reason for release (on parole or completion of their term of imprisonment) and type of index offense. As observed in the cumulative percentage of reimprisonment within 10 years after the release for inmates released in 2000 (See Fig. 7-1-3-3) the repeat offense rate of those released on completion of their term of imprisonment was remarkably higher than that of those released on parole. The difference was particularly large for homicide and injury causing death, although for injury causing death and arson, no difference was observed in the rates of repeated serious offenses of the same type between the different reasons for release.
Fig. 7-2-3-2-17 Repeat offense rate by reason for release and type of index offense

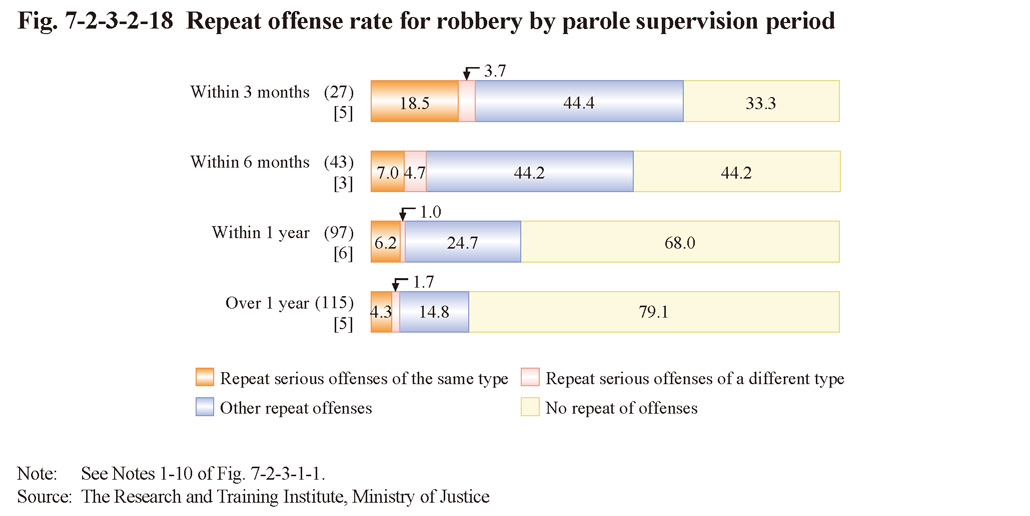
Fig. 7-2-3-2-18 shows the repeat offense rate of parolees for robbery, which was common among parolees, by their parole supervision period. It was observed that the shorter their parole supervision periods were, the higher their repeat offense rates were, and the repeat offense rate of parolees whose parole supervision periods were within three months was remarkably high. This is due to the fact that the percentage of reimprisoned inmates was higher for those with shorter supervision periods (51.9% for those with parole supervision period within three months, 41.9% for that over three months but within six months, 11.3% for that over six months but within one year, and 7.0% for that over one year).
Fig. 7-2-3-2-18 Repeat offense rate for robbery by parole supervision period
(8) Repeat offense period
Fig. 7-2-3-2-19 shows the percent distribution of those who repeated offenses by their repeat offense period (refers to period between the release from the penal institution and the first repeat offense; hereinafter the same in this subsection) for each type of index offense. The percentage of those with repeat offense periods of less than one year was 40% or more for robbery, rape, and arson.
Fig. 7-2-3-2-19 Percent distribution by repeat offense period and type of index offense
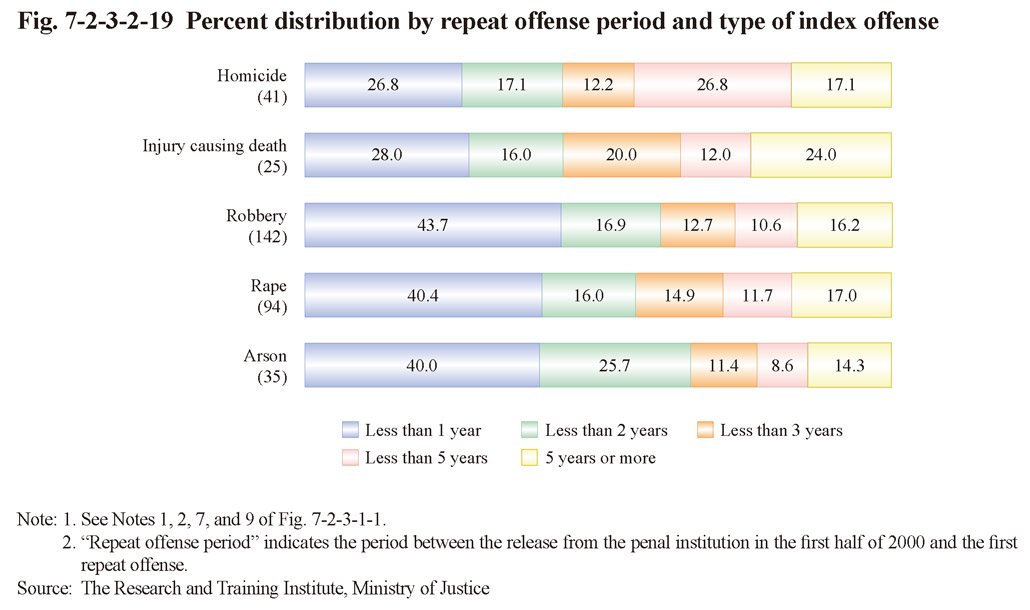
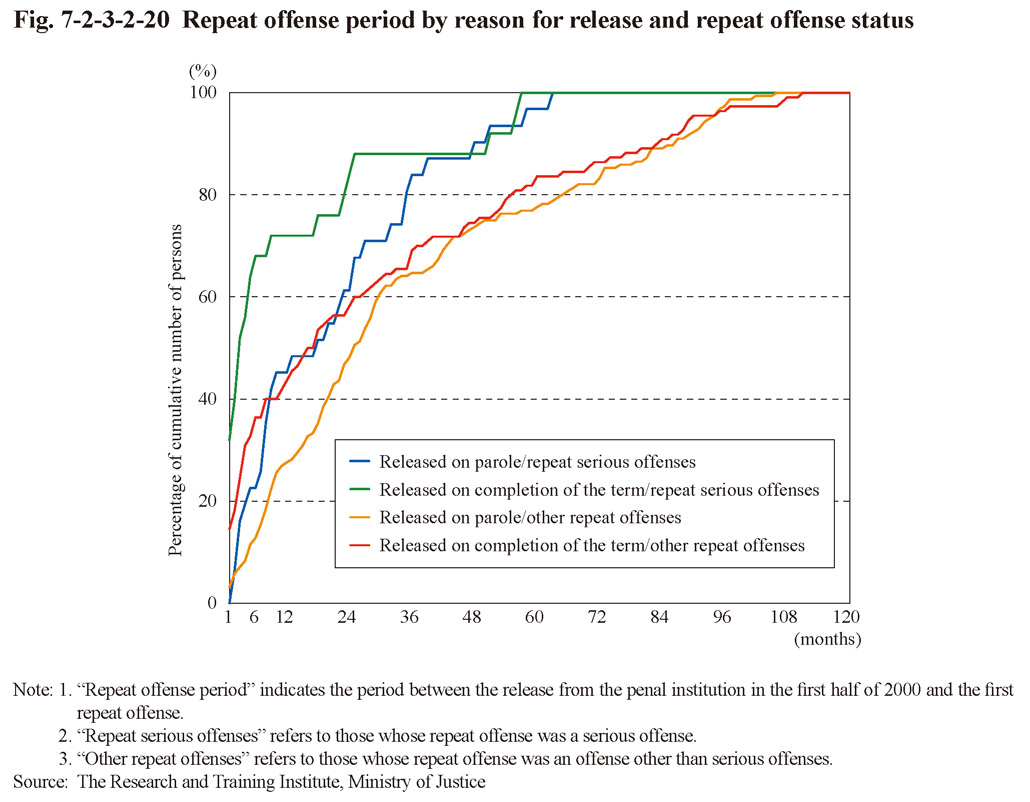
Fig. 7-2-3-2-20 shows the repeat offense period (shown as the percentage of cumulative number of those who committed their first repeat offense within each period indicated in the horizontal axis (in months) after their release) of those who repeated offenses by reason for release (on parole or on completion of their term of imprisonment) and type of repeat offense. The repeat offense period of those who were released on completion of their term of imprisonment and repeated serious offenses was shorter than that of the others.
Fig. 7-2-3-2-20 Repeat offense period by reason for release and repeat offense status
From the viewpoint of the research subjects' residential status at the time of their index offenses, among those who repeated an offense, the percentage of those who repeated an offense in less than one year after their release was higher for those without a fixed residence (56.7%) than that for those with a fixed residence (31.0%). For robbery and arson over 60% of those without a fixed residence repeated an offense in less than one year.
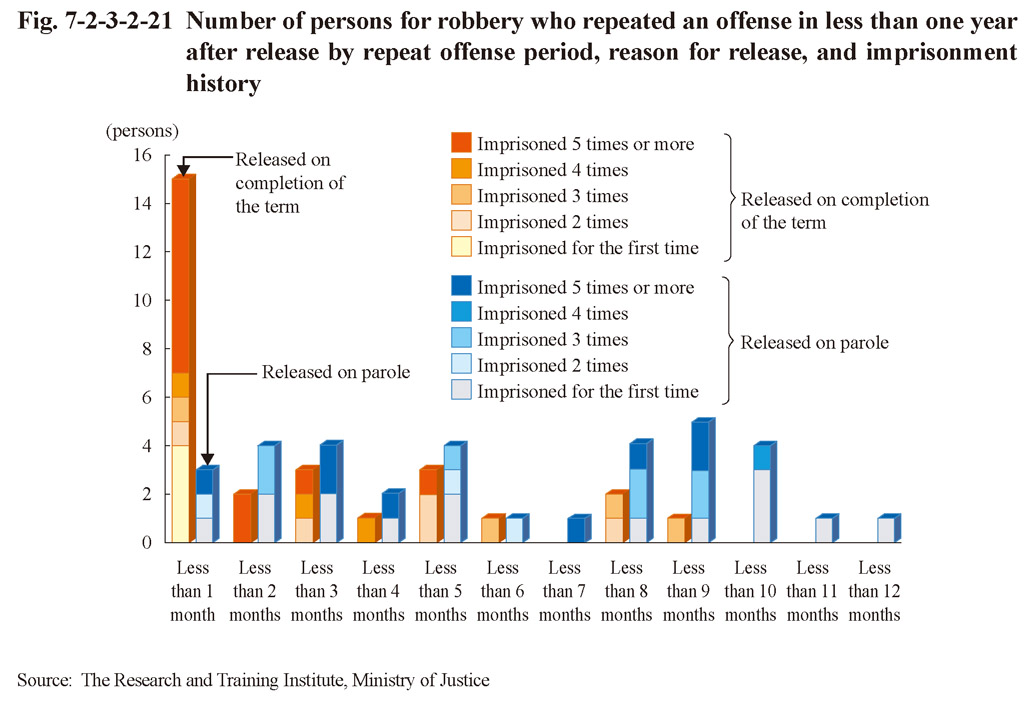
Fig. 7-2-3-2-21 shows the repeat offense period of those for robbery that repeated an offense in less than one year after release. 18 persons repeated an offense in less than one month after their release. Among them, 15 were released on completion of their term of imprisonment, thus accounting for 33.3% of those released on completion of their term of imprisonment and repeated an offense (18.5% of all those released on completion of their term of imprisonment). Eight of those 15 persons had been imprisoned five times or more and four had been imprisoned for the first time. As for their repeat offenses, three persons committed robbery, one committed arson, six committed property offenses, and three committed violent offenses.
Fig. 7-2-3-2-21 Number of persons for robbery who repeated an offense in less than one year after release by repeat offense period, reason for release, and imprisonment history