2 Correction
Fig. 3-4-2-2 shows the number of new elderly inmates by history of imprisonment over the last 20 years. The number has been on a basically consistently increasing trend over the last 20 years with both first-time and reimprisoned inmates, with that increasing trend being quite remarkable when compared with all new inmates.
Fig. 3-4-2-2 Number of new elderly inmates by history of imprisonment (1990-2009)
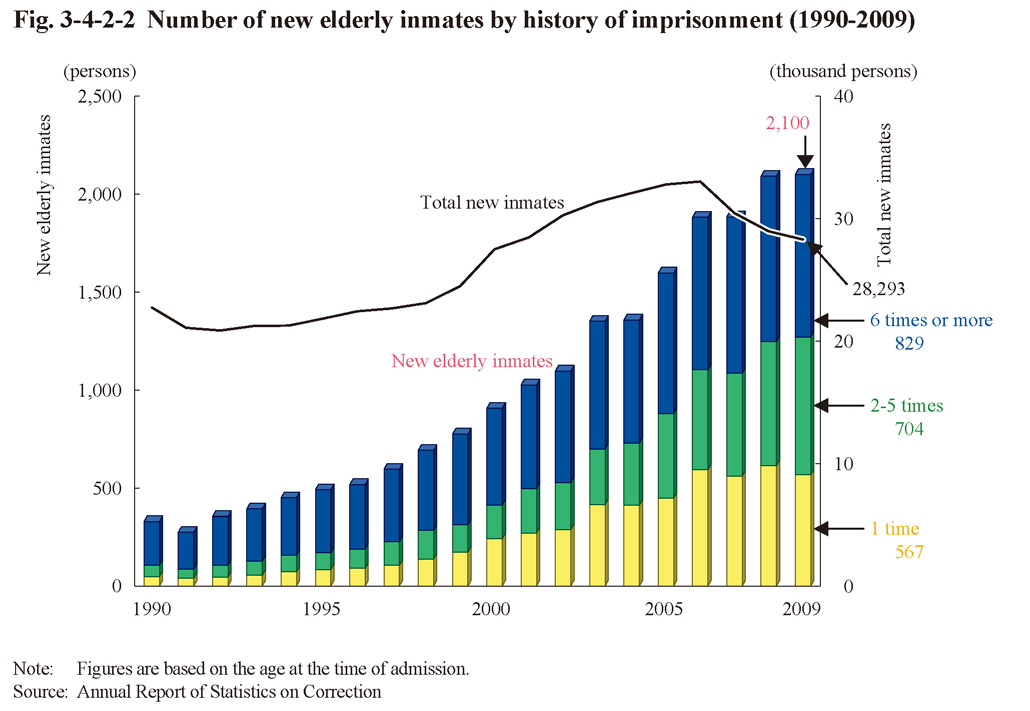
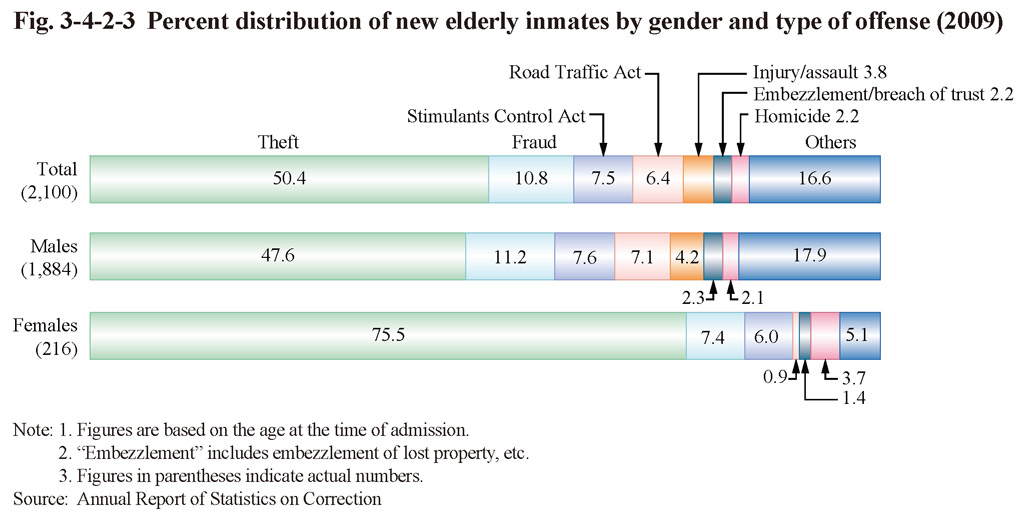
Fig. 3-4-2-3 shows the percent distribution of new elderly inmates by gender and type of offense in 2009. In total the proportion for theft was the highest at 50.4%, followed by fraud at 10.8%, Stimulants Control Act violations at 7.5%, Road Traffic Act violations at 6.4%, and injury/assault at 3.8%. Among males the percent distribution by type of offense was similar to that overall but with females the proportion of theft was especially high at 75.5%.
Fig. 3-4-2-3 Percent distribution of new elderly inmates by gender and type of offense (2009)