8 Repeat offenders/previously convicted persons
Table 7-1-1-12 shows the number of repeat offenders (persons who have previously been cleared for penal code offenses or special act offenses but excluding Road Traffic Act violations and were then cleared again) and the rate of repeat offenders of those cleared for serious offenses in 2009 and in 1999-2008 (cumulative total). The rate of repeat offenders was higher for every serious offense than that for all non-traffic penal code offenses, with that for robbery being remarkably high (See Subsection 2, Section 5 for cleared juveniles with a history of delinquency).
Table 7-1-1-12 Number of cleared repeat offenders and rate of repeat offenders by type of offense (2009, cumulative total of 1999-2008)

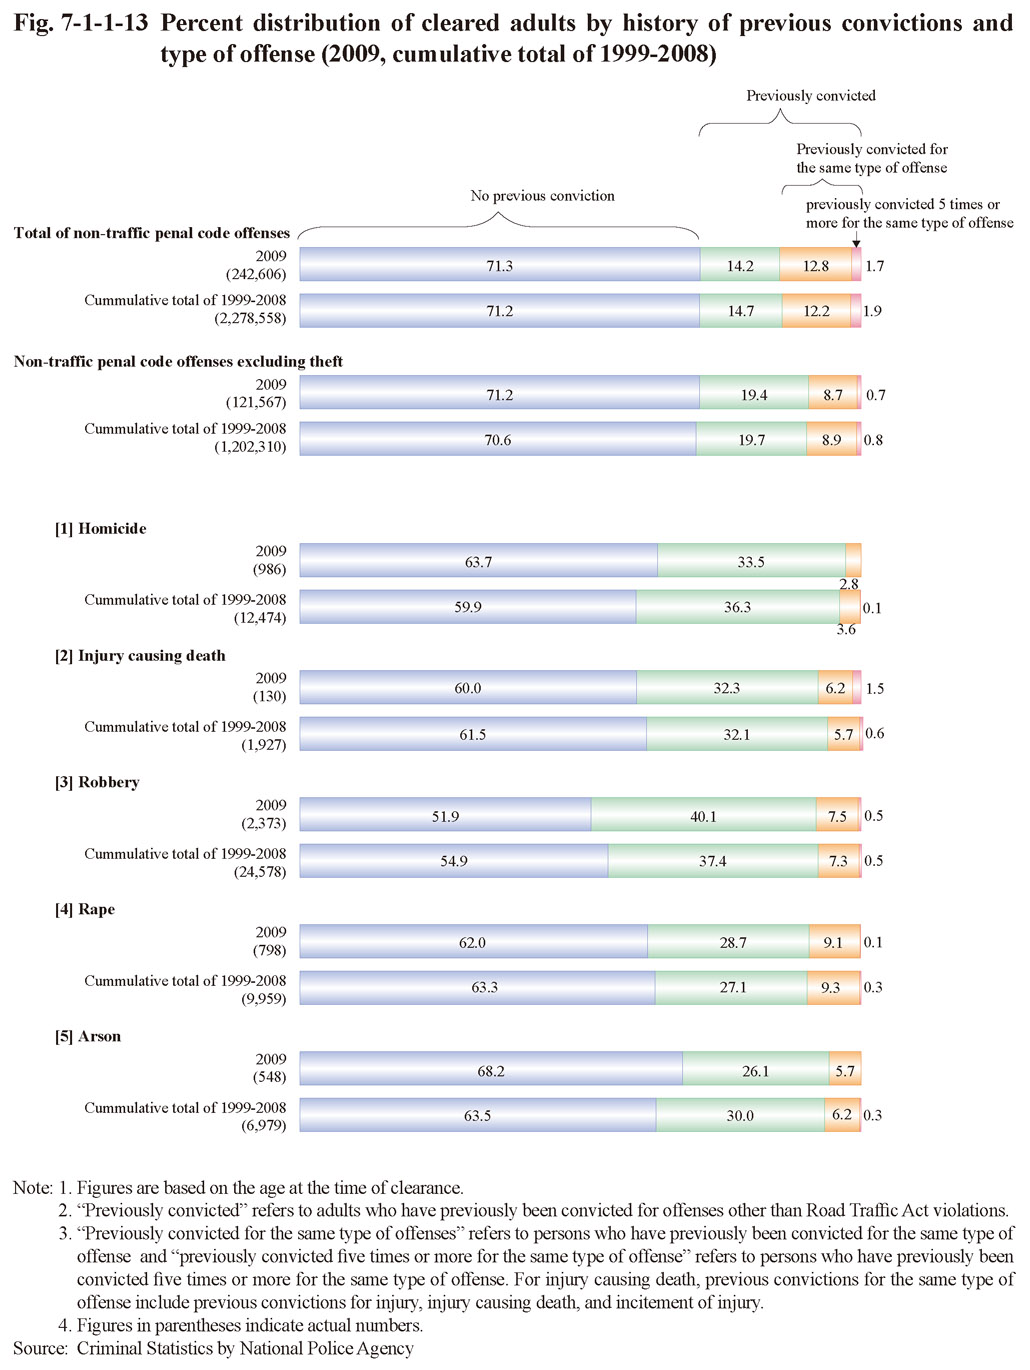
Fig. 7-1-1-13 shows the percent distribution of persons cleared for serious offenses in 2009 and of those in 1999-2008 (cumulative total) by history of previous convictions (limited to previous convictions for offenses other than Road Traffic Act violations; hereinafter the same in this subsection). The percentage of those with a previous conviction was higher for every type of serious offense than that for all non-traffic penal code offenses. Although the percentage of persons with a history of previous convictions for the same type of offense was not very high, approximately 3% for homicide, 8% for injury causing death and robbery, and 9% for rape, approximately 6% did have a history of previous convictions for the same type of offense.
Fig. 7-1-1-13 Percent distribution of cleared adults by history of previous convictions and type of offense (2009, cumulative total of 1999-2008)