Section 3 Treatment
1 Disposition in public prosecutors offices
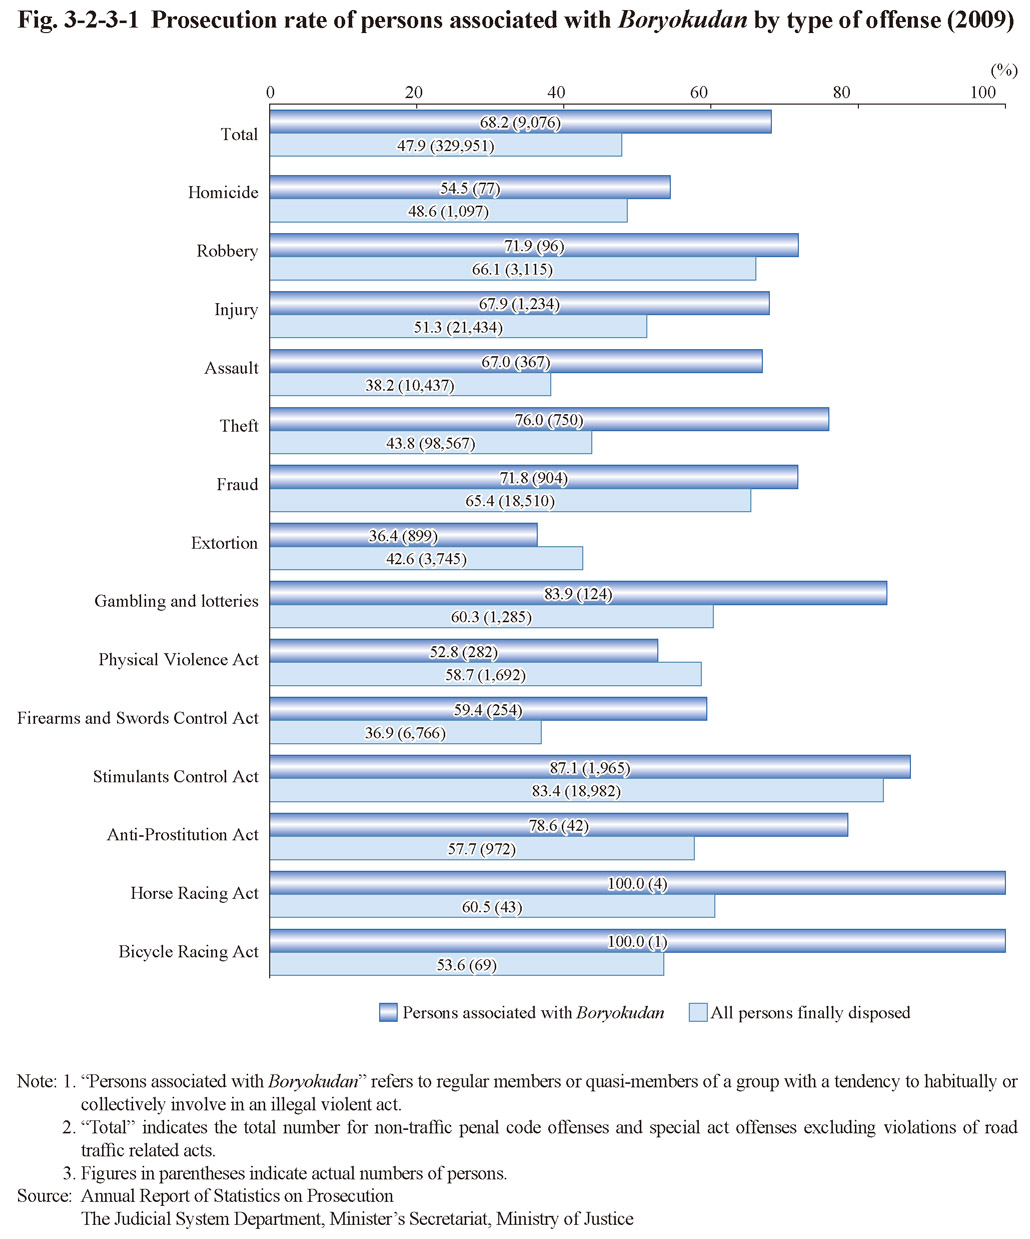
Fig. 3-2-3-1 shows the prosecution rate of persons associated with Boryokudan (refers to regular members and quasi-members of a group with a tendency to habitually or collectively involve in an illegal violent act) by type of offense in 2009 (See Appendix 2-3 for the prosecution rate over past years). The prosecution rate of persons associated with Boryokudan for non-traffic penal code offenses and special act offenses excluding violations of road traffic related acts was remarkably high at 68.2% when compared with that of total persons finally disposed in public prosecutors offices at 47.9%.
Fig. 3-2-3-1 Prosecution rate of persons associated with Boryokudan by type of offense (2009)