Chapter 6 Repeat Offenders
Section 1 Clearance
1 Repeat offenders cleared for non-traffic penal code offenses
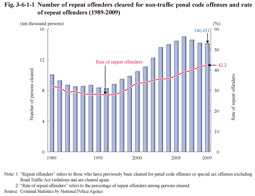
Fig. 3-6-1-1 shows the number of repeat offenders (refers to those who have been cleared for penal code offenses or special act offenses but excluding Road Traffic Act violations; hereinafter the same in this subsection) cleared for non-traffic penal code offenses and the rate of repeat offenders (refers to the percentage of repeat offenders of those cleared for non-traffic penal code offenses; hereinafter the same in this subsection) from 1989 on (for juveniles with a history of delinquency see Subsection 2, Section 5, Chapter 1, Part 7). The number of repeat offenders cleared for non-traffic penal code offenses continued to increase from 1997 on but then decreased slightly over three consecutive years from 2007 on, and was 140,431 in 2009 (down 0.4% from the previous year). The rate of repeat offenders continued to consistently increase from 1997 on and was 42.2% (up 0.7 points (id.)) in 2009.
Fig. 3-6-1-1 Number of repeat offenders cleared for non-traffic penal code offenses and rate of repeat offenders (1989-2009)
