2 Firearm offenses
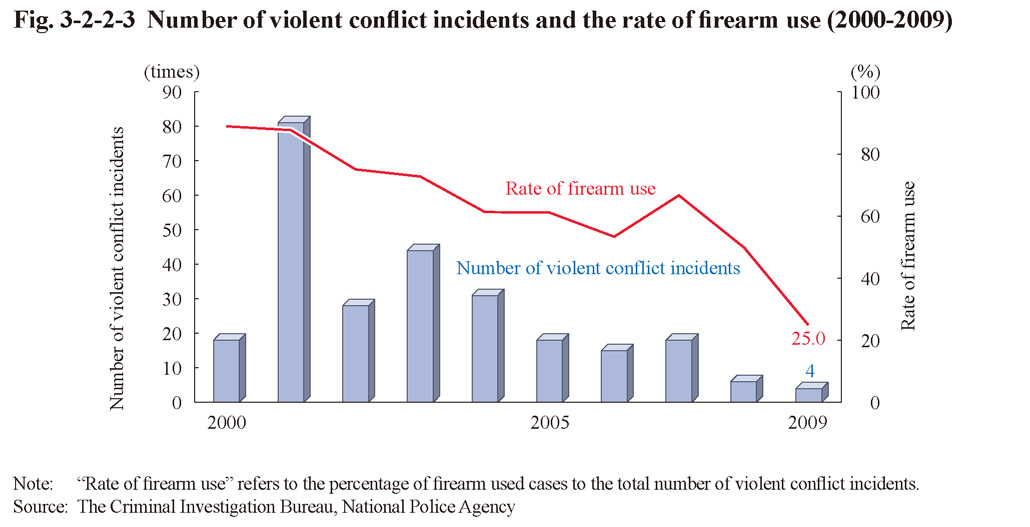
(1) Violent conflicts
Fig. 3-2-2-3 shows the number of violent conflict incidents between Boryokudans and the rate of firearm (refers to handguns, rifles, machine guns, artillery, hunting guns, and other guns that have the function of firing metal bullets, and air guns) use (the percentage of firearm used cases to the total number of violent conflict incidents) over the last 10 years.
Fig. 3-2-2-3 Number of violent confl ict incidents and the rate of firearm use (2000-2009)
(2) Firing incidents
Fig. 3-2-2-4 shows the number of firing incidents and persons killed in these incidents over the last 10 years.
Fig. 3-2-2-4 Number of firing incidents and persons killed (2000-2009)
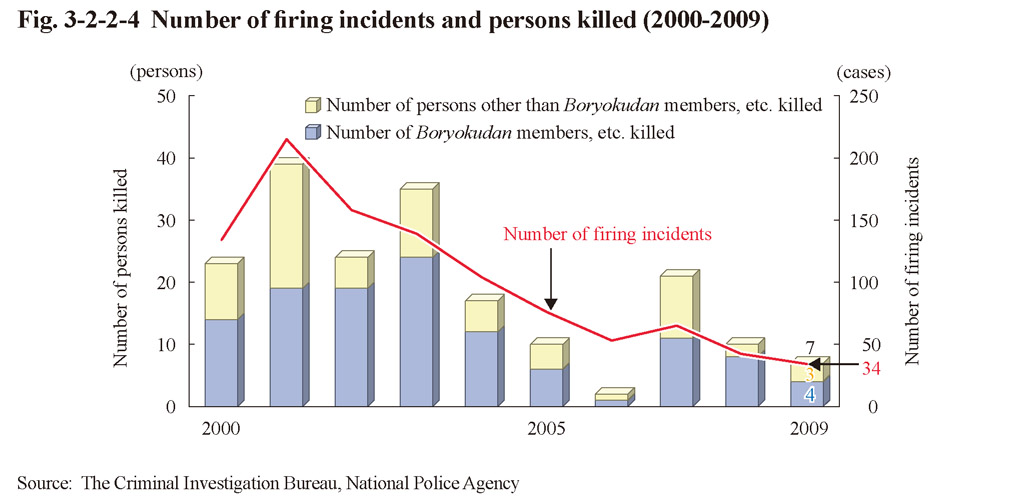
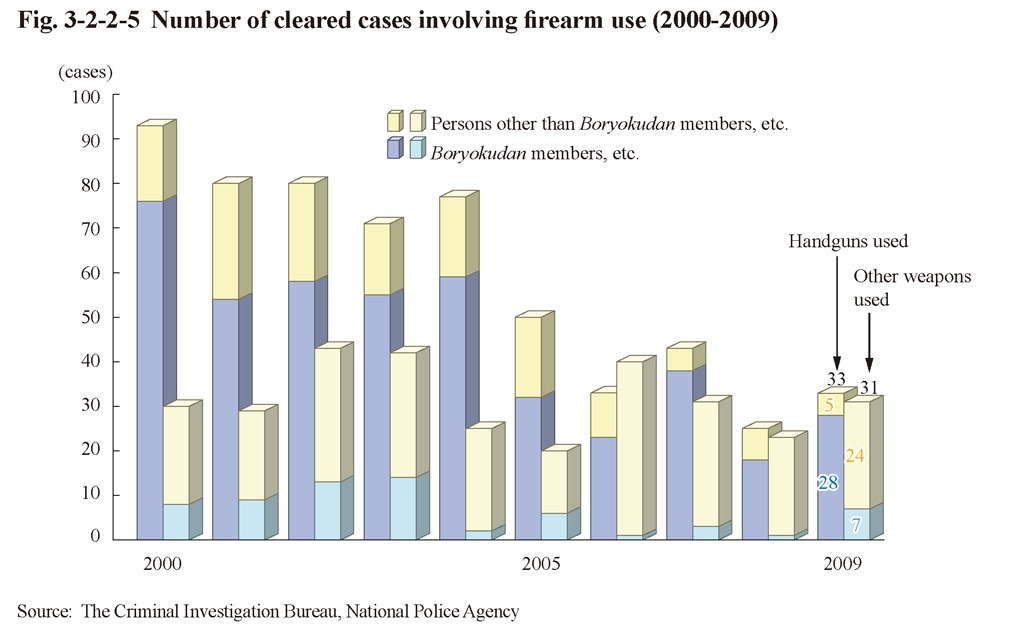
Fig. 3-2-2-5 shows the number of cleared cases involving firearm use, by whether the firearms were handguns or other weapons, over the last 10 years.
Fig. 3-2-2-5 Number of cleared cases involving firearm use (2000-2009)
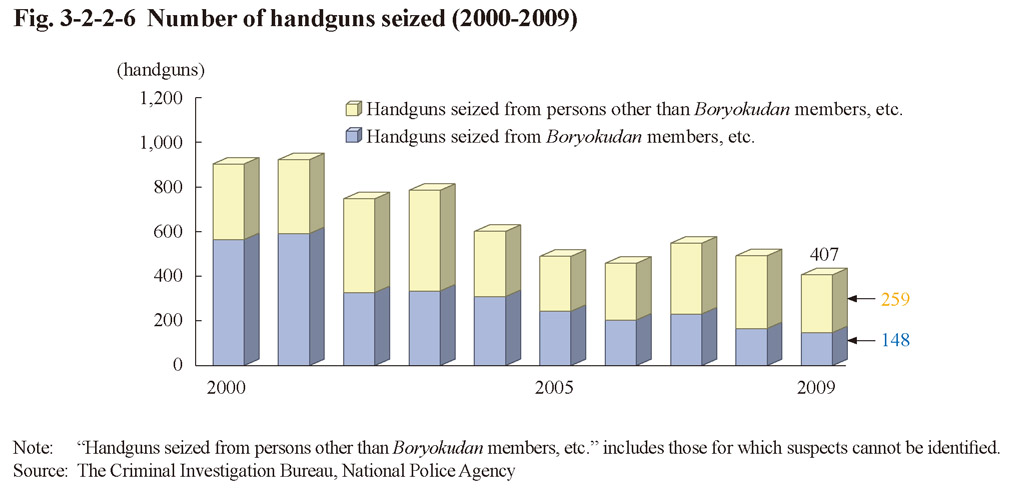
(3) Trends in seizure of handguns
Fig. 3-2-2-6 shows the number of handguns seized over the last 10 years. The number of handguns seized in 2009 was 407 (down 85 or 17.3% from the previous year), of which 379 (93.1%) were genuine handguns. With respect to the country in which the seized genuine handguns had been manufactured, the U.S.A. was the largest in number (104), followed by Japan (71), Belgium (32), China (23), Germany (22), Brazil (16), Russia (14), and the Philippines (13) (Source: The Criminal Investigation Bureau, National Police Agency).
Fig. 3-2-2-6 Number of handguns seized (2000-2009)