5 History of protective measures for new inmates
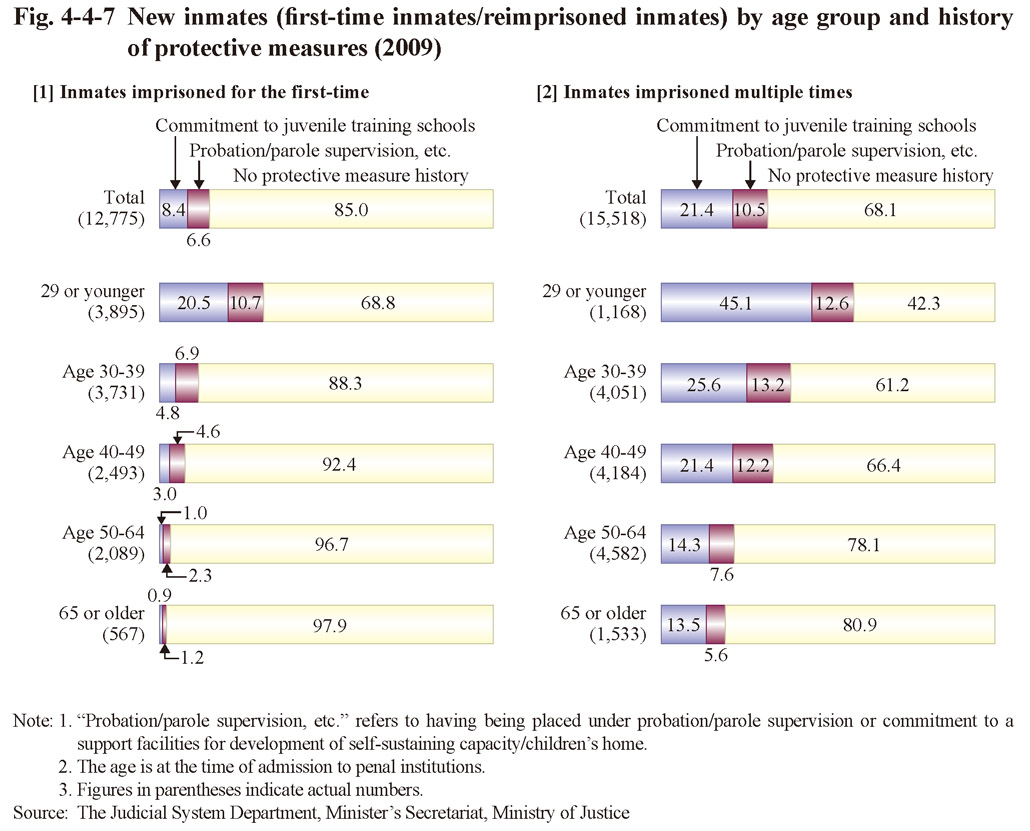
Fig. 4-4-7 shows the percent distribution of new inmates by history of protective measures, imprisonment record, and age group in 2009. The percentage of juveniles with a history of protective measures rose as the age of the group fell. In addition, the percentage of those with a history of protective measures was remarkably high with those imprisoned multiple times, when compared to those imprisoned for the first-time across every age group.
Fig. 4-4-7 New inmates (first-time inmates/reimprisoned inmates) by age group and history of protective measures (2009)