WHITE PAPER ON CRIME 2011
— Picture of Juvenile and Young Offenders and Preventive Measures against their Reoffending —
PART 1 Crime Trends in 2010
Chapter 1 Penal Code Offenses
 Fig. 1-1-1-1 Numberof reported cases, persons cleared, and clearance rate for penal code offenses (1946-2010)
Section 1 Principal Data
1 Reported cases and crime rate
Table 1-1-1-2 Number of reported cases, crime rate, number of cleared cases/persons, and clearance rate for penal code offenses by type of offense (2010)
Fig. 1-1-1-3 Percent distribution of reported cases and persons cleared for penal code offenses by type of offense (2010)
Fig. 1-1-1-4 Number of reported cases for non-traffic penal code offenses excluding theft by type of offense (1991-2010)
2 Persons cleared
Fig. 1-1-1-5 Percent distribution of persons cleared for non-traffic penal code offenses by age group (1981-2010)
Fig. 1-1-1-6 Number of females cleared for non-traffic penal code offenses and rate per population (1946-2010)
Table 1-1-1-7 Number of persons cleared for non-traffic penal code offenses by type of offense and gender (2010)
Section 2 Non-traffic Penal Code Offenses
1 Theft
Fig. 1-1-2-1 Number of reported/cleared cases and clearance rate for theft (1981-2010)
Fig. 1-1-2-2 Percent distribution of reported cases for theft by modus operandi (2010)
Fig. 1-1-2-3 Number of reported cases for theft by modus operandi (1991-2010)
2 Non-traffic penal code offenses excluding theft
Fig. 1-1-2-4 Number of reported/cleared cases and clearance rate for non-traffic penal
Fig. 1-1-2-5 Number of reported/cleared cases and clearance rate for non-traffic penal code offenses (major offenses) (1991-2010)
Table 1-1-2-6 Number of reported cases for robbery by modus operandi (2010)
Table 1-1-2-7 Number of reported cases for injury, assault, and intimidation by place of occurrence (2010)
Fig. 1-1-2-8 Number of reported/cleared cases and amount of damage resulting from billing fraud (extortion) (2006-2010)
Table 1-1-2-9 Number of reported cases for rape/forcible indecency by place of occurrence (2010)
Table 1-1-2-10 Number of reported cases for damage to property by damaged property (2010)
Table 1-1-2-11 Number of persons newly received and conclusively disposed in public prosecutors offices for acceptance of bribe (2010)
Table 1-1-2-12 Number of public officials newly received and conclusively disposed in public prosecutors offices by type of offense (2010)
Fig. 1-1-2-13 Number of persons newly received by public prosecutors for Organized Crime Punishment Act violations and amount of money confiscated/collected in a court of first instance (2001-2010)
Chapter 2 Special Act Offenses
Section 1 Principal Data
Fig. 1-2-1-1 Number of persons newly received by public prosecutors for special act offenses (1949-2010)
Fig. 1-2-1-2 Percent distribution of persons newly received by public prosecutors for special act offenses excluding violations of road traffic related acts by type of offense (2010)
Section 2 Major Special Act Offenses
1 Public security
Fig. 1-2-2-1 Number of persons newly received by public prosecutors for public security
2 Environment/public morals
Fig. 1-2-2-2 Number of persons newly received by public prosecutors for environment/public morals related special act offenses (1991-2010)
3 Child Welfare Act violations, etc.
Fig. 1-2-2-3 Number of persons newly received by public prosecutors for Child Welfare Act violations, etc. (1991-2010)
4 Anti-Stalking Act violations, etc.
Fig. 1-2-2-4 Number of persons newly received by public prosecutors for Anti-Stalking Act
5 Public Offices Election Act violations
Table 1-2-2-5 Number of persons newly received by public prosecutors for Public Offices Election Act violations (2001-2010)
Chapter 3 Various Types of Offenses
Section 1 Traffic Offenses
1 Trends in traffic offenses
Fig. 1-3-1-1 Number of traffic accidents and persons killed/injured in traffic accidents(1946-2010)
Fig. 1-3-1-2 Number of hit-and-run cases and clearance rate (1992-2010)
Fig. 1-3-1-3 Number of referred cases for violations of road traffic related acts (1991-2010)
Fig. 1-3-1-4 Percent distribution of notified/referred cases for violations of road traffic related acts by type of violation (2010)
2 Disposition in public prosecutors offices
Fig. 1-3-1-5 Percent distribution of persons conclusively disposed in public prosecutors offices for traffic cases by type of disposition (2010)
Fig. 1-3-1-6 Percent distribution of indicted cases for dangerous driving causing death or injury by type of violation (2010)
3 Disposition in courts
Fig. 1-3-1-7 Percent distribution of persons sentenced to imprisonment (with or without work) in a court of first instance for dangerous driving causing death or injury, etc. by term of imprisonment (2010)
Section 2 Financial and Economic Offenses
1 Tax related offenses
Fig. 1-3-2-1 Number of persons newly received by public prosecutors for violations of tax related acts (1991-2010)
Table 1-3-2-2 Number of accused cases for violations of tax related acts and amount of tax evasion per case (FY 2006-FY 2010)
Table 1-3-2-3 Number of persons prosecuted or not prosecuted for violations of tax related acts (2006-2010)
2 Economic offenses
Fig. 1-3-2-4 Number of persons newly received by public prosecutors for obstruction of compulsory execution, etc. (1991-2010)
Table 1-3-2-5 Number of persons prosecuted or not prosecuted for obstruction of compulsory execution, etc. (2006-2010)
Fig. 1-3-2-6 Number of persons newly received by public prosecutors for violations of the Commercial Code/Companies Act, etc. (1991-2010)
Table 1-3-2-7 Number of persons prosecuted or not prosecuted for violations of the Commercial Code/ Companies Act, etc. (2006-2010)
Fig. 1-3-2-8 Number of persons newly received by public prosecutors for Investment Act violations, etc. (1991-2010)
Table 1-3-2-9 Number of persons prosecuted or not prosecuted for Investment Act violations, etc. (2006-2010)
3 Intellectual property related offenses
Fig. 1-3-2-10 Number of persons newly received by public prosecutors for Trademark Act violations, etc. (1991-2010)
Table 1-3-2-11 Number of persons prosecuted or not prosecuted for Trademark Act violations, etc. (2006-2010)
Section 3 High-Technology Offenses
1 Trends in high-technology offenses
Table 1-3-3-1 Number of cleared cases for offenses involving computers or electromagnetic records, etc. (2006-2010)
Table 1-3-3-2 Number of cleared cases for offenses using cyber networks (2006-2010)
Table 1-3-3-3 Number of reported cases of computer viruses (2001-2010)
2 Disposition in public prosecutors offices
Table 1-3-3-4 Number of persons conclusively disposed in public prosecutors offices for high-technology offenses (2010)
Chapter 4 Comparison of Crime Trends with Other Countries
Section 1 Major Offenses
Table 1-4-1-1 Number of reported cases, crime rate, and clearance rate for major offenses in each of the subject countries (2000-2009)
Section 2 Homicide
Table 1-4-2-1 Number of reported cases, crime rate, and clearance rate for homicide in each of the subject countries (2005-2009)
Section 3 Theft
Table 1-4-3-1 Number of reported cases, crime rate, and clearance rate for theft in each of the subject countries (2005-2009)
Chapter 5 Offenses Committed by and against Japanese Nationals Outside of Japan
Section 1 Offenses Committed by Japanese Nationals Outside of Japan
Table 1-5-1-1 Number of cases committed by Japanese nationals outside of Japan (2010)
Section 2 Offenses Committed against Japanese Nationals Outside of Japan
Table 1-5-2-1 Number of cases committed against Japanese nationals outside of Japan (2010)
PART 2 Treatment of Offenders
Chapter 1 Overview
Fig. 2-1-1 Flow of Criminal Justice Procedure (adults)
Chapter 2 Prosecution
Section 1 Reception of Suspected Cases
Fig. 2-2-1-1 Percent distribution of persons newly received by public prosecutors by type of offense (2010)
Table 2-2-1-2 Percent distribution of persons newly received by public prosecutors by type of reception (2010)
Section 2 Arrest and Detention of Suspects
Table 2-2-2-1 Number of persons arrested or detained in cases disposed by public prosecutors by type of offense (2010)
Fig. 2-2-2-2 Detention request rejection rate (1991-2010)
Section 3 Disposition in Public Prosecutors Offices
Fig. 2-2-3-1 Percent distribution of persons conclusively disposed in public prosecutors offices by type of disposition and number of persons indicted, etc. (2001-2010)
Fig. 2-2-3-2 Number of persons prosecuted/not prosecuted, etc. by type of offense (2001-2010)
Table 2-2-3-3 Number of persons not prosecuted by reason (2001-2010)
Chapter 3 Trial
Section 1 Final Judgments
Table 2-3-1-1 Number of persons finally judged by type of judgment (1969, 1979, 1989, 1999-2010)
Section 2 Court of First Instance
1 Conclusive dispositions
Table 2-3-2-1 Number of persons conclusively disposed in a court of first instance by type ofoffense and judgment (2010)
2 Sentencing
Table 2-3-2-2 Number of persons sentenced to the death penalty or life imprisonment with work in a court of first instance by type of offense (2001-2010)
Table 2-3-2-3 Number of persons sentenced to imprisonment with or without work for a definite term in a court of first instance (2010)
Table 2-3-2-4 Number of persons sentenced to fine in a court of first instance by type of offense (2010)
3 Pretrial arrangement proceeding
Table 2-3-2-5 Number of persons involved in cases brought to a pretrial arrangementproceeding or inter-trial arrangement proceeding in district courts by type of offense (2010)
4 Speedy trial procedure
Table 2-3-2-6 Number of persons involved in cases brought to a speedy trial procedure by type of offense (2010)
5 Detention and bail
Table 2-3-2-7 Status of detention of defendants conclusively disposed in a court of firstinstance (2010)
Section 3 Summary Trial Procedure
Table 2-3-3-1 Sentencing in a summary trial procedure by type of offense (2010)
Section 4 Appeals
Table 2-3-4-1 Number of persons conclusively disposed in trials of appeal to the court of second instance by type of offense and judgment (2010)
Chapter 4 Correction of Adult Offenders
Section 1 Imprisonment in Penal Institutions
1 Number of inmates in penal institutions
Fig. 2-4-1-1 Number and rate per population of inmates in penal institutions (1991-2010)
2 Occupancy rate of penal institutions
Fig. 2-4-1-2 Occupancy rate of penal institutions (total/females)
3 Number of new inmates
Fig. 2-4-1-3 Number and rate per population of new inmates by gender (1991-2010)
Table 2-4-1-4 Number of inmates by reason for admission/release (2010)
4 Characteristics of new inmates
Fig. 2-4-1-5 Percent distribution of new inmates by gender and age group (2010)
Fig. 2-4-1-6 Percent distribution of new inmates by type of offense and gender (2010)
Fig. 2-4-1-7 Percent distribution of new inmates sentenced to imprisonment with work by term of imprisonment (2010)
Section 2 Treatment of Inmates, etc.
1 Overview of treatment
Fig. 2-4-2-1 Flow of treatment of inmates
Table 2-4-2-2 Number of inmates by treatment index code
Section 3 Administration of Penal Institutions
4 Maintenance of discipline and order
Table 2-4-3-1 Number of incidents that occurred at penal institutions (2010)
5 Appeal system
Table 2-4-3-2 Number of appeals filed by inmates (2006-2010)
Chapter 5 Rehabilitation Services
Section 1 Parole
2 Number of parolees
Fig. 2-5-1-1 Number and parole rate of released inmates (1949-2010)
3 Rate of served terms of imprisonment
Fig. 2-5-1-2 Percent distribution of inmates sentenced to imprisonment for a determinate term and granted release on parole by rate of served imprisonment term
4 Life imprisonment inmates granted release on parole
Table 2-5-1-3 Number of life imprisonment inmates granted parole (2001-2010)
Section 2 Probation/Parole Supervision
1 Number of probationers/parolees
Fig. 2-5-2-1 Number of persons newly placed under probation/parole supervision and probation rate (1949-2010)
Fig. 2-5-2-2 Percent distribution of persons newly placed under probation/parole supervision by age group (2010)
Fig. 2-5-2-3 Percent distribution of persons newly placed under probation/parole supervision by probation/parole supervision period (2010)
Fig. 2-5-2-4 Percent distribution of persons newly placed under probation/parole supervision by residential status (2010)
2 Treatment of probationers/parolees
Table 2-5-2-5 Number of probationers/parolees designated to each major treatment category (as of December 31, 2010)
4 Termination of probation/parole supervision
Fig. 2-5-2-6 Percent distribution of probationers/parolees whose probation/parole supervision terminated by reason (2010)
Fig. 2-5-2-7 Percent distribution of probationers/parolees by employment status at the commencement/termination of their probation/parole supervision (2010)
Section 3 Urgent Aftercare of Discharged Offenders
1 Urgent aid, etc. and aftercare of discharged offenders
Table 2-5-3-1 Status of implementation of urgent aid, etc. and urgent aftercare of discharged offenders (2010)
2 Halfway houses
Fig. 2-5-3-2 Number of persons newly entrusted to halfway houses (1991-2010)
Section 5 Volunteer Probation Officers, Private Supporters/Support Organizations, and Crime Prevention Activities
1 Volunteer probation officers
Fig. 2-5-5-1 Number of volunteer probation officers, female rate, and their average age (1982-2011)
Fig. 2-5-5-2 Percent distribution of volunteer probation officers by age group and occupation (as of January 1, 2011)
Section 2 Transnational Fugitives, their Extradition, and Transfer of Sentenced Persons
1 Transnational fugitives from Japan
Fig. 2-6-2-1 Number of transnational fugitives, etc. (2001-2010)
Table 2-6-2-2 Number of transnational fugitives, etc. by type of offense and nationality, etc.
2 Extradition of fugitives
Table 2-6-2-3 Number of fugitives extradited (2001-2010)
3 Transfer of sentenced persons
Table 2-6-2-4 Number of sentenced persons transferred from Japan by country where they served their sentences and type of offense (2010)
Section 3 Mutual Legal/Judicial Assistance in Criminal Matters
1 Assistance in investigations
Table 2-6-3-1 Number of requests made for legal assistance in investigations (2001-2010)
PART 3 Treatment of Juvenile Delinquents
Chapter 1 Protective Procedures for Juveniles
Section 1 Overview
Fig. 3-1-1-1 Flow of treatment procedure used with juvenile delinquents
Section 2 Disposition of Juvenile Cases at Public Prosecutors Offices/Courts
1 Public prosecutors offices (until referral to a family court)
Fig. 3-1-2-1 Number of juvenile offenders newly received by public prosecutors and rate per population by age group (1975-2010)
2 Family courts
Fig. 3-1-2-2 Number of juveniles newly received by family courts for juvenile protection cases (1949-2010)
Fig. 3-1-2-3 Percent distribution of juveniles conclusively disposed in family courts for juvenile protection cases by type of disposition (2010)
Table 3-1-2-4 Number of juveniles conclusively disposed in family courts for cases which have to be in principle referred to public prosecutors for prosecution by type of offense (2010)
Section 3 Classification in Juvenile Classification Homes
1 Admission and discharge
Fig. 3-1-3-1 Number of juveniles newly admitted to juvenile classification homes by gender and female rate (1949-2010)
Fig. 3-1-3-2 Percent distribution of juveniles detained in juvenile classification homes by age group and gender (1991-2010)
Fig. 3-1-3-3 Percent distribution of juveniles detained in juvenile classification homes by type of delinquency, gender, and age group (2010)
Fig. 3-1-3-4 Percent distribution of juveniles discharged from juvenile classification homes by reason for discharge (2010)
2 Classification activities
Fig. 3-1-3-5 Flow of institutional classification in juvenile classification homes
Table 3-1-3-6 Status of disposition in family courts by category of classification determination (2010)
Section 4 Treatment at Juvenile Training Schools
1 Juveniles newly admitted to juvenile training schools
Fig. 3-1-4-1 Number of juveniles newly admitted to juvenile training schools by gender and female rate (1949-2010)
Fig. 3-1-4-2 Number of juveniles newly admitted to juvenile training schools and rate per population by age group (1975-2010)
Fig. 3-1-4-3 Percent distribution of juveniles newly admitted to juvenile training schools by type of delinquency, gender, and age group (2010)
Fig. 3-1-4-4 Percent distribution of juveniles newly admitted to juvenile training schools by educational level and gender (2010)
Fig. 3-1-4-5 Percent distribution of juveniles newly admitted to juvenile training schools by educational/employment status and gender (2010)
Fig. 3-1-4-6 Percent distribution of juveniles newly admitted to juvenile training schools by association with delinquent groups and gender (2010)
Fig. 3-1-4-7 Percent distribution of juveniles newly admitted to juvenile training schools by guardian status and gender (2010)
2 Treatment provided at juvenile training schools
Table 3-1-4-8 Number of juveniles newly admitted to juvenile training schools by type of juvenile training school and treatment program (2010)
Table 3-1-4-9 Number of juveniles newly admitted to juvenile training schools by treatment course, etc. (2010)
Fig. 3-1-4-10 Percent distribution of discharged juveniles by qualification or license obtained (2010)
3 Discharged juveniles
Fig. 3-1-4-11 Percent distribution of juveniles discharged from juvenile training schools by guarantor after discharge and gender (2010)
Section 5 Probation/Parole Supervision for Juveniles
1 Juvenile probationers/parolees
Fig. 3-1-5-1 Number of juveniles newly placed under probation/parole supervision (1949-2010)
Fig. 3-1-5-2 Percent distribution of juveniles newly placed under probation/ parole supervision by age group (2010)
Fig. 3-1-5-3 Percent distribution of juveniles newly placed under probation/ parole supervision by type of delinquency and gender (2010)
Fig. 3-1-5-4 Percent distribution of juveniles newly placed under probation/ parole supervision by residential status (1991-2010)
Fig. 3-1-5-5 Percent distribution of juvenile probationers/parolees by educational/ employment status at the time of commencement/termination of their probation/ parole supervision (2010)
2 Treatment of juvenile probationers/parolees
Table 3-1-5-6 Number of juvenile probationers/parolees in each category (as of December 31, 2010)
4 Termination of probation/parole supervision for juveniles
Fig. 3-1-5-7 Percent distribution of juvenile probationers/juvenile training school parolees whose probation/parole supervision terminated by reason for termination (2010)
Section 2 Prosecution and Criminal Trials
1 Disposition in public prosecutors offices
Table 3-2-2-1 Number of juveniles conclusively disposed in public prosecutors offices for cases referred from family courts by type of offense and type of disposition (2010)
2 Sentencing in a court of first instance
Table 3-2-2-2 Sentencing of juveniles in a court of first instance by type of offense and judgment (2010)
Section 3 Juvenile Inmates
Fig. 3-2-3-1 Number of new juvenile inmates (1966-2010)
PART 4 Trends in Offenses by Specific Types of Offenders and Their Treatment
Chapter 1 Foreign National Offenders
Section 2 Trends in Offenses
1 Penal code offenses
Fig. 4-1-2-1 Number of cases and persons cleared for non-traffic penal code offenses committed by foreign nationals (1980-2010)
Fig. 4-1-2-2 Percent distribution of cleared cases for non-traffic penal code offenses committed by visiting foreign nationals by type of offense (2010)
Fig. 4-1-2-3 Number of cleared cases for theft, etc. committed by visiting foreign nationals(2001-2010)
Fig. 4-1-2-4 Percent distribution of cleared cases for theft committed by visiting foreign nationals by modus operandi (2010)
2 Special act offenses
Fig. 4-1-2-5 Number of cases and persons referred to public prosecutors for special act offenses committed by foreign nationals (1980-2010)
Fig. 4-1-2-6 Number of cases referred to public prosecutors for Immigration Control Act violations, etc. committed by visiting foreign nationals (2001-2010)
Section 3 Treatment
1 Disposition in public prosecutors offices
Fig. 4-1-3-1 Percent distribution by suspect’s nationality, etc. of visiting foreign national suspects newly received by public prosecutors (2010)
Fig. 4-1-3-2 Number of visiting foreign national suspects conclusively disposed in public prosecutors offices (2001-2010)
Table 4-1-3-3 Number of foreign national suspects conclusively disposed in publi prosecutors offices by type of offense (2010)
2 Disposition in courts
Fig. 4-1-3-4 Number of persons convicted (those sentenced to imprisonment with/without work) in cases requiring interpreters in a court of first instance (2001-2010)
3 Correction
Fig. 4-1-3-5 Number of new Class F inmates by gender (1991-2010)
Section 4 Trends and Treatment of Foreign National Juvenile Delinquents
1 Trends in foreign national juvenile offenders
Fig. 4-1-4-1 Number of foreign national juvenile offenders referred to family courts (1993-2010)
2 Treatment of foreign national juvenile delinquents
Fig. 4-1-4-2 Percent distribution of foreign national juveniles detained in juvenile classification homes by nationality, etc. (2010)
Fig. 4-1-4-3 Percent distribution of foreign national juveniles newly admitted to juvenile training schools by nationality, etc. (2010)
Chapter 2 Offenders Belonging to Organized Crime Groups
Section 1 Trends with Organized Crime Group Members
Table 4-2-1-1 Number of organized crime group members, etc. (2001-2010)
Section 2 Trends in Offenses
1 Persons cleared
Fig. 4-2-2-1 Number of organized crime group members, etc. cleared (1981-2010)
Table 4-2-2-2 Number of organized crime group members cleared by type of offense (2010)
2 Firearm offenses
Fig. 4-2-2-3 Number of violent conflict incidents between organized crime groups and rate of firearm use (2001-2010)
Fig. 4-2-2-4 Number of firing incidents and persons killed (2001-2010)
Fig. 4-2-2-5 Number of cleared cases involving use of firearms (2001-2010)
Fig. 4-2-2-6 Number of handguns seized (2001-2010)
Section 3 Treatment
1 Disposition in public prosecutors offices
Fig. 4-2-3-1 Prosecution rate for persons belonging to organized crime groups by type of offense (2010)
2 Correction
Fig. 4-2-3-2 Number of new inmates who belonged to organized crime groups (1980-2010)
Fig. 4-2-3-3 Percent distribution of new inmates who belonged to or who did not belong to organized crime groups by type of offense (2010)
Fig. 4-2-3-4 Percent distribution of new inmates who belonged to or who did not belong to organized crime groups by history of imprisonment (2010)
Chapter 3 Drug Offenders
Section 1 Trends in Offenses
1 Stimulants Control Act violations
Fig. 4-3-1-1 Number of persons cleared for Stimulants Control Act violations (1951-2010)
Fig. 4-3-1-2 Number of persons cleared for Stimulants Control Act violations by age group (1981-2010)
Table 4-3-1-3 Number of persons cleared for Stimulants Control Act violations: number of for-profit offenders, number of organized crime group members, etc. and number of foreign nationals (by nationality, etc.), by type of violation (2010)
2 Cannabis Control Act violations, etc.
Fig. 4-3-1-4 Number of persons cleared for Cannabis Control Act violations, etc. (1981-2010)
3 Poisonous and Deleterious Substances Control Act violations
Fig. 4-3-1-5 Number of persons referred for Poisonous and Deleterious Substances Control Act violations (1981-2010)
Section 2 Status of Regulations
1 Seizure of stimulants, etc.
Table 4-3-2-1 Amount of stimulants, etc. seized (2006-2010)
2 Implementation of the Act on Special Provisions for Narcotics
Fig. 4-3-2-2 Number of cleared cases for Act on Special Provisions for Narcotics violations and amount of money confiscated/collected in a court of first instance (2006-2010)
Section 3 Treatment
1 Disposition in public prosecutors offices
Table 4-3-3-1 Prosecution rate for Stimulants Control Act violations, etc. (2010)
2 Disposition in courts
Fig. 4-3-3-2 Percent distribution of persons convicted for Stimulants Control Act violations in a court of first instance by term of imprisonment (1981-2010)
3 Correction
Fig. 4-3-3-3 Number of new inmates for Stimulants Control Act violations (1991-2010)
Fig. 4-3-3-4 Percent distribution of new inmates for Stimulants Control Act violations by age group (2010)
4 Probation/parole supervision
Fig. 4-3-3-5 Number of persons newly placed under probation/parole supervision for Stimulants Control Act violations (1991-2010)
Chapter 4 Elderly Offenders
Section 1 Trends in Offenses
Fig. 4-4-1-1 Number of persons cleared for non-traffic penal code offenses by age group (1991-2010)
Fig. 4-4-1-2 Rate per population of persons cleared for non-traffic penal code offenses by age group (1991-2010)
Fig. 4-4-1-3 Percent distribution of elderly offenders cleared for non-traffic penal code offenses by gender and type of offense (2010)
Fig. 4-4-1-4 Number of elderly persons cleared by type of offense (1991-2010)
Section 2 Treatment
1 Disposition in public prosecutors offices
Fig. 4-4-2-1 Suspended prosecution rate for non-traffic penal code offenses by type of offense and age group (2010)
2 Correction
Fig. 4-4-2-2 Number of new elderly inmates by history of imprisonment (1991-2010)
Fig. 4-4-2-3 Percent distribution of new elderly inmates by gender and type of offense (2010)
3 Probation/parole supervision
Fig. 4-4-2-4 Number of elderly persons newly placed under probation/parole supervision and parole rate (2001-2010)
Chapter 5 Offenders with Mental Disorders
Section 1 Trends in Offenses
Fig. 4-5-1-1 Number of persons with mental disorders, etc. cleared for non-traffic penal code offenses (2001-2010)
Table 4-5-1-2 Number of persons with mental disorders, etc. cleared for non-traffic penal code offenses by type of offense (2010)
Section 2 Status of Criminal Proceedings
2 Correction
Table 4-5-2-1 Number of new inmates in penal institutions and juveniles newly admitted to juvenile training schools diagnosed as having mental disorders (2010)
Section 3 Medical Care and Treatment System for Insane Persons, etc.
Fig. 4-5-3-1 Flow of procedure provided by the Act on Medical Care and Treatment for Insane Persons, etc.
1 Hearings
Fig. 4-5-3-2 Number of persons for whom public prosecutors applied for hearings / conclusively disposed at district court hearings (2006-2010)
Table 4-5-3-3 Number of persons for whom public prosecutors applied for hearings and number of persons conclusively disposed at district court hearings by type of designated act (2010)
2 Medical care through hospitalization
Fig. 4-5-3-4 Disposition of cases involving living arrangements (2006-2010)
4 Treatment within local communities
Fig. 4-5-3-5 Disposition of cases involving mental health supervision (2006-2010)
Chapter 6 Repeat Offenders
Section 1 Clearance
1 Repeat offenders cleared for non-traffic penal code offenses
Fig. 4-6-1-1 Number and rate of repeat offenders cleared for non-traffic penal code offenses (1991-2010)
2 Previously convicted adults cleared for non-traffic penal code offenses
Fig. 4-6-1-2 Number and rate of previously convicted adults cleared for non-traffic penal code offenses (1991-2010)
Fig. 4-6-1-3 Percent distribution of adults cleared for non-traffic penal code offenses by history of previous convictions and type of offense (2010)
Section 2 Prosecution/Trial
1 Previously convicted persons among those prosecuted
Table 4-6-2-1 Number and rate of persons prosecuted who have previously been convicted with the status at the time of the offense by type of offense (2010)
2 Revocation of suspension of execution of the sentence
Table 4-6-2-2 Number of persons who were granted suspension of execution of the sentence/who had their suspension of execution of the sentence revoked, etc. (1991-2010)
Section 3 Correction
1 Inmates reimprisoned
Fig. 4-6-3-1 Number of inmates imprisoned for the first time/reimprisoned and rate of reimprisoned inmates (total/females) (1991-2010)
Fig. 4-6-3-2 Percent distribution of new inmates by history of imprisonment (total/females) (2010)
2 Reimprisonment of released inmates
Fig. 4-6-3-3 Cumulative percentage of reimprisonment of released inmates by reason for release
Fig. 4-6-3-4 Cumulative percentage of reimprisonment of released inmates by history of imprisonment
3 Employment status
Fig. 4-6-3-5 Percent distribution of new inmates by employment status and history of imprisonment (cumulative total for 2006-2010)
Section 4 Probation/Parole Supervision
1 Status of probationers/parolees
Fig. 4-6-4-1 Number of persons newly placed under probation/parole supervision by history of criminal disposition and rate of previously convicted persons (2001-2010)
2 Redisposition of probationers/parolees
Table 4-6-4-2 Redisposition rate, revocation rate, etc. of persons whose probation/parole supervision terminated
Table 4-6-4-3 Revocation of parole/suspension of execution of the sentence with probation
PART 5 Crime Victims
Chapter 1 Official Statistics on Damage Caused by Offenses
Section 1 Number of Cases Involving Human Victims
Fig. 5-1-1-1 Number of reported cases for non-traffic penal code offenses involving human victims and victim rate by gender (2001-2010)
Fig. 5-1-1-2 Percent distribution of victims of reported cases for non-traffic penal code offenses involving human victims by age group (2010)
Section 2 Bodily Damage
Table 5-1-2-1 Number and rate per population of victims of non-traffic penal code offenses involving fatal/bodily damage (2001-2010)
Section 3 Property Damage
Table 5-1-3-1 Number of reported cases and amount of damages resulting from property offenses by type of offense (2001-2010)
Section 4 Damage Caused by Sexual Offenses
Table 5-1-4-1 Number of reported cases and victim rate for rape and forcible indecency (2001-2010)
Section 5 Relationship between Victims and Suspects
Fig. 5-1-5-1 Percent distribution of cleared cases by relationship between victim and suspect and type of offense (2010)
Section 6 Child Victims
1 Damages from penal code offenses
Table 5-1-6-1 Number of child victims younger than 13 resulting from penal code offenses by type of offense (2001-2010)
2 Child abuse
Table 5-1-6-2 Number of cases and persons cleared for cases involving child abuse by type of offense (2001-2010)
Table 5-1-6-3 Number of persons cleared in cases involving child abuse by relationship between victim and perpetrator and type of offense (2010)
Chapter 2 Consideration for Victims within the Criminal Proceedings
Section 1 Involvement of Victims in Criminal Proceedings
1 Appeal system against non-prosecution
Table 5-2-1-1 Number of persons received and disposed by Committees for Inquest of Prosecution (2006-2010)
Table 5-2-1-2 Subsequent dispositions in cases decided upon as being appropriate for prosecution or inappropriate for non-prosecution by reason of the initial disposition of non-prosecution (2006-2010)
2 Victim participation, etc. in trials
Table 5-2-1-3 Status of implementation of systems for victims, etc. at trial stage
PART 6 Criminal Justice System Reforms
Fig. 6-1-1 Overview of criminal justice system reforms
Section 2 Lay Judge System
1 Overview of lay judge system
Fig. 6-2-1 Flow of lay judge selection procedure
2 Implementation status of lay judge system
Table 6-2-2 Number of persons newly received/conclusively disposed in a court of first instance in lay judge trial cases by type of offense
Table 6-2-3 Number of persons judged in lay judge trials in a court of first instance and denominator of probability to be selected as a lay judge by district court (2010)
Table 6-2-4 Selection status of lay judges, etc. in lay judge trial cases (2010)
Fig. 6-2-5 Percent distribution of persons judged in lay judge trials by number of trials and trial period (2010)
Table 6-2-6 Number of persons judged in a court of first instance in lay judge trial cases by type of offense and judgment (2010)
Fig. 6-2-7 Percent distribution of sentencing in a lay judge/judge trial by type of offense (total of 2009 and 2010)
PART 7 Picture of Juvenile and Young Offenders and Preventive Measures against their Reoffending
Chapter 1 Current Situation surrounding Japanese Youth
Fig. 7-1-1 Population of criminally responsible juveniles (aged 14-19) and young people, etc. by age group (1989-2010)
Fig. 7-1-2 Divorce rate and number of single parent households (1989-2010)
Fig. 7-1-3 Number of child abuse consultation cases handled (FY 1999-2010)
Fig. 7-1-4 Employment rate by educational level (1989-2010)
Fig. 7-1-5 Turnover rate within one year after employment by educational level (1989-2010)
Fig. 7-1-6 Unemployment rate of youth by age group (1989-2010)
Fig. 7-1-7 Number of young non-working people by age group (2000-2010)
Chapter 2 Trends with Juvenile/Young Offenders
Section 1 Guidance/Clearance
1 Penal code offenses
Fig. 7-2-1-1-1 Number and rate per population of juvenile/young offenders cleared for non-traffic penal code offenses, etc.
Fig. 7-2-1-1-2 Number and rate per population of juveniles cleared for non-traffic penal code offenses by age group (1966-2010)
Fig. 7-2-1-1-3 Percent distribution of persons cleared for non-traffic penal code offenses by age group (2010)
Fig. 7-2-1-1-4 Delinquency rate of juveniles
Fig. 7-2-1-1-5 Number and rate per population of juveniles cleared for non-traffic penal code offenses by gender (1966-2010)
Fig. 7-2-1-1-6 Percent distribution of juveniles cleared for non-traffic penal code offenses by educational/employment status (2010)
Table 7-2-1-1-7 Number of juvenile/young offenders cleared for non-traffic penal code offenses and juvenile/young offender rate by type of offense (2010)
Fig. 7-2-1-1-8 Percent distribution of juvenile/young offenders cleared for non-traffic penal code offenses by type of offense and age group (2010)
Fig. 7-2-1-1-9 Rate per population of juvenile/young offenders cleared for major non-traffic penal code offenses (1989-2010)
Fig. 7-2-1-1-10 Rate per population of persons cleared for non-traffic penal code offenses by type of offense and age group (2010)
Fig. 7-2-1-1-11 Percent distribution of persons cleared for theft by modus operandi and age group (2010)
Fig. 7-2-1-1-12 Complicity rate, etc. of cleared juvenile cases for non-traffic penal code offenses by type of offense
2 Special act offenses
Fig. 7-2-1-2-1 Number of juveniles referred to public prosecutors for special act offenses (1956-2010)
Fig. 7-2-1-2-2 Number of juvenile/young offenders cleared for drug offenses by age group (2010)
Fig. 7-2-1-2-3 Number of notified/referred cases for violations of road traffic related acts committed by juveniles (1989-2010)
Fig. 7-2-1-2-4 Percent distribution of notified/referred cases for violations of road traffic related acts committed by juveniles by type of violation (2010)
Fig. 7-2-1-2-5 Number of hot rodders and hot rodder groups (1978-2010)
3 Pre-delinquents
Fig. 7-2-1-3-1 Number of pre-delinquents conclusively disposed in family courts by type of pre-delinquency and female rate (1969-2010)
4 Delinquency at home and at school
Fig. 7-2-1-4-1 Number of reported cases for violence in family committed by juveniles by educational/employment status (1988-2010)
Fig. 7-2-1-4-2 Number of cases and persons cleared/guided by the police for violence occurring at schools (1978-2010)
Section 2 Prosecution/Trial
1 Reception and disposition in public prosecutors offices
Fig. 7-2-2-1 Number and rate per population of juvenile offenders newly received by public prosecutors by type of offense (1989-2010)
Table 7-2-2-2 Number of persons disposed by public prosecutors by type of offense and age group (2010)
2 Conclusive disposition in family courts
Fig. 7-2-2-3 Percent distribution of persons conclusively disposed in family courts by type of disposition and type of delinquency (2001-2010)
Fig. 7-2-2-4 Number of persons committed to children’s self-reliance support facilities, etc. in non-traffic protection cases conclusively disposed in family courts by age group (1980-2010)
3 Prosecution in public prosecutors offices
Fig. 7-2-2-5 Rate per population of persons prosecuted for non-traffic penal code offenses by age group (1989-2010)
Fig. 7-2-2-6 Suspended prosecution rate for non-traffic penal code offenses by age group (1989-2010)
Fig. 7-2-2-7 Rate of previously convicted persons of young offenders prosecuted by type of offense and age group (2010, cumulative total of 2005-2010)
4 Criminal trials
Table 7-2-2-8 Number of juvenile/young offenders granted suspension of execution of the sentence in district courts (2001-2010)
Table 7-2-2-9 Number of persons sentenced to imprisonment with or without work for a definite term with or without suspension of execution of the sentence in district courts by type of offense and age group (cumulative total of 2008-2010)
Section 3 Correction
1 Juveniles newly admitted to juvenile training schools and new inmates in penal institutions
Fig. 7-2-3-1 Number of juveniles newly admitted to juvenile training schools and inmates newly imprisoned for the first time/second time or more (readmitted/reimprisoned) by age group (2010)
Fig. 7-2-3-2 Number of juveniles newly admitted to juvenile training schools and young inmates newly imprisoned for the first time/second time or more (readmitted/reimprisoned) and rate of readmitted juveniles/reimprisoned inmates (1996-2010)
Fig. 7-2-3-3 Percent distribution of juveniles newly admitted to juvenile training schools by history of protective measures and age group (2010)
2 Type of delinquency/offense
Fig. 7-2-3-4 Percent distribution of juveniles newly admitted to juvenile training schools and young inmates newly imprisoned for the first time/second time or more (readmitted/reimprisoned) by type of delinquency/offense and age group (1996-2010)
3 Term of imprisonment
Fig. 7-2-3-5 Percent distribution of new inmates (sentenced to imprisonment with or without work) imprisoned for the first time/reimprisoned by term of imprisonment (1996-2010)
4 Residential status
Table 7-2-3-6 Status with new inmates without a fixed residence by history of imprisonment and age group (2010)
5 Educational/employment status
Fig. 7-2-3-7 Percent distribution of juveniles newly admitted to juvenile training schools and young inmates newly imprisoned for the first time/second time or more (readmitted/reimprisoned) by educational/employment status (2010)
6 Association with delinquent groups
Fig. 7-2-3-8 Percent distribution of juveniles newly admitted to juvenile training schools and young inmates newly imprisoned for the first time/second time or more (readmitted/reimprisoned) with or without association with delinquent groups, etc. (1996-2010)
7 Guardians/places to return to
Fig. 7-2-3-9 Percent distribution of juveniles newly admitted to juvenile training schools for the first time/readmitted by guardian status (1996-2010)
Fig. 7-2-3-10 Percent distribution of young released inmates by places they returned to and age group (2010)
8 Reason for release
Fig. 7-2-3-11 Percent distribution of young released inmates imprisoned for the first time/reimprisoned by reason for release (2010)
Section 4 Probation/Parole Supervision
1 Trends with juvenile/young probationers/parolees
Fig. 7-2-4-1 Number of probationers/parolees newly placed under probation/ parole supervision by age group (2010)
Fig. 7-2-4-2 Percent distribution of probationers/parolees newly placed under probation/parole supervision by age group (1989-2010)
2 Characteristics of juvenile/young probationers/parolees
Fig. 7-2-4-3 Percent distribution of probationers/parolees newly placed under probation/parole supervision by type of offense/delinquency (1990-2010)
Fig. 7-2-4-4 Percent distribution of probationers/parolees newly placed under probation/parole supervision by residential status (2010)
Fig. 7-2-4-5 Percent distribution of probationers/parolees whose probation/parole supervision terminated by reason for termination and educational/employment status (2010)
Fig. 7-2-4-6 Percent distribution of probationers/parolees by educational/employment status at the time of commencement/termination of probation/parole supervision (1992-2010)
3 Revocation of probation of young probationers
Fig. 7-2-4-7 Percent distribution of young probationers by reason for termination of probation and history of protective measures at the time of commencement of probation (2010)
Section 5 Trends with Repeat Delinquencies/Offenses by Juveniles/Young People
1 Repeat delinquencies by juveniles
Fig. 7-2-5-1 Number of juveniles cleared for non-traffic penal code offenses and rate of repeat juvenile delinquents (for all offenses and by type of offense) (1989-2010)
2 History of protective measures with juveniles/young people placed under protective measures
Fig. 7-2-5-2 Percent distribution of juveniles and young offenders by history of protective measures (by type of protective measure and for total/females) (2010)
Table 7-2-5-3 Number of juveniles and young offenders with history of protective measures by type of protective measures and type of delinquency/offense (2010)
3 Readmission/imprisonment of juveniles discharged from juvenile training schools
Table 7-2-5-4 Readmission and imprisonment of juveniles discharged from juvenile training schools (1996-2010)
4 Reimprisonment of young released inmates
Table 7-2-5-5 Reimprisonment of young released inmates (1996-2010)
5 Redisposition of juvenile/young probationers/parolees
Table 7-2-5-6 Redisposition rate of juvenile probationers/juvenile training school parolees (2001-2010)
Table 7-2-5-7 Redisposition rate of young probationers/parolees (2001-2010)
Fig. 7-2-5-8 Redisposition/revocation status of probationers/parolees whose probation/parole supervision terminated by employment status (cumulative total of 1992-2009, 2010)
6 Protective measure histories of young new inmates
Fig. 7-2-5-9 Percent distribution of new inmates imprisoned for the first time/second time or more by history of protective measures and age group (2010)
Chapter 3 Offenses by Persons Discharged from Juvenile Training Schools
Section 1 General Situation of Research Subjects
1 Attributes of research subjects
Table 7-3-1-1 Number of research subjects by type of index delinquency and gender
Table 7-3-1-2 Number of research subjects by type of juvenile training school and treatment program
Fig. 7-3-1-3 Living status, etc. at the time of the index delinquency by gender
Fig. 7-3-1-4 Percent distribution of research subjects by history of protective measures and gender
2 Situation while in juvenile training schools and parole supervision
Table 7-3-1-5 Qualifications/licenses acquired in juvenile training school by gender
Fig. 7-3-1-6 Percent distribution of research subjects by guarantor at the time of the relevant discharge and gender
Fig. 7-3-1-7 Percent distribution of research subjects by reason for termination of parole supervision and gender
Section 2 Offenses Committed by Persons Discharged from Juvenile Training Schools
1 Criminal punishment status
Fig. 7-3-2-1 Major criminal punishment status by gender
Fig. 7-3-2-2 Percent distribution of research subjects by number of times they received criminal punishment
Table 7-3-2-3 Criminal punishment status by type of offense
Fig. 7-3-2-4 Status of criminal punishment after first criminal punishment by first criminal punishment
2 Situation with offenses
Fig. 7-3-2-5 Number of research subjects by age at the time of the first offense
Fig. 7-3-2-6 Cumulative status with the first offense after the termination of parole supervision
Fig. 7-3-2-7 Percent distribution of research subjects by modus operandi of theft
Fig. 7-3-2-8 Percent distribution of research subjects by complicity status of theft
Fig. 7-3-2-9 Percent distribution of research subjects by complicity status of injury, assault, and Physical Violence Act violations
Fig. 7-3-2-10 Percent distribution of research subjects by type of violation of Road Trafic Act violations
Section 3 Analysis of the Offenses after Discharge from Juvenile Training Schools
1 Analysis of the subjects by history of protective measures and living status, etc.
Fig. 7-3-3-1-1 Criminal punishment status by history of protective measures
Fig. 7-3-3-1-2 Criminal punishment status by history of commitment to a children’s self-reliance support facility, etc.
Fig. 7-3-3-1-3 Criminal punishment status by treatment program in juvenile training schools, etc.
Fig. 7-3-3-1-4 Criminal punishment status by number of disciplinary actions taken in juvenile training schools
Fig. 7-3-3-1-5 Criminal punishment status by guarantor at the time of the relevant discharge
Fig. 7-3-3-1-6 Criminal punishment status by number of visits to juvenile training schools made by relatives
Fig. 7-3-3-1-7 Criminal punishment status by employment status at the time of termination of parole supervision
Fig. 7-3-3-1-8 Employment status at the time of termination of parole supervision by educational level at the time of index delinquencies
Fig. 7-3-3-1-9 Employment status by status of acquisition of qualifications/licenses while in juvenile training schools (long-term treatment programs)
Fig. 7-3-3-1-10 Criminal punishment status by reason for termination of parole supervision
2 Analysis of juvenile delinquencies
Table 7-3-3-2-1 Criminal punishment status, etc. by delinquency group
Fig. 7-3-3-2-2 Criminal punishment status by delinquency group
Fig. 7-3-3-2-3 Comparison of rate of offense type
Fig. 7-3-3-2-4 Criminal punishment status of the drug delinquency group by gender
Fig. 7-3-3-2-5 Criminal punishment status by content of drug delinquencies
Fig. 7-3-3-2-6 Criminal punishment status by history of protective measures and delinquency group
Fig. 7-3-3-2-7 Criminal punishment status by employment status at the time of termination of parole supervision and delinquency group
3 Analysis of the status after discharge from juvenile training schools
Fig. 7-3-3-3-1 Percent distribution of research subjects by residential status and the persons they lived with at the time of the offenses for which they received the first criminal punishment
Fig. 7-3-3-3-2 Percent distribution of research subjects without fixed residences, etc. by type of offense
Fig. 7-3-3-3-3 Employment status at the time of the offenses for which they received the first criminal punishment
Fig. 7-3-3-3-4 Employment status of research subjects belonging to the sexual offense type
Table 7-3-3-3-5 Number of research subjects by employment status at the time of termination of parole supervision and at the time of the offenses
Fig. 7-3-3-3-6 Problematic behavior, etc. after their relevant discharge by type of offense
Fig. 7-3-3-3-7 Status with overlapping problematic behaviors, etc.
Fig. 7-3-3-3-8 Percent distribution of research subjects of concern with overlapping problematic behaviors, etc. by type of offense
Fig. 7-3-3-3-9 Beginning of association with delinquent friends
Fig. 7-3-3-3-10 Status with association with delinquent friends by type of major offense
Fig. 7-3-3-3-11 Association with delinquent friends/groups at the time of the index delinquencies
Fig. 7-3-3-3-12 Percent distribution of research subjects of concern with problems of debt/idling time away
Fig. 7-3-3-3-13 Problematic behavior, etc. after their relevant discharge by offense type
Fig. 7-3-3-3-14 Behavior during the period without offenses
Fig. 7-3-3-3-15 Rehabilitation supporters
Chapter 4 Attitudes of Juvenile Delinquents/Young Offenders
Section 1 Outline of Survey
1 Survey subjects
Table 7-4-1-1 Attributes of survey subjects, etc.
Section 2 Attitude toward Life, etc. of Juvenile Delinquents/Young Offenders
1 Self-awareness
Fig. 7-4-2-1 Self-awareness
2 Moral awareness
Fig. 7-4-2-2 Moral awareness, etc.
3 Degree of satisfaction with relationships with friends
Fig. 7-4-2-3 Degree of satisfaction with relationships with friends
4 Understanding of parents’ attitudes toward juvenile delinquents/young offenders
Fig. 7-4-2-4 Understanding of parents’ attitudes toward juvenile delinquents/young offenders
5 Degree of satisfaction with family life
Fig. 7-4-2-5 Degree of satisfaction with family life
6 Attitudes toward school life
Fig. 7-4-2-6 Attitudes toward school life of juvenile delinquents/young offenders by history of protective measures
7 Attitudes toward work
Fig. 7-4-2-7 Attitudes toward work
8 Attitudes toward community
Fig. 7-4-2-8 Attitudes toward community
9 Degree of satisfaction with society
Fig. 7-4-2-9 Degree of satisfaction with society
Section 3 Attitudes of Juvenile Delinquents/Young Offenders toward Delinquencies/Offenses
1 Understanding of the causes of delinquencies/offenses
Fig. 7-4-3-1 Understanding of causes of delinquencies/offenses of juvenile delinquents/young offenders by history of protective measures and offense types
2 Understanding of causes by problem field
Table 7-4-3-2 Selection rate of items in the respective risk fields of juvenile delinquents/young offenders
Fig. 7-4-3-3 Understanding of causes of delinquencies/offenses of juvenile delinquents/young offenders by risk field and history of protective measures
Table 7-4-3-4 Selection rate of selectable items in the respective risk fields of juvenile delinquents/young offenders with or without a history of commitment to a children’s self-reliance support facility, etc.
Fig. 7-4-3-5 Understanding of causes of delinquencies/offenses of juvenile delinquents/young offenders with or without a history of commitment to a children’s self-reliance support facility, etc. by risk field
3 Awareness of the level of disposition and attitudes after the disposition
Fig. 7-4-3-6 Awareness of level of disposition and attitudes after disposition of juvenile delinquents/young offenders by history of dispositions (protective measures/criminal dispositions)
4 Awareness of what were useful of receiving dispositions
Fig. 7-4-3-7 What were useful of dispositions for juvenile delinquents/young offenders by history of dispositions
5 Awareness of causes for repeat delinquencies/offenses
Fig. 7-4-3-8 Awareness of causes of repeat delinquencies/offenses of juvenile delinquents/young offenders by history of dispositions (protective measures/criminal dispositions)
6 Understanding of mental restraints
Fig. 7-4-3-9 Understanding of mental restraints of juvenile delinquents/young offenders by history of protective measures
Appendix
Appendix 1-1 Number of reported cases, crime rate, number of cleared cases, clearance rate, and number of persons cleared for penal code offenses (1946-2010)
Appendix 1-1 Number of reported cases, crime rate, number of cleared cases, clearance rate, and number of persons cleared for penal code offenses (1946-2010)
Appendix 1-2 Number of reported cases, cleared cases, and persons cleared for penal code offenses by type of offense (2001-2010)
Appendix 1-2 Number of reported cases, cleared cases, and persons cleared for penal code offenses by type of offense (2001-2010)
Appendix 1-3 Clearance rate for penal code offenses by type of offense (2001-2010)
Appendix 1-3 Clearance rate for penal code offenses by type of offense (2001-2010)
Appendix 1-4 Number of persons newly received by public prosecutors for special act offenses by type of offense (2001-2010)
Appendix 1-4 Number of persons newly received by public prosecutors for special act offenses by type of offense (2001-2010)
Appendix 1-5 Number of traffic accidents and persons killed or injured, and rate of death/injury, etc. (1946-2010)
Appendix 1-5 Number of traffic accidents and persons killed or injured, and rate of death/injury, etc. (1946-2010)
Appendix 1-6 Sentencing of imprisonment with work for financial and economic offenses in a court of first instance (2008-2010)
Appendix 1-6 Sentencing of imprisonment with work for financial and economic offenses in a court of first instance (2008-2010)
Appendix 1-7 Number of reported cases and crime rate for major offenses in each country (1990-2009)
Appendix 1-7 Number of reported cases and crime rate for major offenses in each country (1990-2009)
Appendix 1-8 Number of reported cases and crime rate for homicide and theft in each country (1990-2009)
Appendix 1-8 Number of reported cases and crime rate for homicide and theft in each country (1990-2009)
Appendix 1-9 Clearance rate for major offenses, homicide, and theft in each country
Appendix 1-9 Clearance rate for major offenses, homicide, and theft in each country
Appendix 2-1 Number of persons newly received by public prosecutors by type of offense (2006-2010)
Appendix 2-1 Number of persons newly received by public prosecutors by type of offense (2006-2010)
Appendix 2-2 Number of persons conclusively disposed in public prosecutors offices by type of offense and type of disposition (2001-2010)
Appendix 2-2 Number of persons conclusively disposed in public prosecutors offices by type of offense and type of disposition (2001-2010)
Appendix 2-3 Prosecution rate and suspended prosecution rate by type of offense (2006-2010)
Appendix 2-3 Prosecution rate and suspended prosecution rate by type of offense (2006-2010)
Appendix 2-4 Sentencing of death penalty and imprisonment with or without work in district courts by type of offense (2010)
Appendix 2-4 Sentencing of death penalty and imprisonment with or without work in district courts by type of offense (2010)
Appendix 2-5 Average daily number of persons imprisoned in penal institutions (1950-2010)
Appendix 2-5 Average daily number of persons imprisoned in penal institutions (1950-2010)
Appendix 2-6 Number of new inmates by type of offense and gender (2010)
Appendix 2-6 Number of new inmates by type of offense and gender (2010)
Appendix 2-7 Number of inmates reimprisoned by type of offense and gender (2010)
Appendix 2-7 Number of inmates reimprisoned by type of offense and gender (2010)
Appendix 2-8 Number of new inmates by history of imprisonment and type of offense (2010)
Appendix 2-8 Number of new inmates by history of imprisonment and type of offense (2010)
Appendix 2-9 Number of inmates reimprisoned by repeat offense period and type of previous offense (2010)
Appendix 2-9 Number of inmates reimprisoned by repeat offense period and type of previous offense (2010)
Appendix 2-10 Number of inmates sentenced to imprisonment with work at the end of each year by term of imprisonment (1957-2010)
Appendix 2-10 Number of inmates sentenced to imprisonment with work at the end of each year by term of imprisonment (1957-2010)
Appendix 2-11 Number of persons for whom parole examinations were instigated or parole was granted, etc. (1949-2010)
Appendix 2-11 Number of persons for whom parole examinations were instigated or parole was granted, etc. (1949-2010)
Appendix 2-12 Number of persons newly placed under probation/parole supervision (1949-2010)
Appendix 2-12 Number of persons newly placed under probation/parole supervision (1949-2010)
Appendix 2-13 Number of persons newly placed under probation/parole supervision by type of offense and gender (2010)
Appendix 2-13 Number of persons newly placed under probation/parole supervision by type of offense and gender (2010)
Appendix 3-1 Number of juvenile offenders newly received by public prosecutors by type of offense and age group (2006-2010)
Appendix 3-1 Number of juvenile offenders newly received by public prosecutors by type of offense and age group (2006-2010)
Appendix 3-2 Percent distribution of opinions by public prosecutors and conclusive dispositions in family courts by age group (2010)
Appendix 3-2 Percent distribution of opinions by public prosecutors and conclusive dispositions in family courts by age group (2010)
Appendix 3-3 Number of juveniles conclusively disposed in family courts for juvenile protection cases by type of delinquency and type of disposition (2010)
Appendix 3-3 Number of juveniles conclusively disposed in family courts for juvenile protection cases by type of delinquency and type of disposition (2010)
Appendix 3-4 Number of juveniles newly admitted to juvenile classification homes and average daily number of juveniles in juvenile classification homes by gender (1949-2010)
Appendix 3-4 Number of juveniles newly admitted to juvenile classification homes and average daily number of juveniles in juvenile classification homes by gender (1949-2010)
Appendix 3-5 Number of juveniles newly admitted to juvenile training schools by gender and type of treatment program (1949-2010)
Appendix 3-5 Number of juveniles newly admitted to juvenile training schools by gender and type of treatment program (1949-2010)
Appendix 3-6 Number of juveniles newly admitted to juvenile training schools by type of delinquency (2002-2010)
Appendix 3-6 Number of juveniles newly admitted to juvenile training schools by type of delinquency (2002-2010)
Appendix 4-1 Number of cases and persons cleared for non-traffic penal code offenses committed by foreign nationals (1980-2010)
Appendix 4-1 Number of cases and persons cleared for non-traffic penal code offenses committed by foreign nationals (1980-2010)
Appendix 4-2 Number of cases and persons referred to public prosecutors for special act offenses committed by foreign nationals (1980-2010)
Appendix 4-2 Number of cases and persons referred to public prosecutors for special act offenses committed by foreign nationals (1980-2010)
Appendix 4-3 Number of foreign nationals conclusively disposed in public prosecutors offices (1991-2010)
Appendix 4-3 Number of foreign nationals conclusively disposed in public prosecutors offices (1991-2010)
Appendix 4-4 Number of visiting foreign nationals conclusively disposed in public prosecutors offices by type of offense (2010)
Appendix 4-4 Number of visiting foreign nationals conclusively disposed in public prosecutors offices by type of offense (2010)
Appendix 4-5 Number of new Class F inmates by nationality, etc. (2008-2010)
Appendix 4-5 Number of new Class F inmates by nationality, etc. (2008-2010)
Appendix 4-6 Number of foreign nationals newly placed under probation/parole supervision by nationality, etc. (2008-2010)
Appendix 4-6 Number of foreign nationals newly placed under probation/parole supervision by nationality, etc. (2008-2010)
Appendix 4-7 Number of persons conclusively disposed in public prosecutors offices for Stimulants Control Act violations, etc. (2001-2010)
Appendix 4-7 Number of persons conclusively disposed in public prosecutors offices for Stimulants Control Act violations, etc. (2001-2010)
Appendix 5-1 Application for and payment of crime victim benefits (FY 1998-2010)
Appendix 5-1 Application for and payment of crime victim benefits (FY 1998-2010)
Appendix 6-1 Chronological Table of “Criminal Justice System Reform”
Appendix 6-1 Chronological Table of “Criminal Justice System Reform”
Appendix 7-1 Number of juveniles and adults cleared for penal code offenses, rate per population, and juvenile rate (1946-2010)
Appendix 7-1 Number of juveniles and adults cleared for penal code offenses, rate per population, and juvenile rate (1946-2010)
Appendix 7-2 Number of juveniles cleared for non-traffic penal code offenses and rate per population by age group (1966-2010)
Appendix 7-2 Number of juveniles cleared for non-traffic penal code offenses and rate per population by age group (1966-2010)
Appendix 7-3 Number of juveniles cleared for penal code offenses by type of offense
Appendix 7-3 Number of juveniles cleared for penal code offenses by type of offense
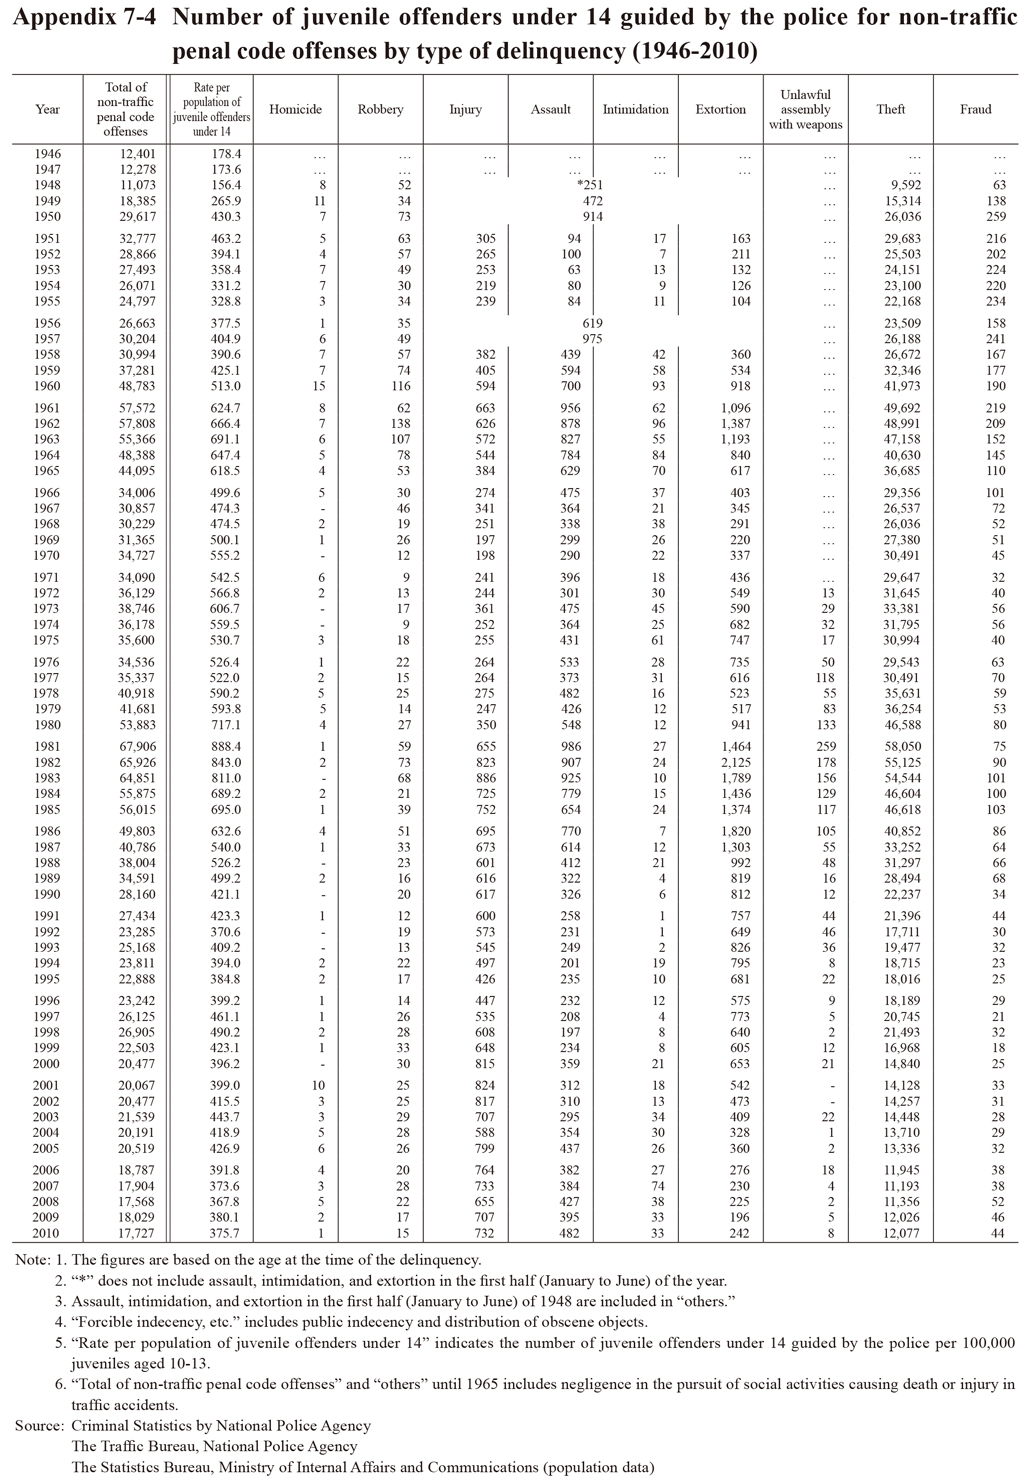
Appendix 7-4 Number of juvenile offenders under 14 guided by the police for non-traffic penal code offenses by type of delinquency (1946-2010)
Appendix 7-4 Number of juvenile offenders under 14 guided by the police for non-traffic penal code offenses by type of delinquency (1946-2010)
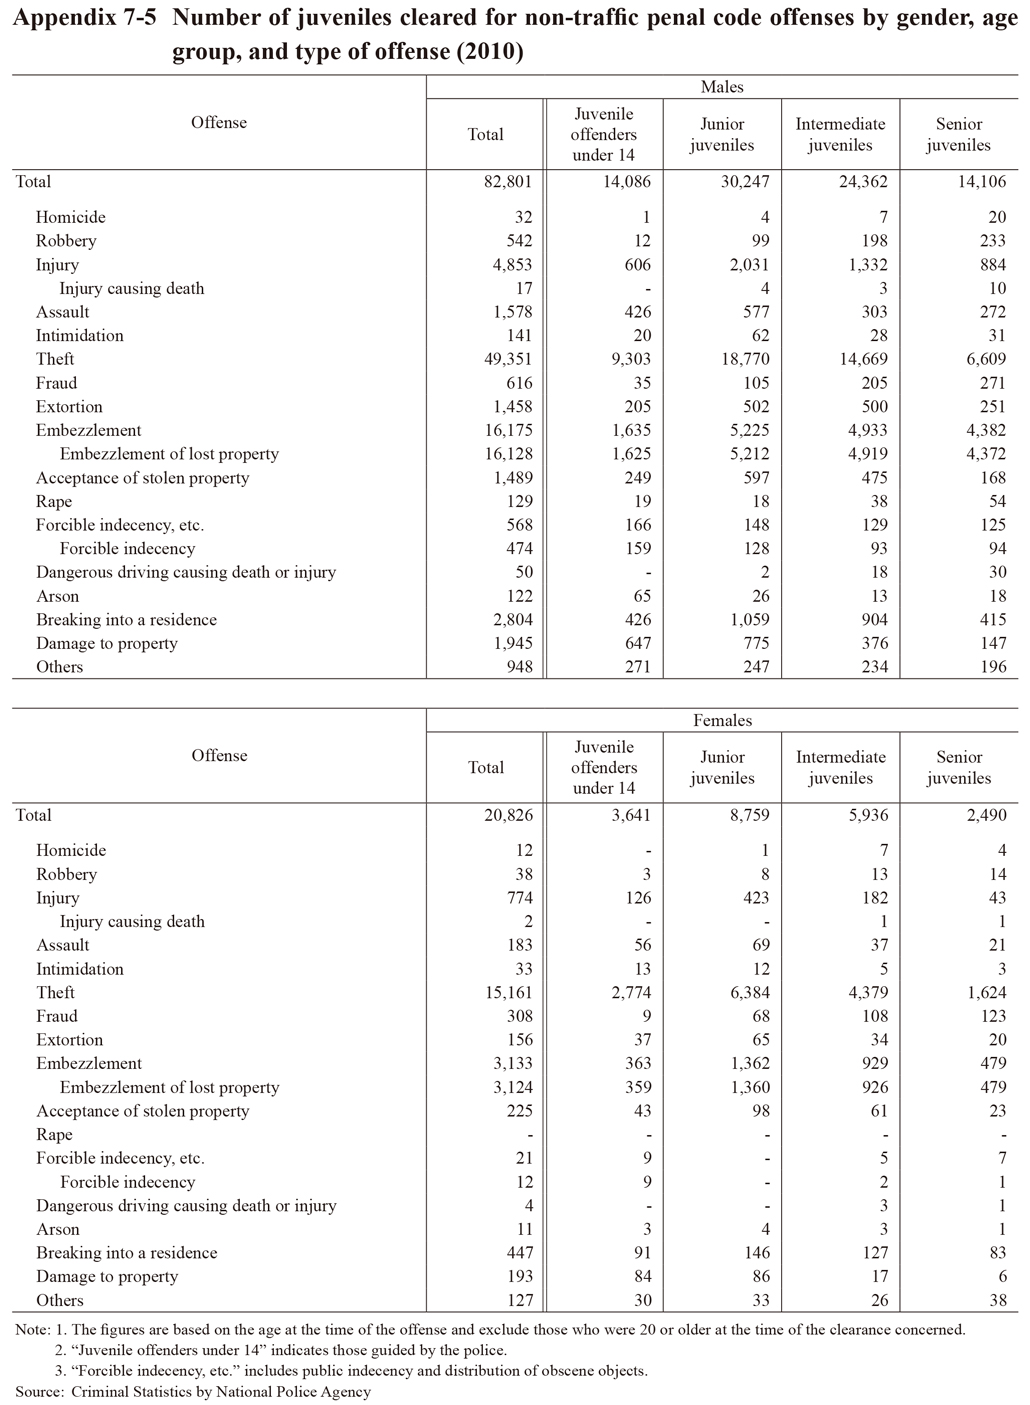
Appendix 7-5 Number of juveniles cleared for non-traffic penal code offenses by gender, age group, and type of offense (2010)
Appendix 7-5 Number of juveniles cleared for non-traffic penal code offenses by gender, age group, and type of offense (2010)
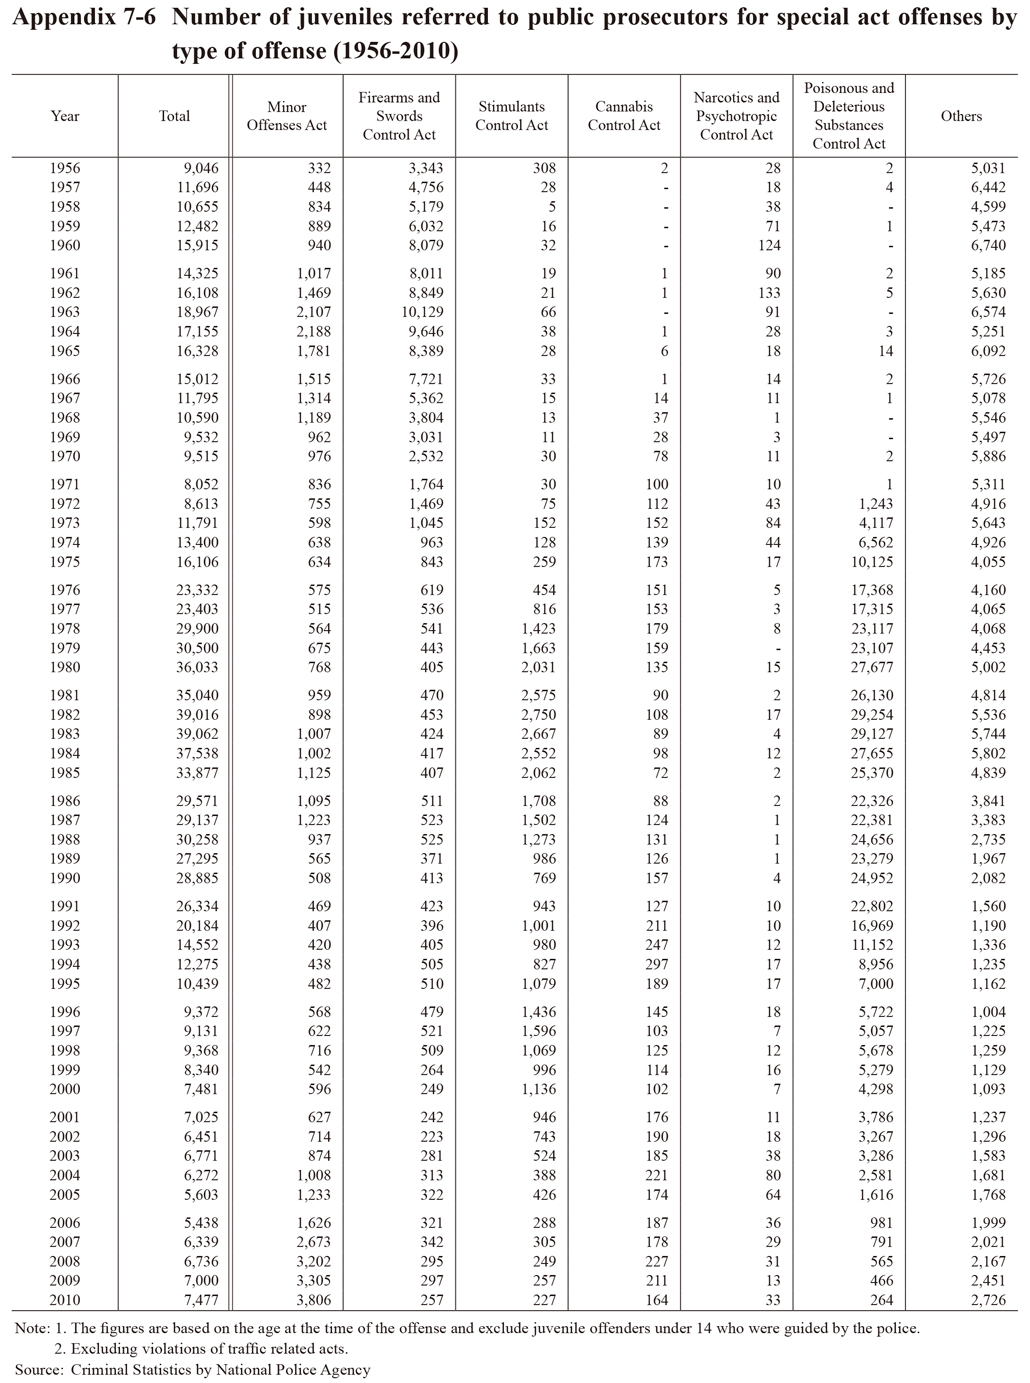
Appendix 7-6 Number of juveniles referred to public prosecutors for special act offenses by type of offense (1956-2010)
Appendix 7-6 Number of juveniles referred to public prosecutors for special act offenses by type of offense (1956-2010)
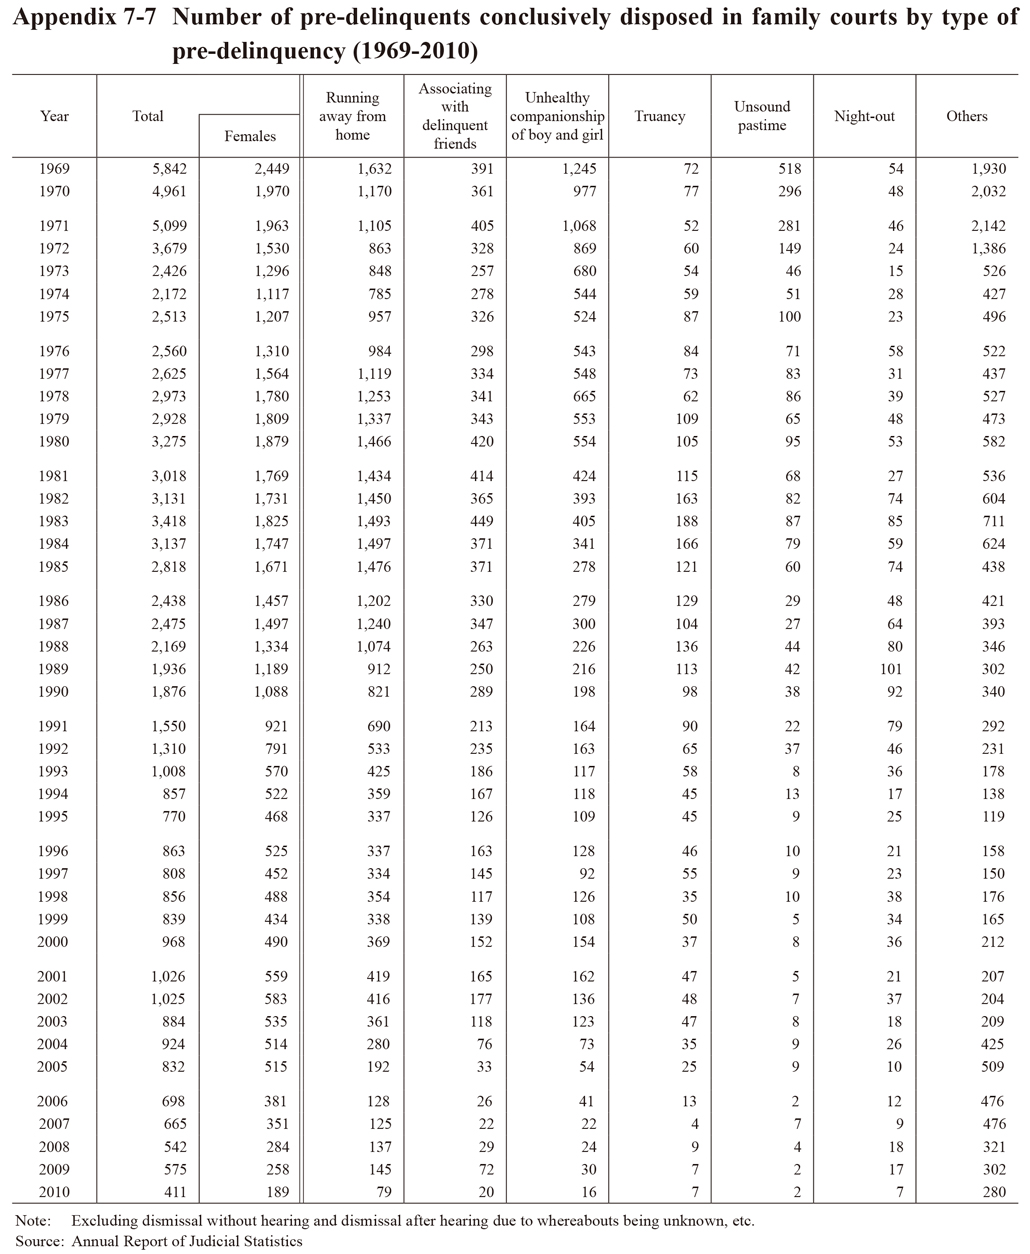
Appendix 7-7 Number of pre-delinquents conclusively disposed in family courts by type of pre-delinquency (1969-2010)
Appendix 7-7 Number of pre-delinquents conclusively disposed in family courts by type of pre-delinquency (1969-2010)
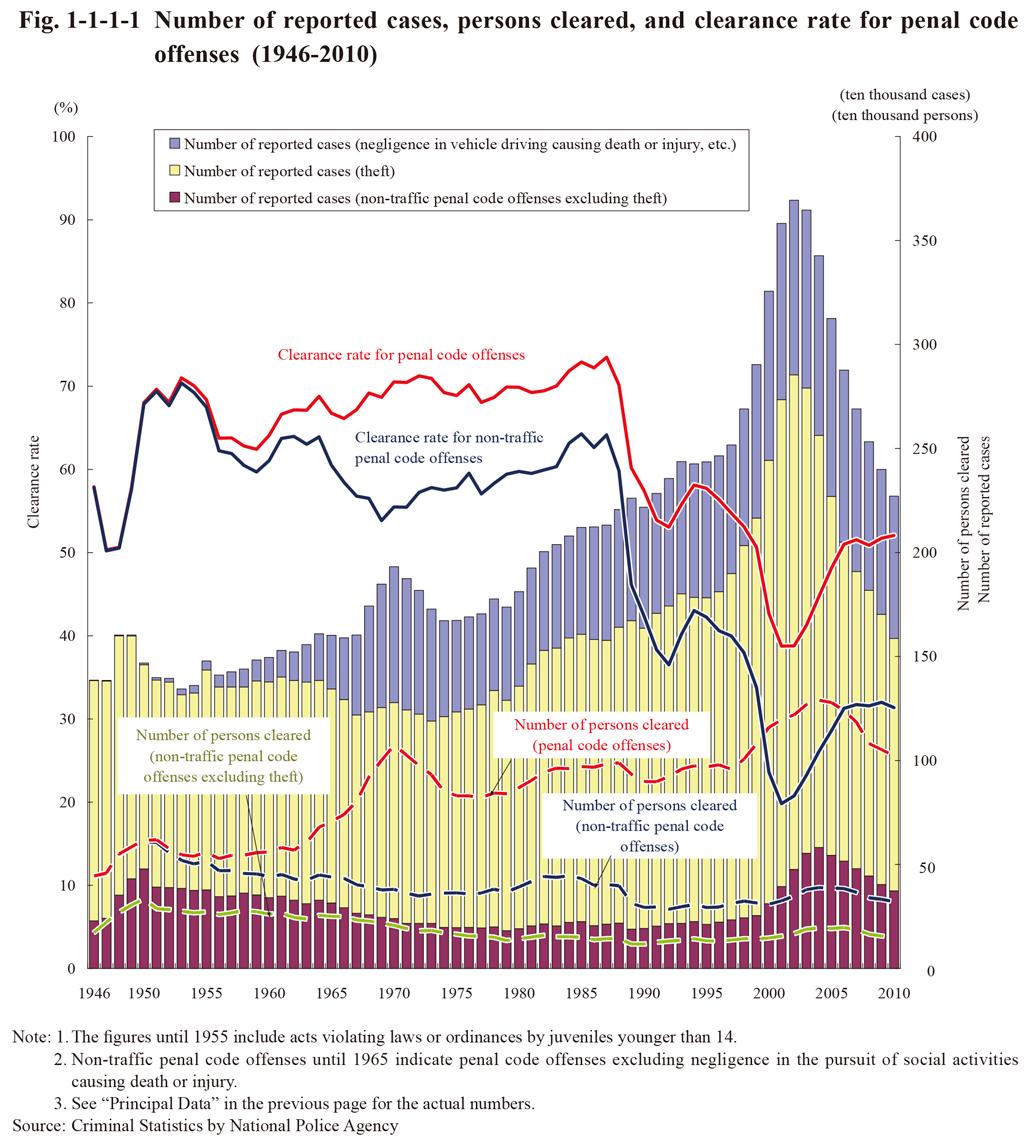
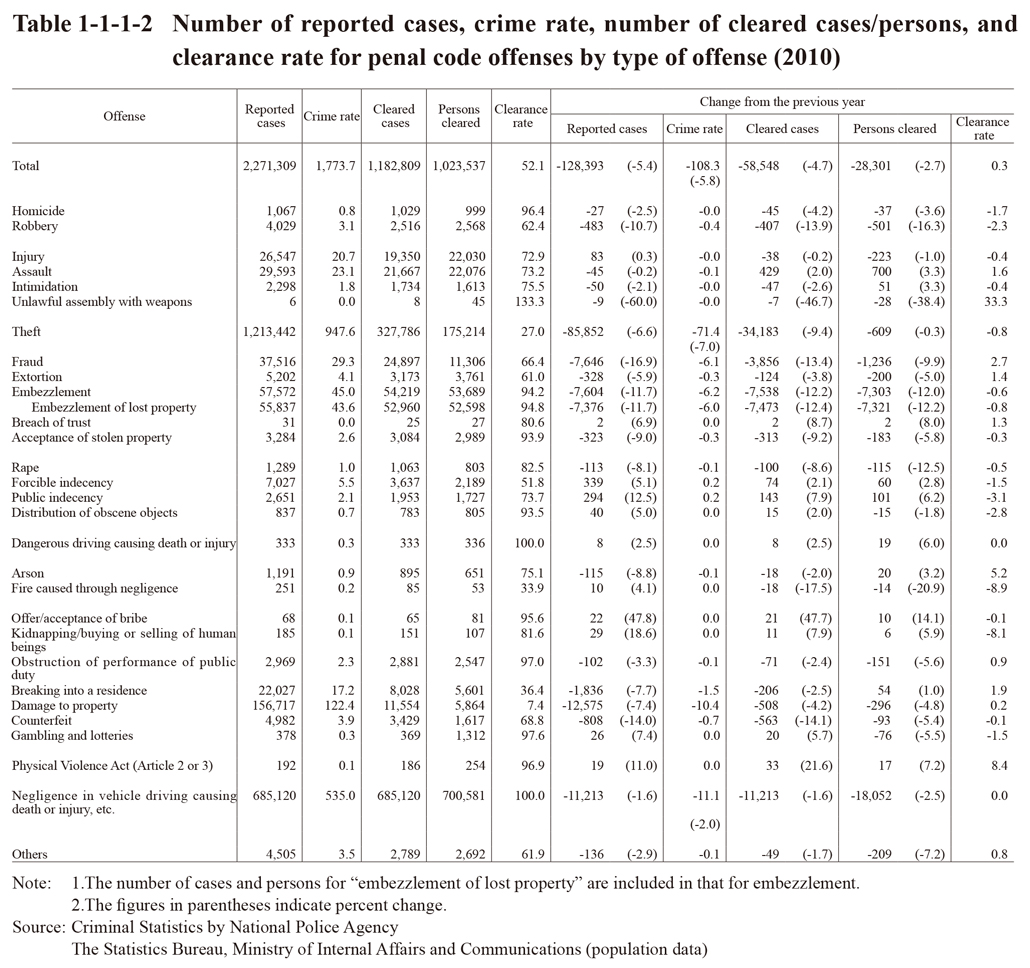
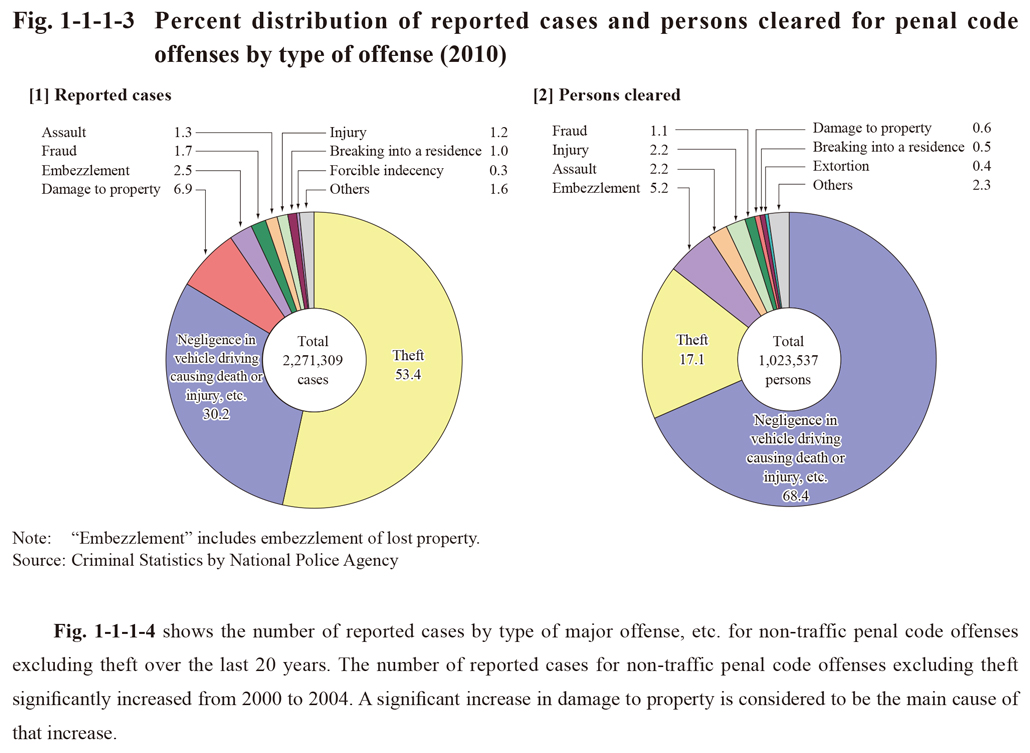
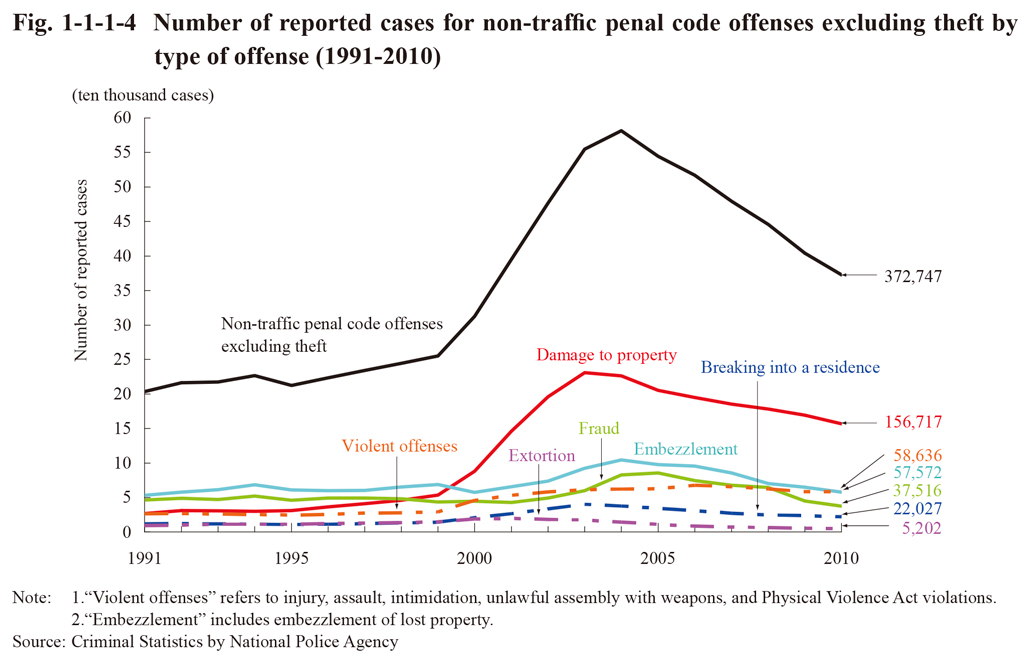
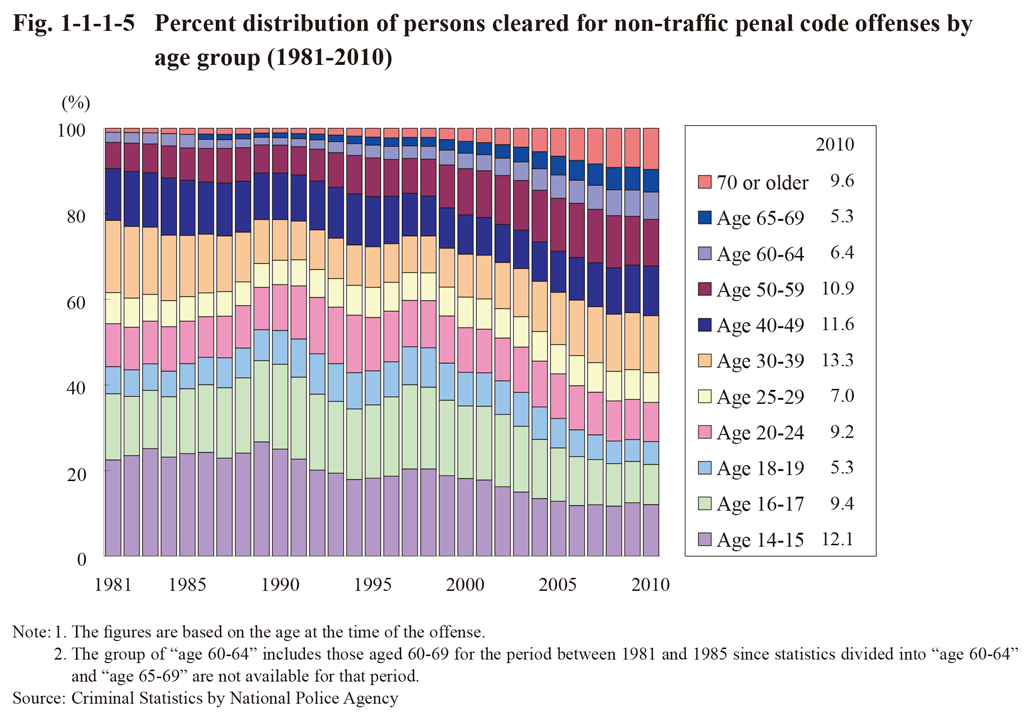
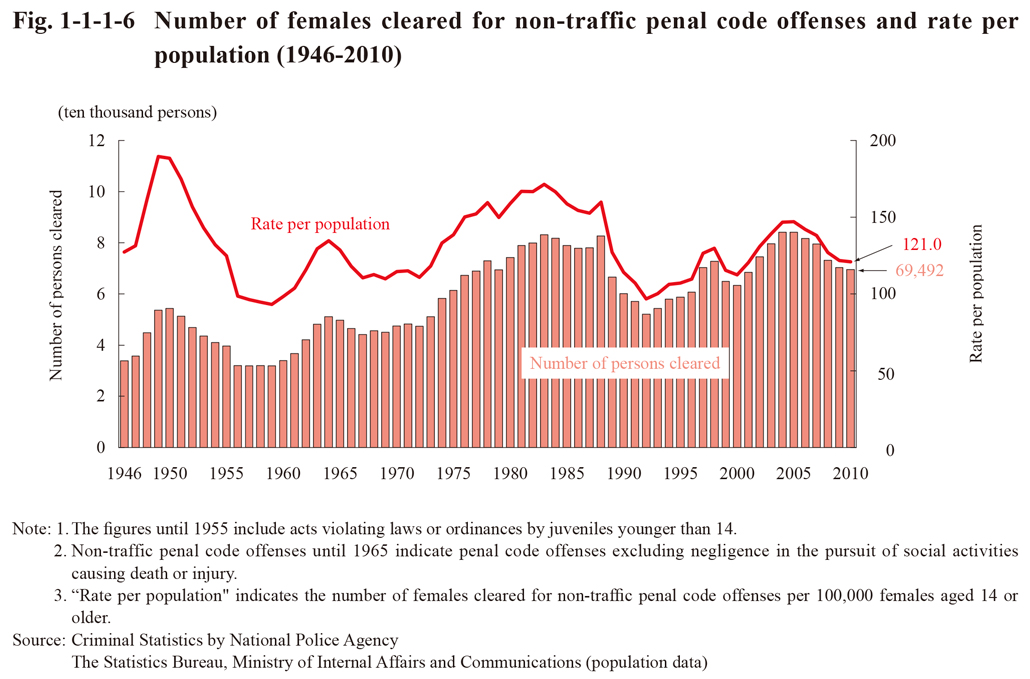
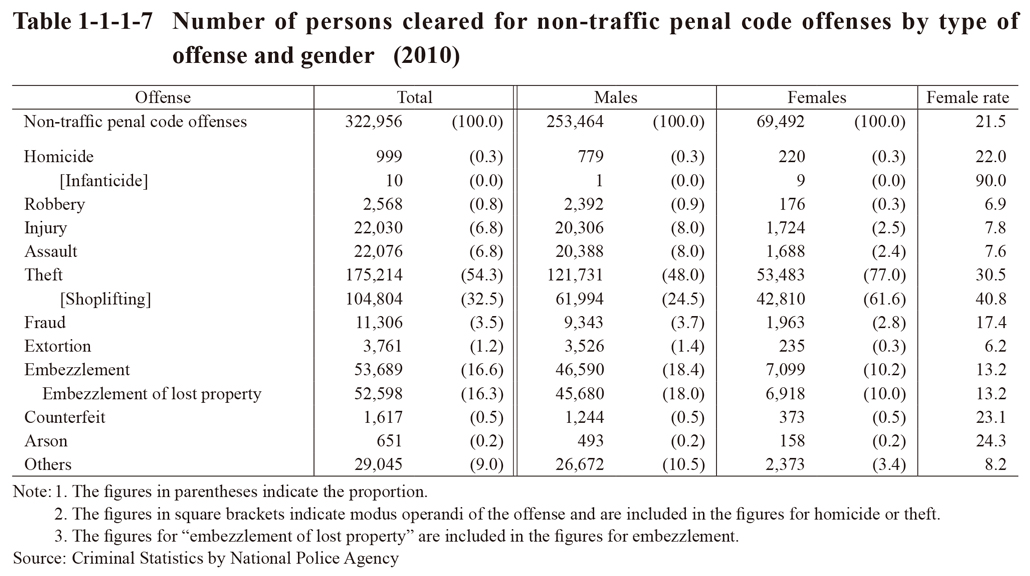
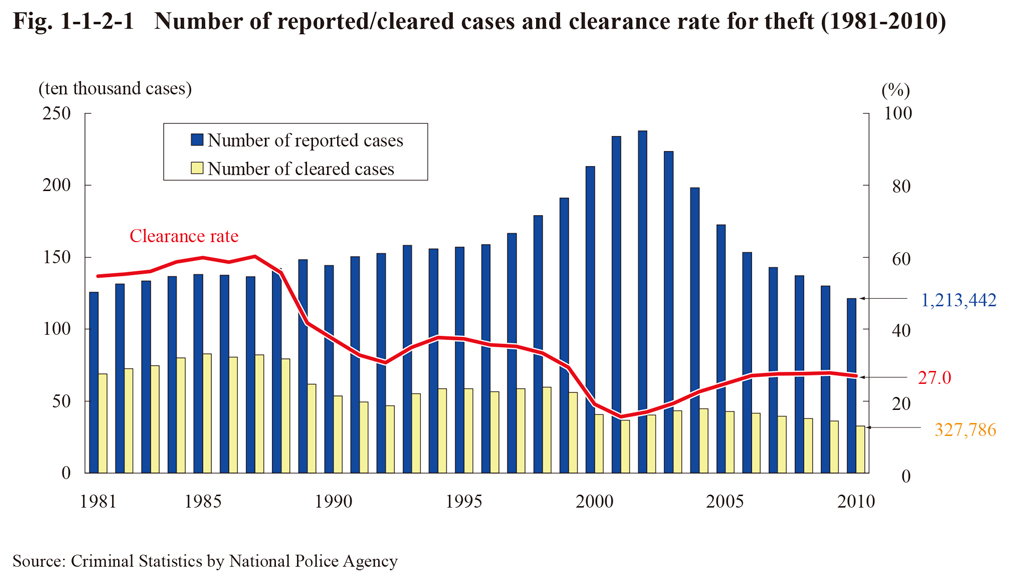 Fig. 1-1-2-1 Number of reported/cleared cases and clearance rate for theft (1981-2010)
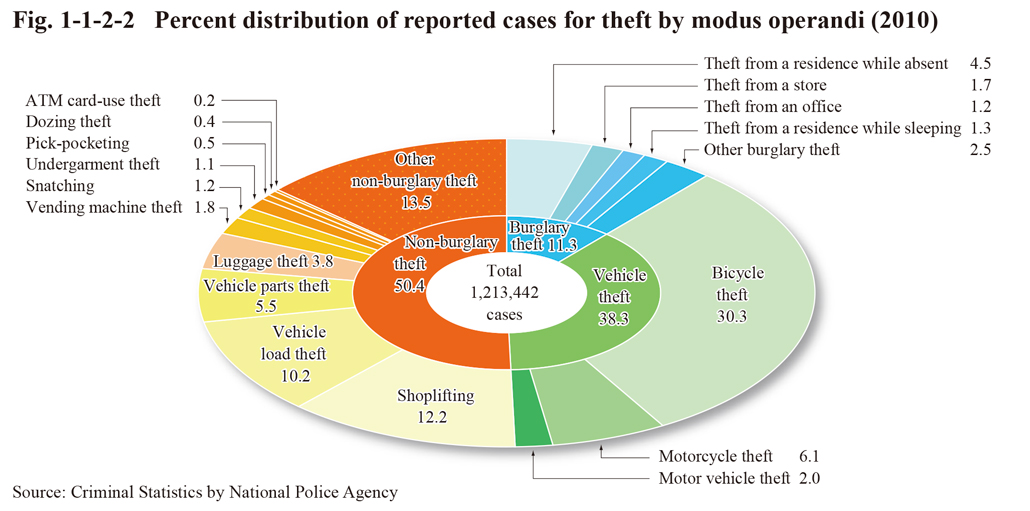 Fig. 1-1-2-2 Percent distribution of reported cases for theft by modus operandi (2010)
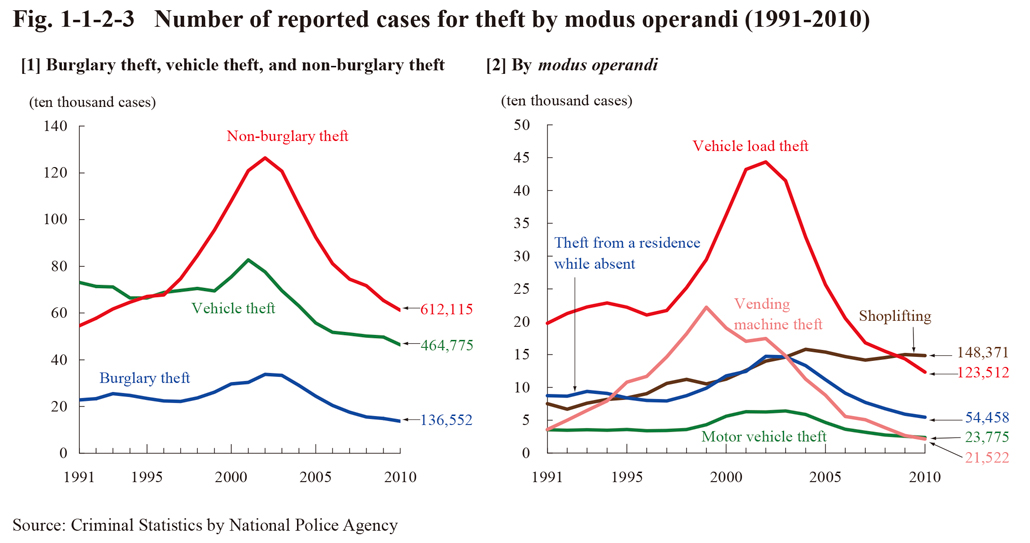 Fig. 1-1-2-3 Number of reported cases for theft by modus operandi (1991-2010)
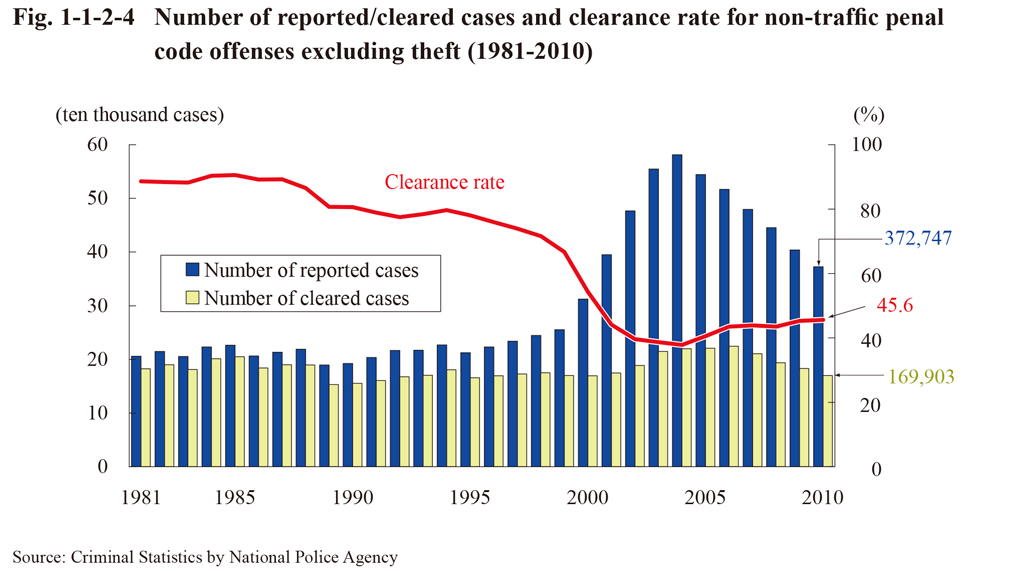 Fig. 1-1-2-4 Number of reported/cleared cases and clearance rate for non-traffic penal
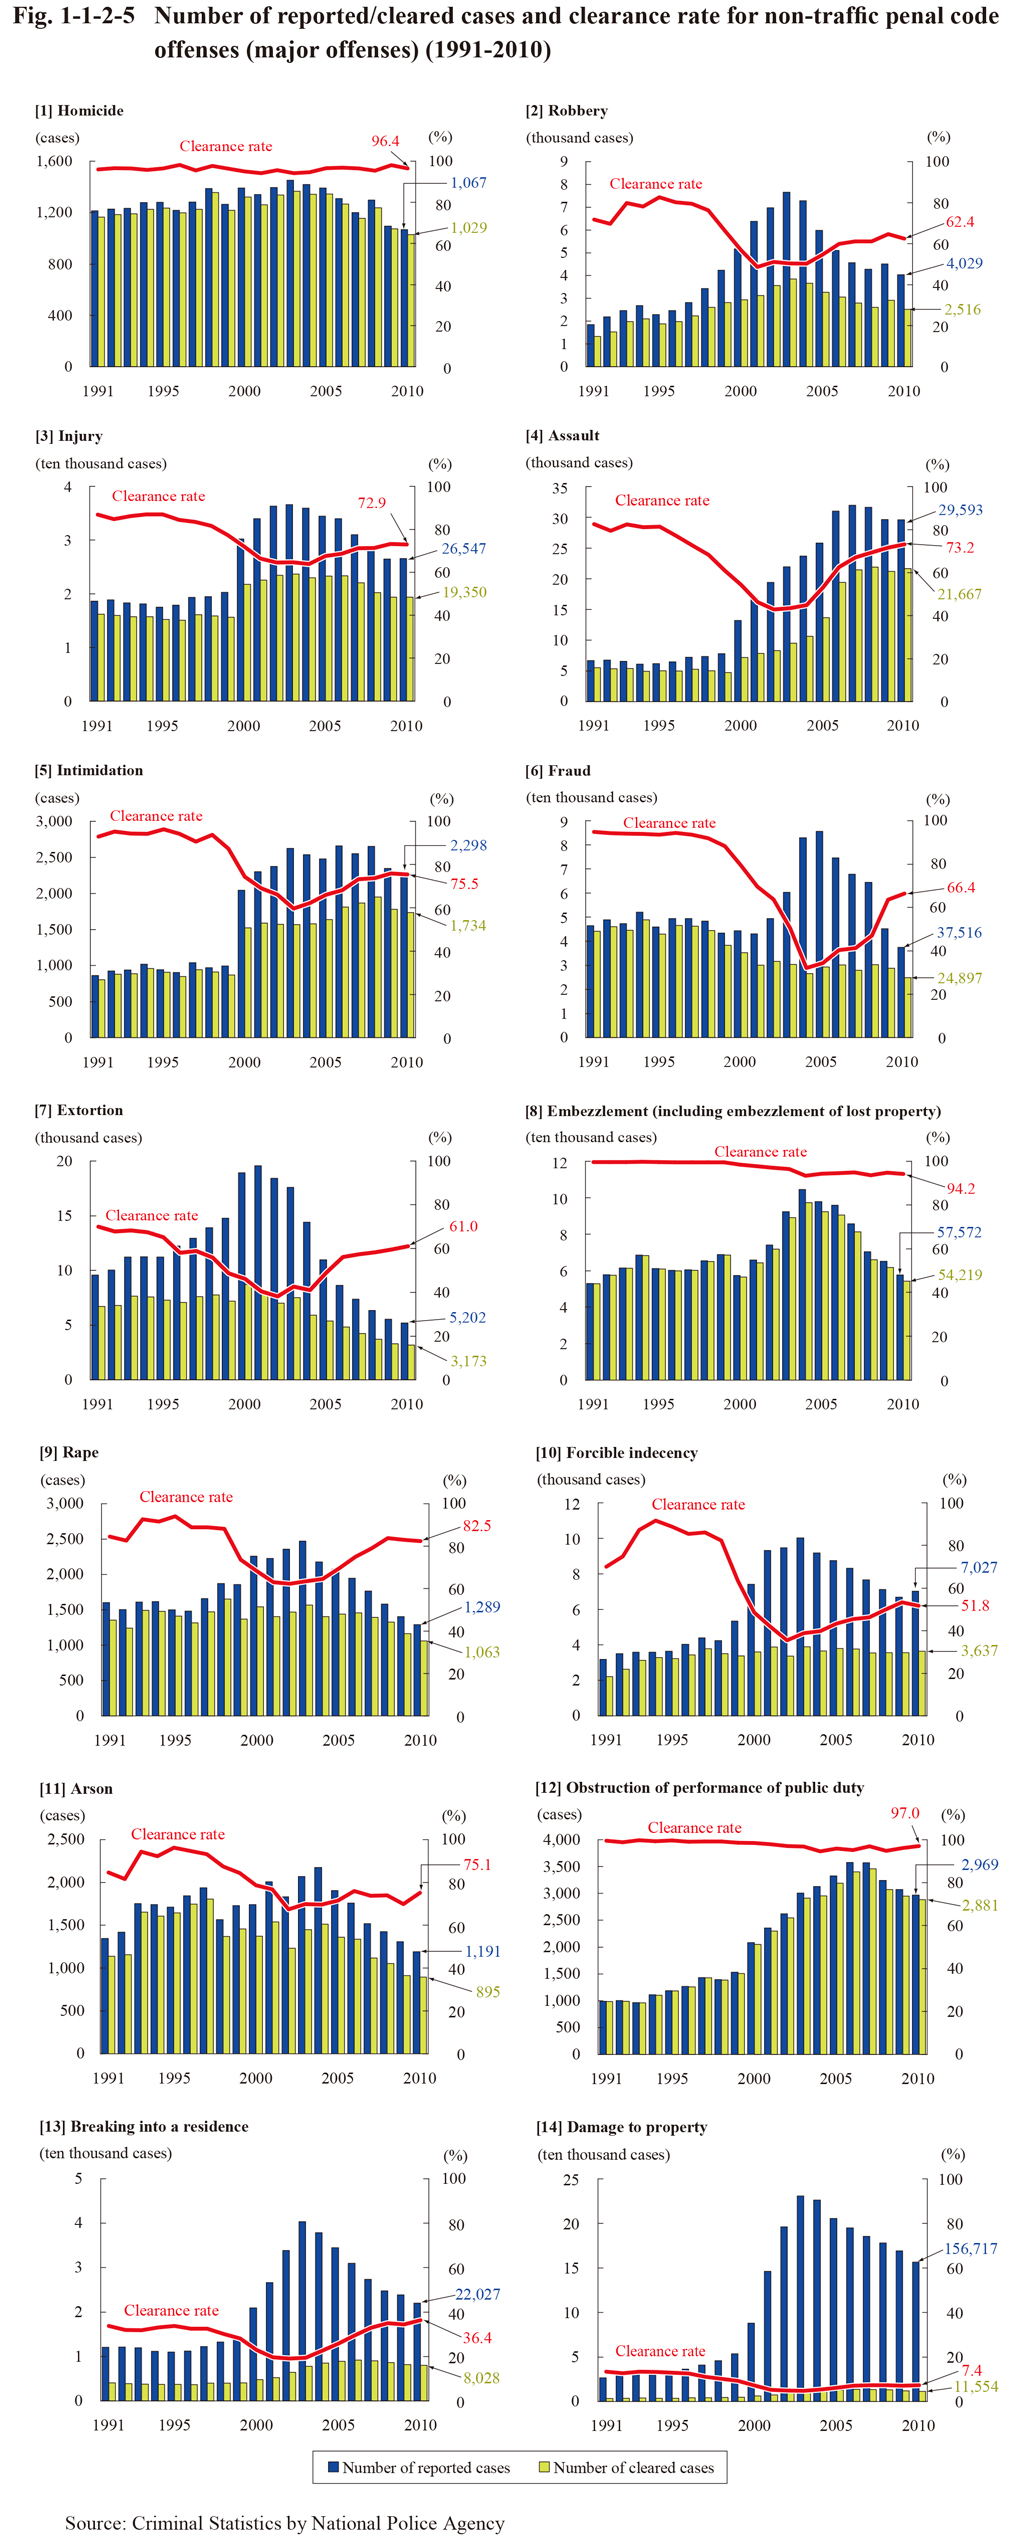
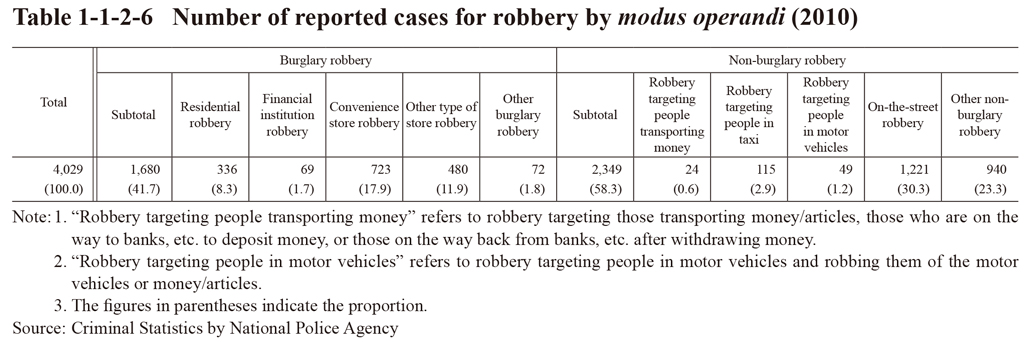 Table 1-1-2-6 Number of reported cases for robbery by modus operandi (2010)
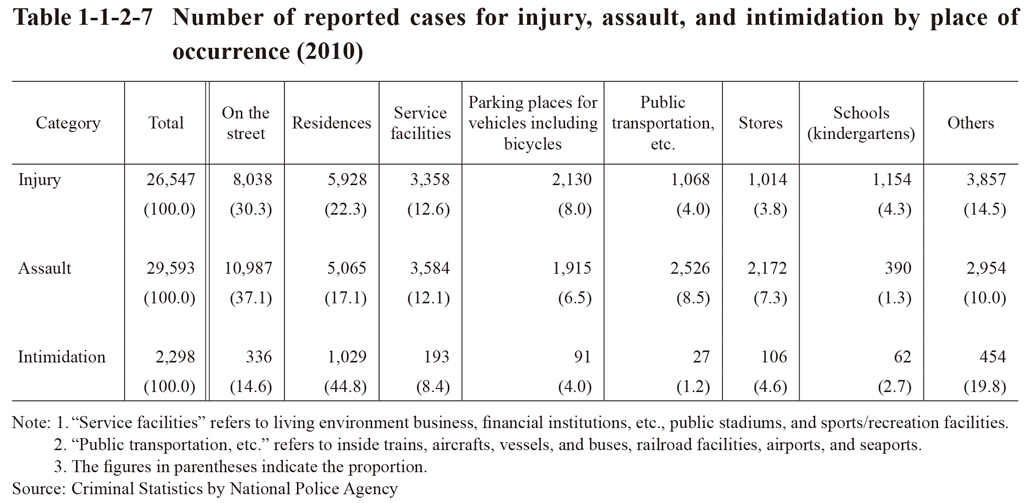
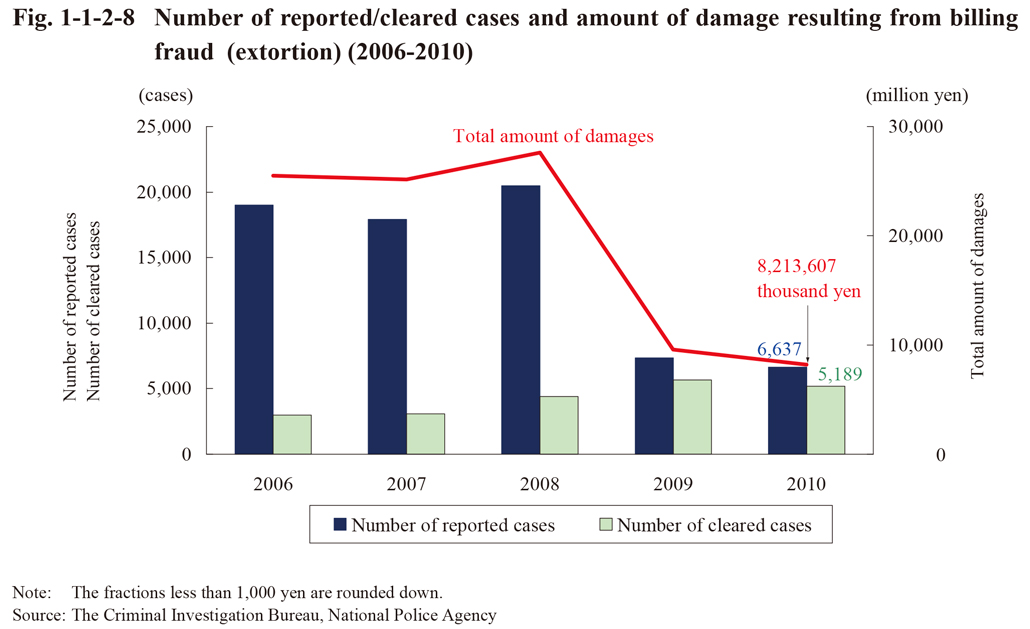
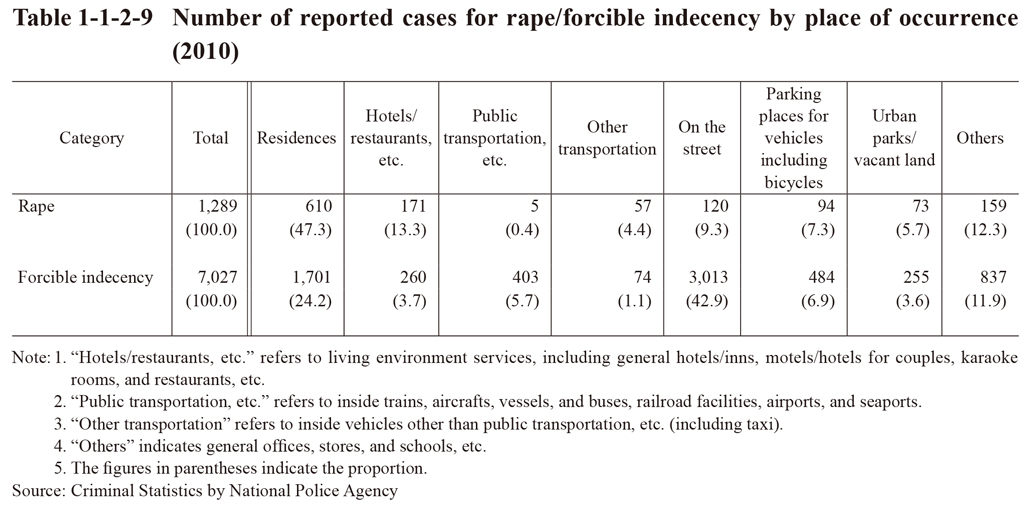 Table 1-1-2-9 Number of reported cases for rape/forcible indecency by place of occurrence (2010)
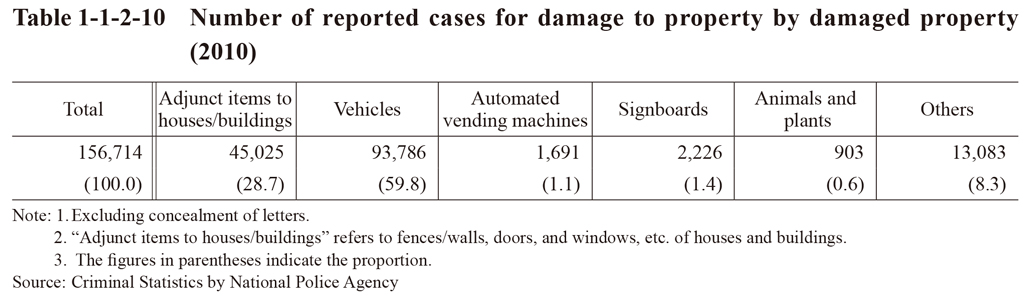 Table 1-1-2-10 Number of reported cases for damage to property by damaged property (2010)
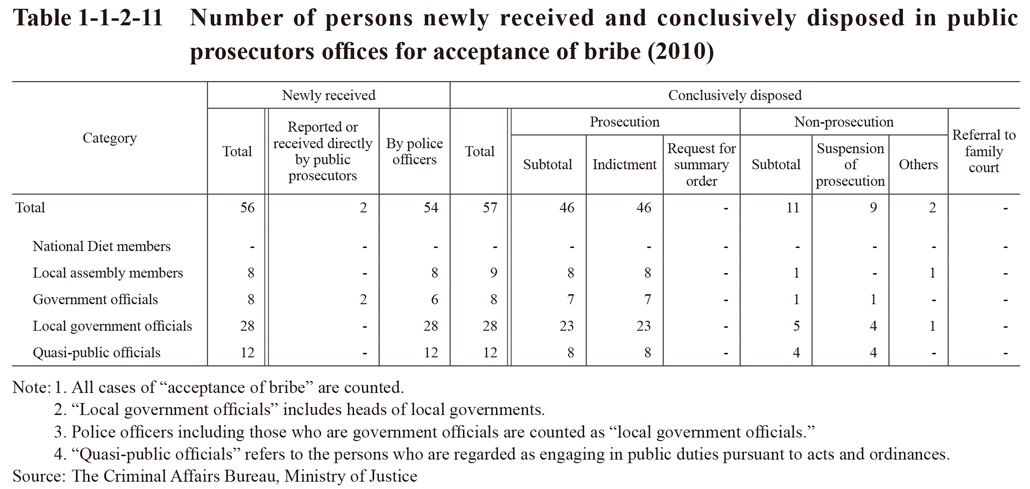
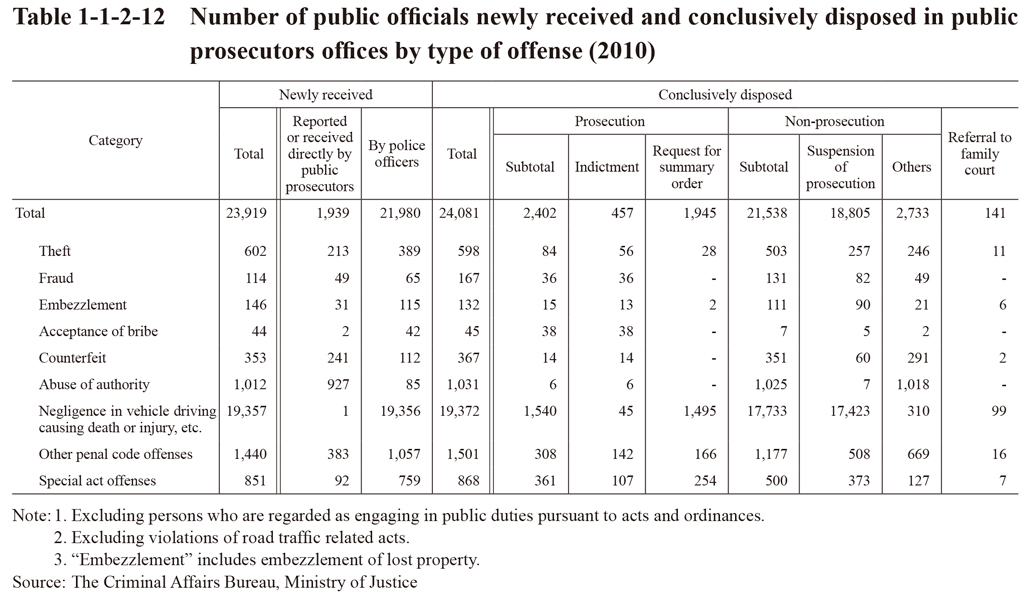
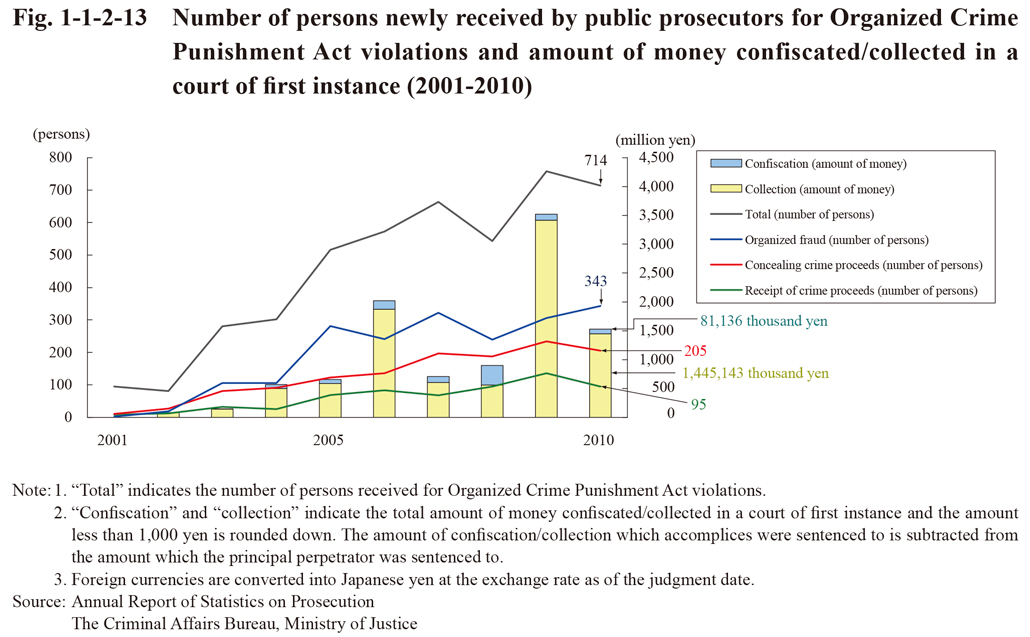
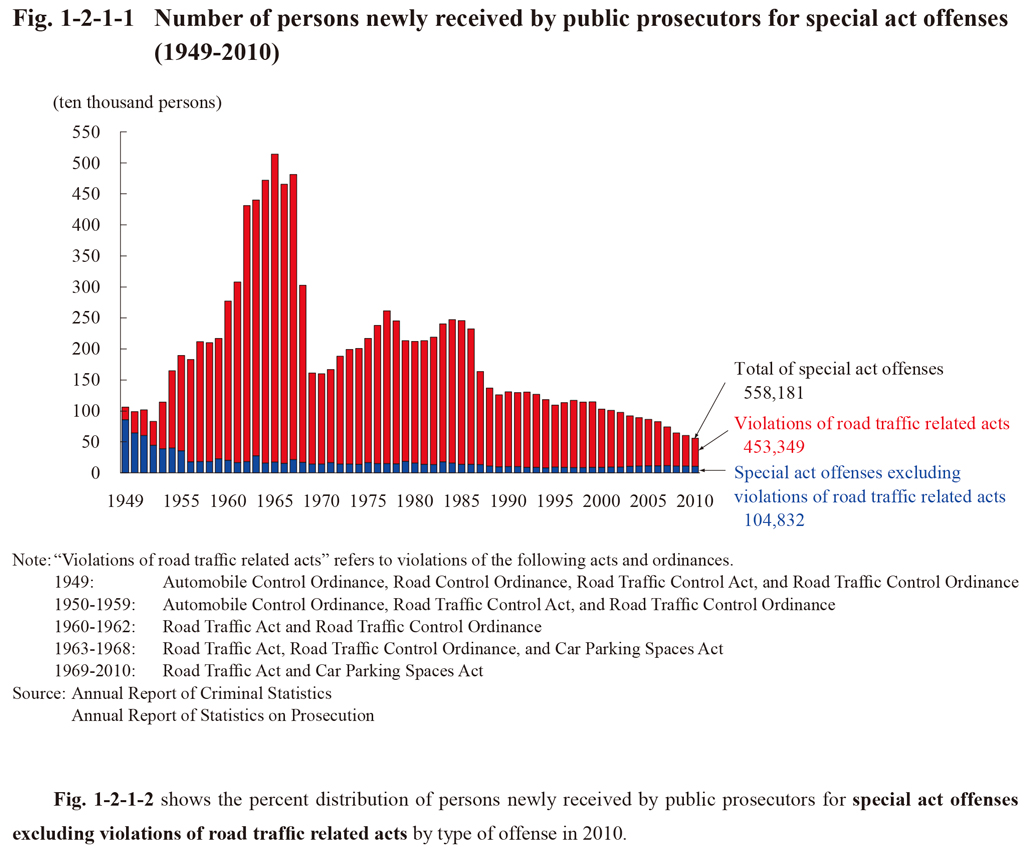
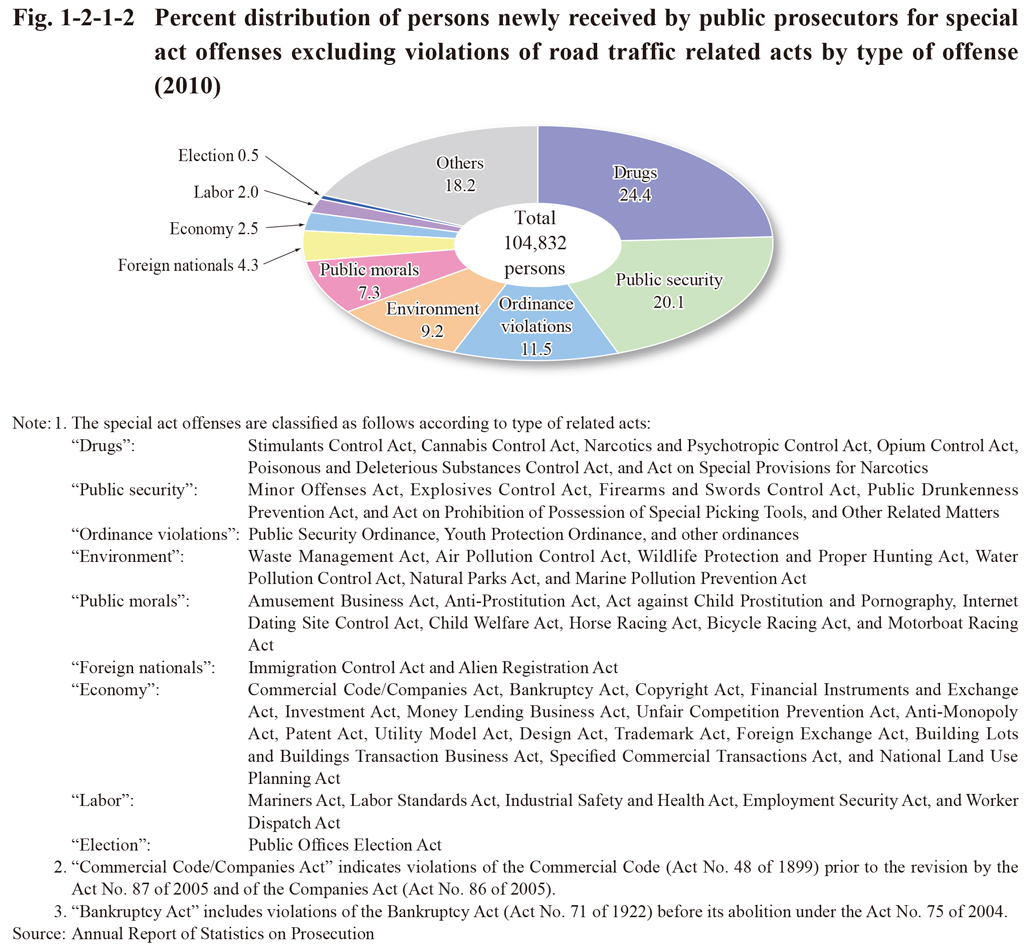
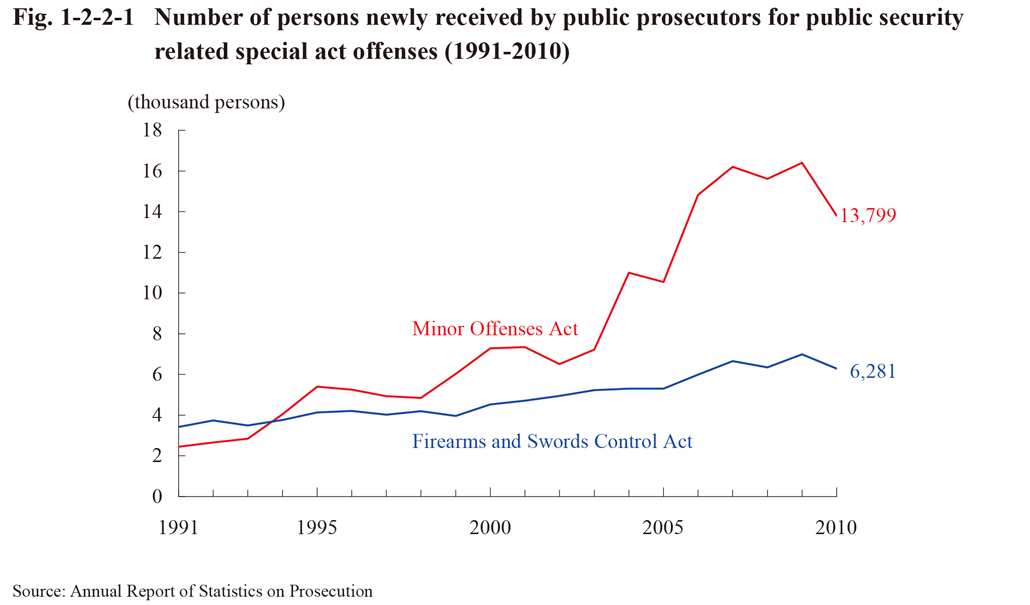 Fig. 1-2-2-1 Number of persons newly received by public prosecutors for public security
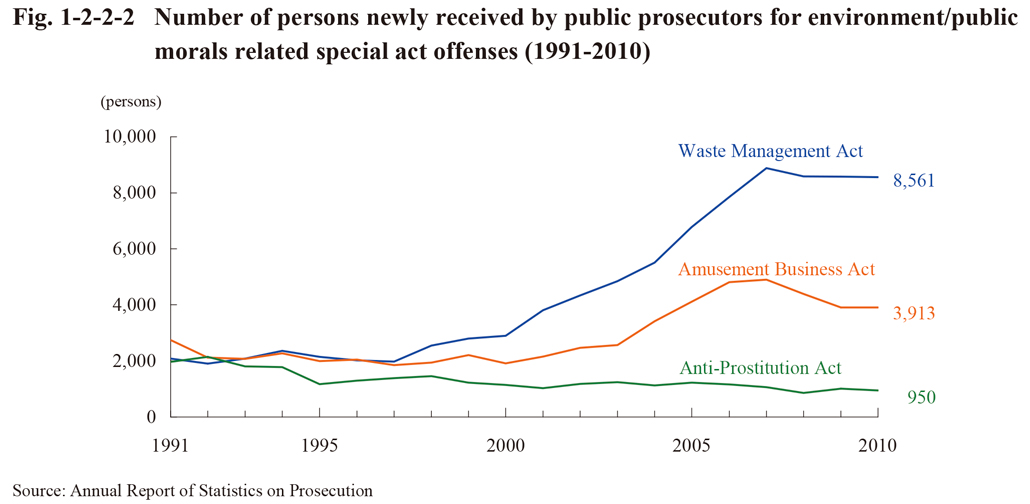
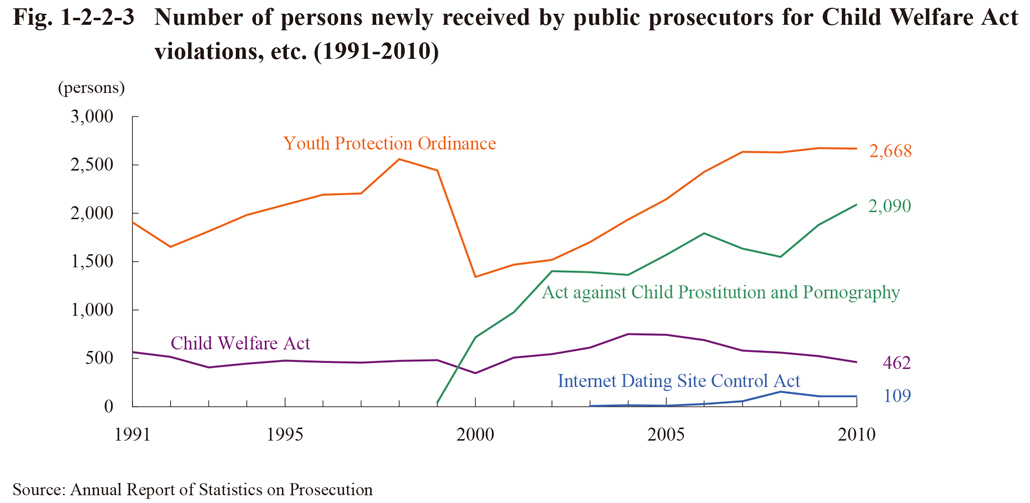
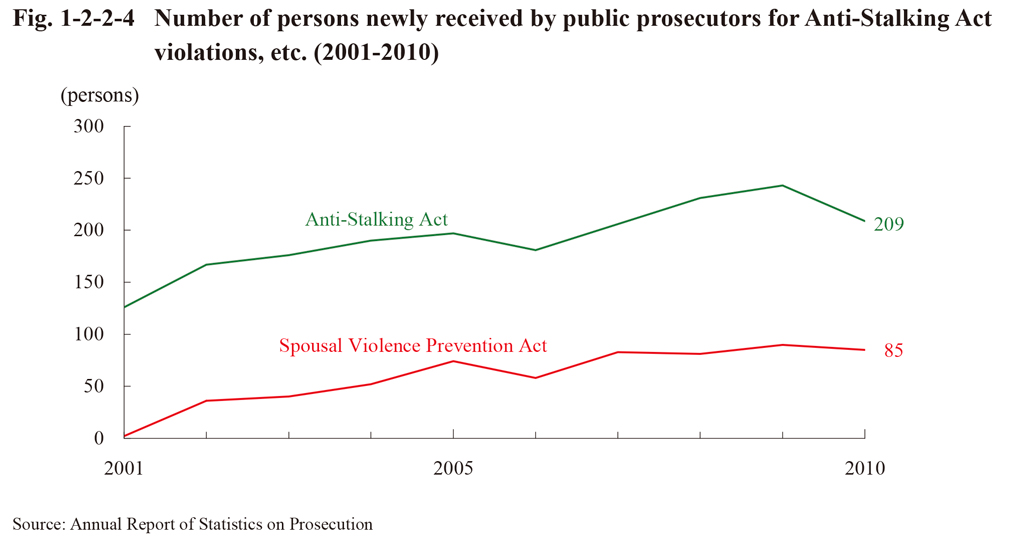 Fig. 1-2-2-4 Number of persons newly received by public prosecutors for Anti-Stalking Act
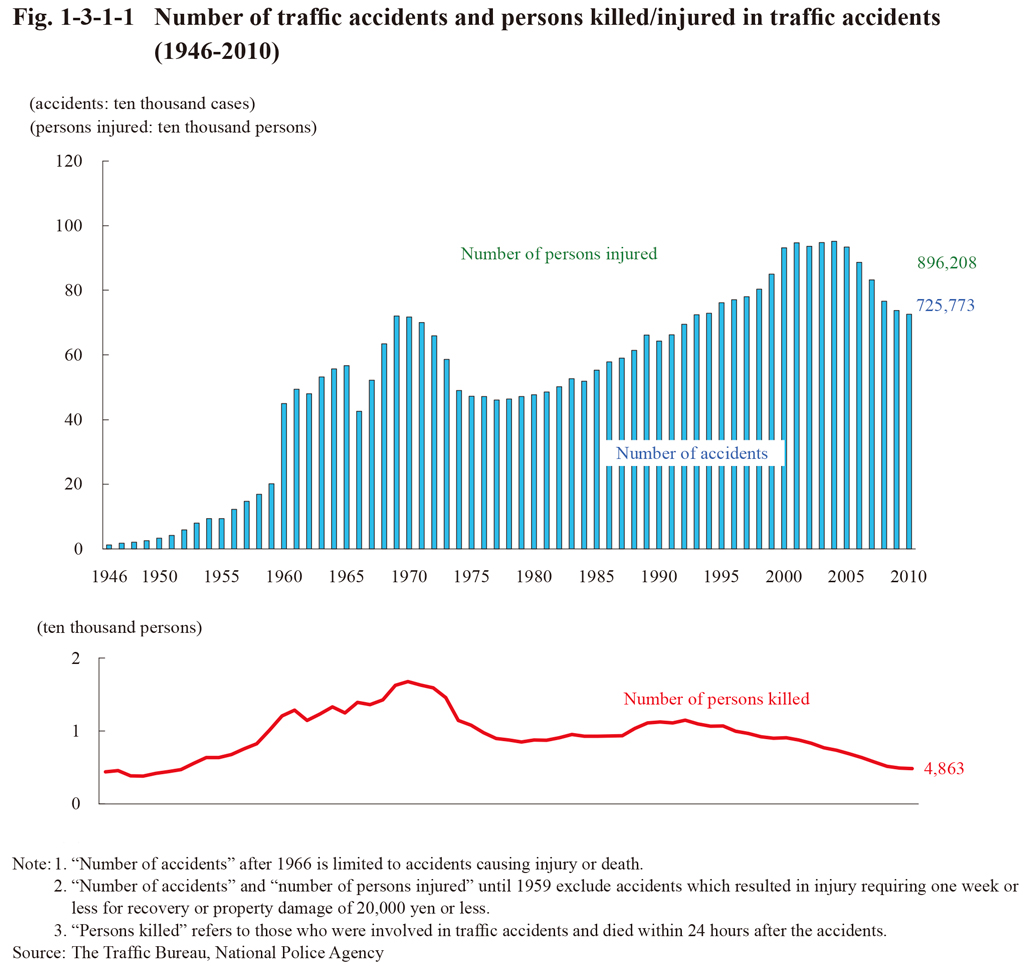 Fig. 1-3-1-1 Number of traffic accidents and persons killed/injured in traffic accidents(1946-2010)
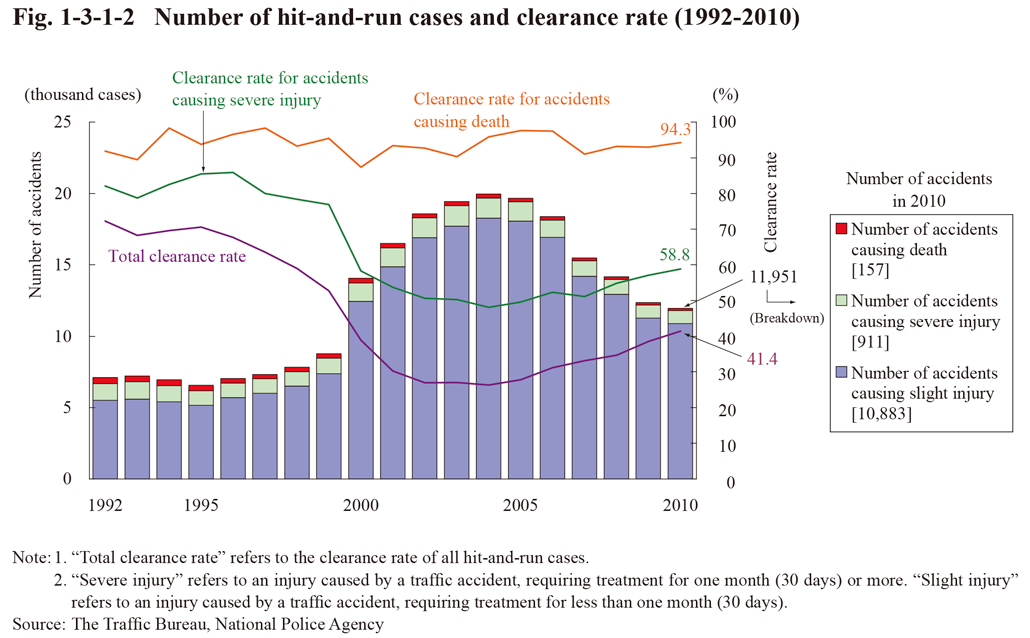 Fig. 1-3-1-2 Number of hit-and-run cases and clearance rate (1992-2010)
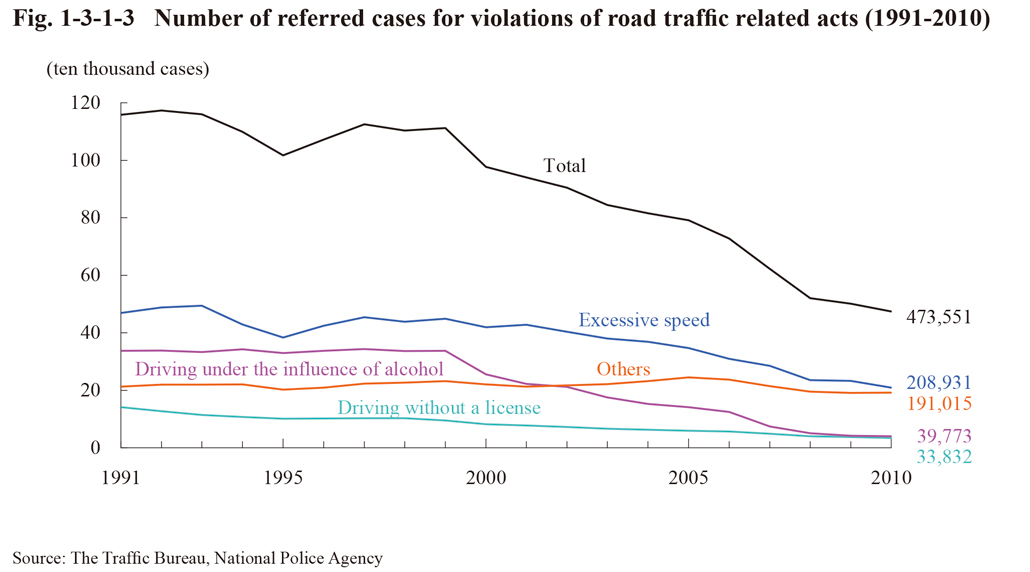 Fig. 1-3-1-3 Number of referred cases for violations of road traffic related acts (1991-2010)
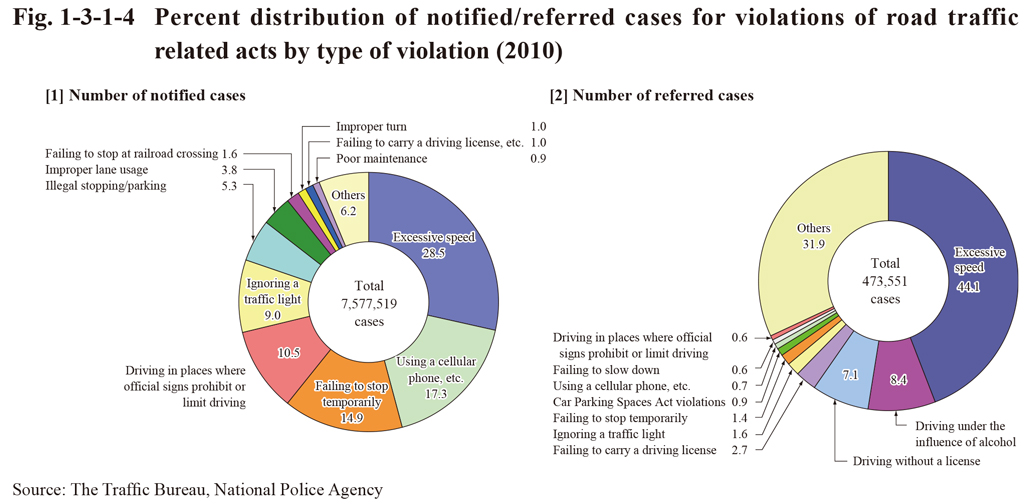
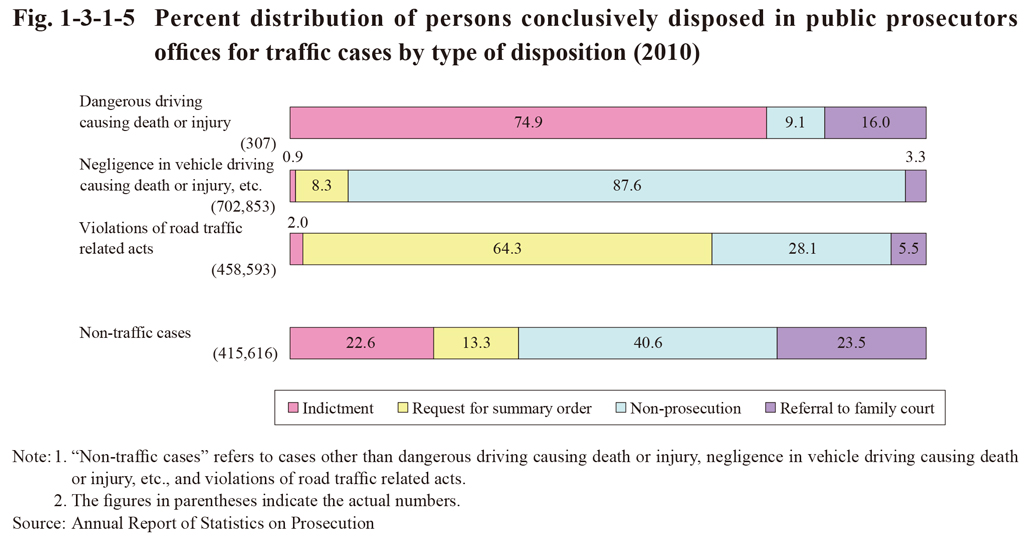
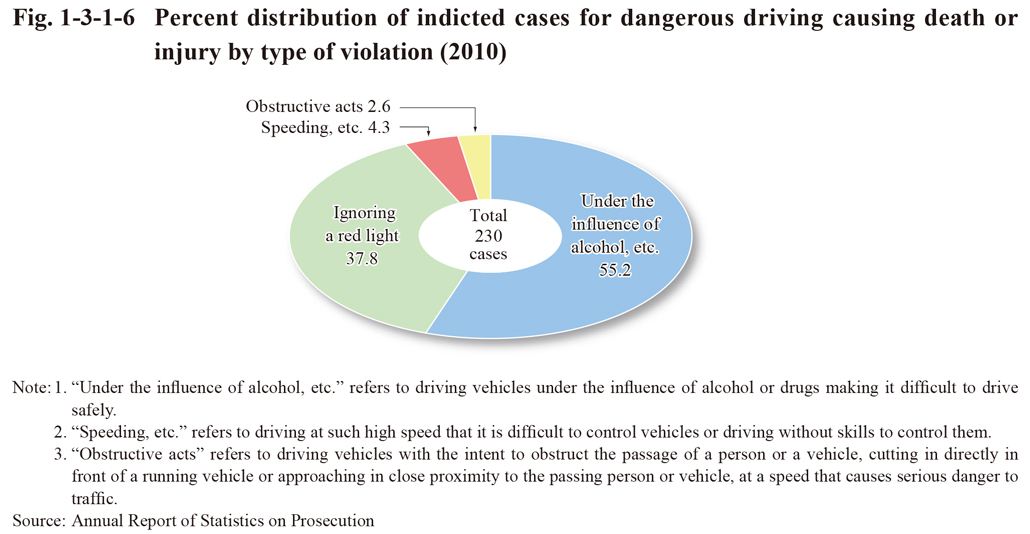
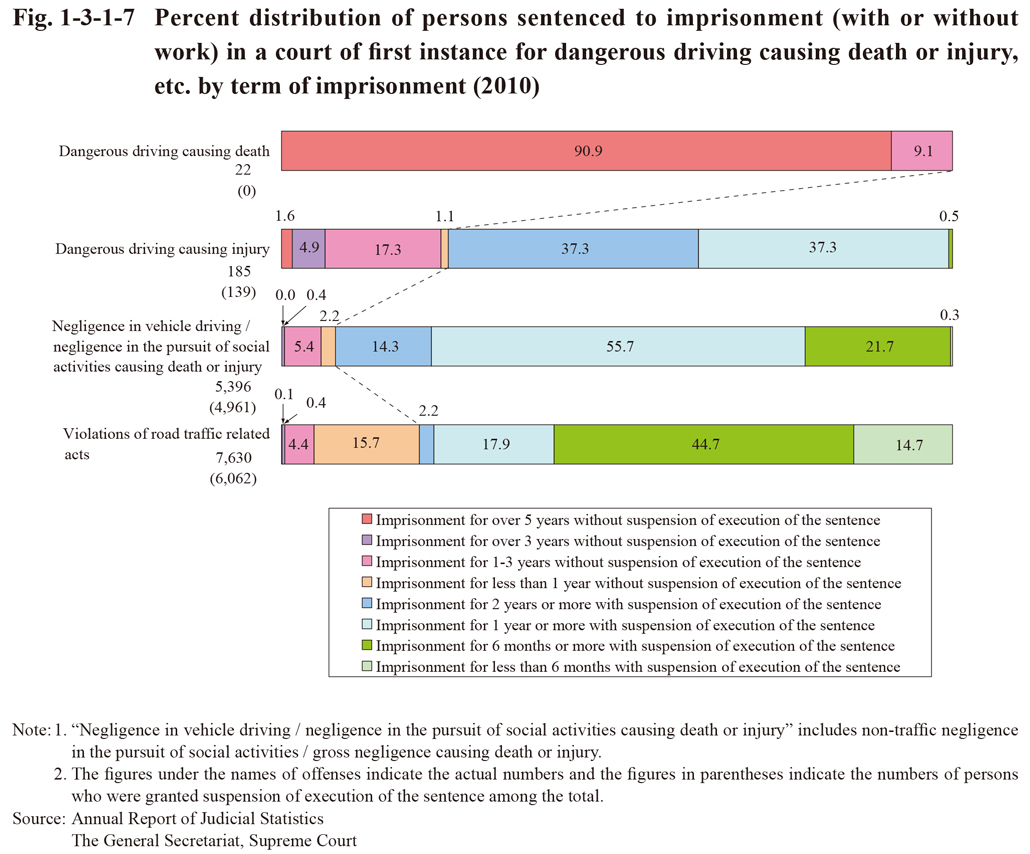
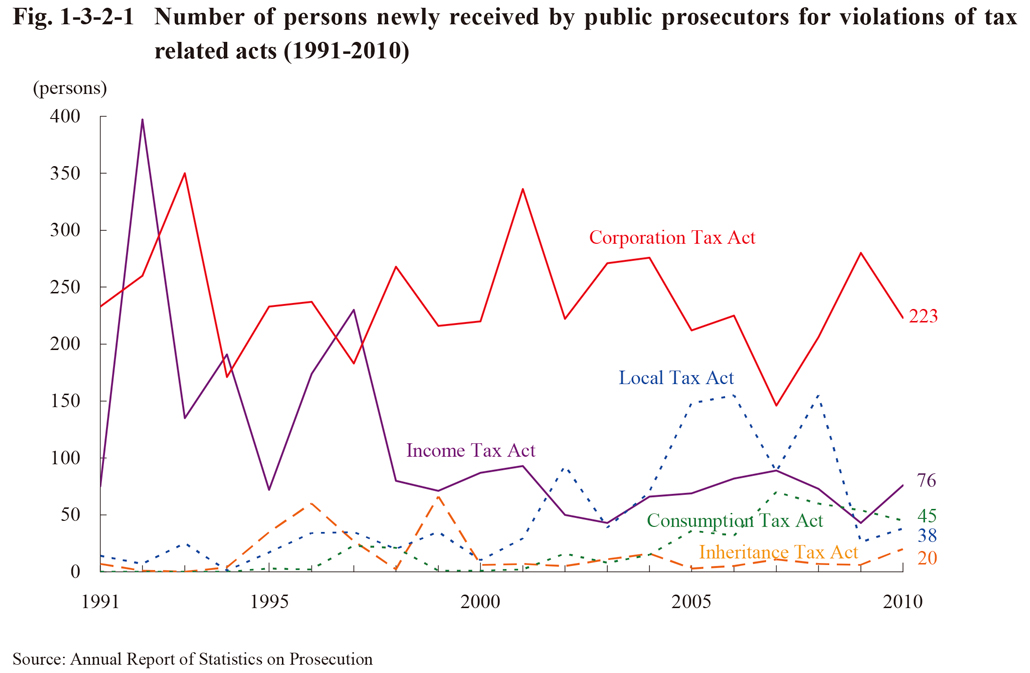
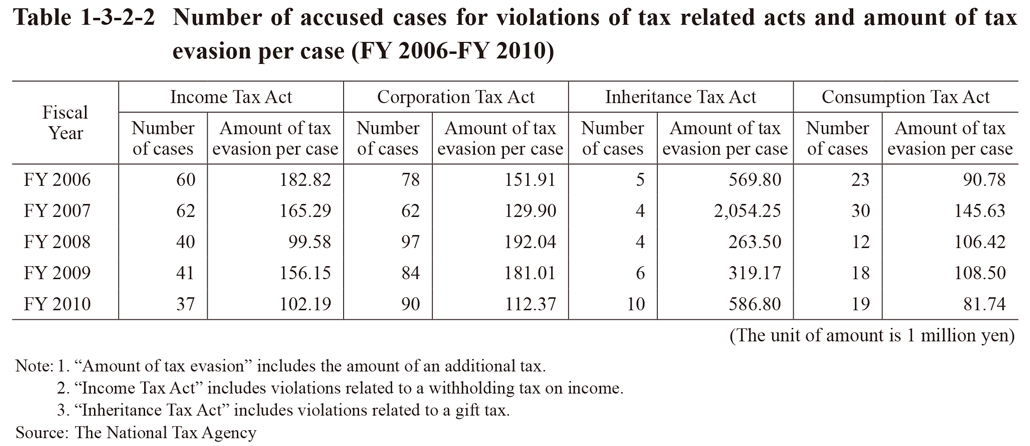
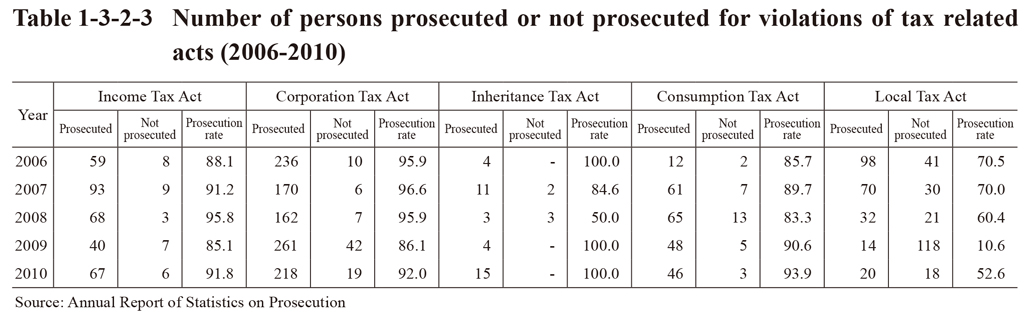
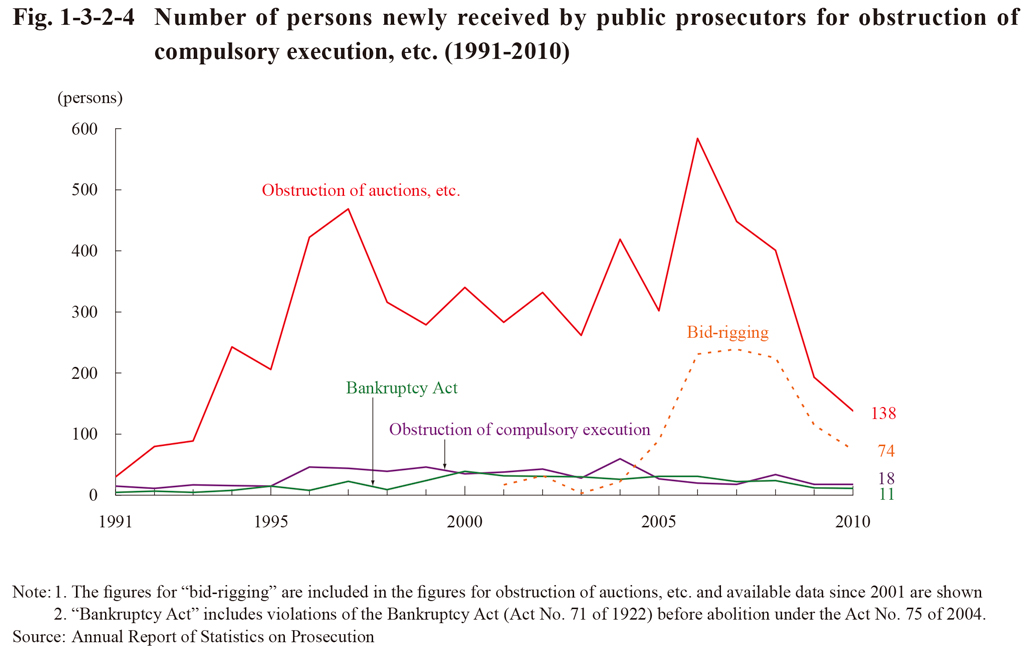
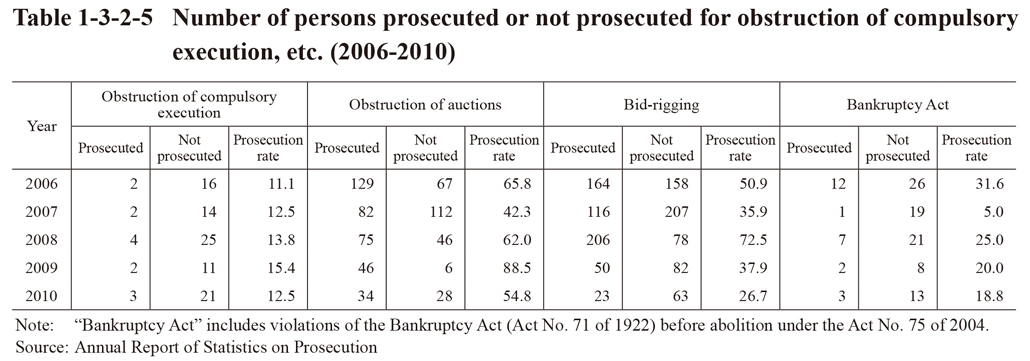
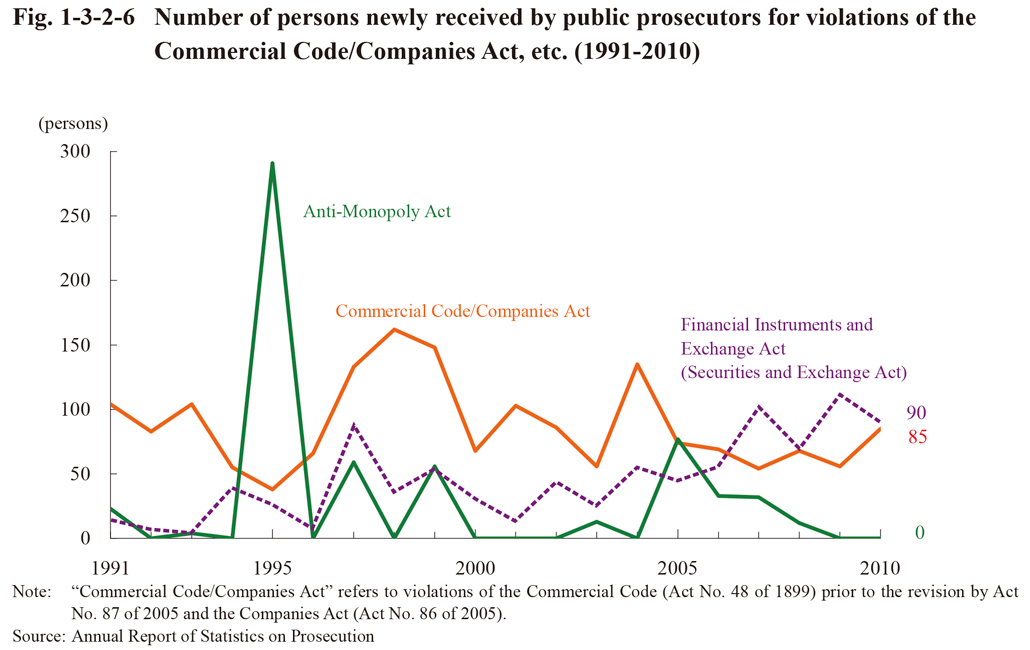
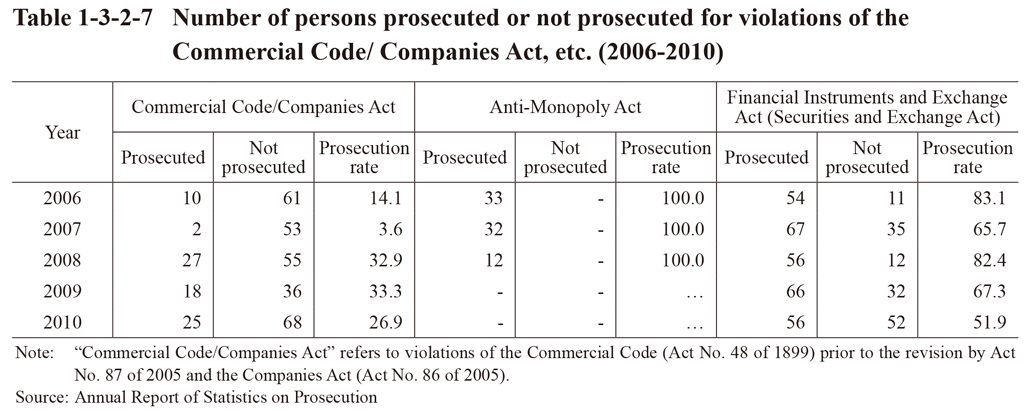
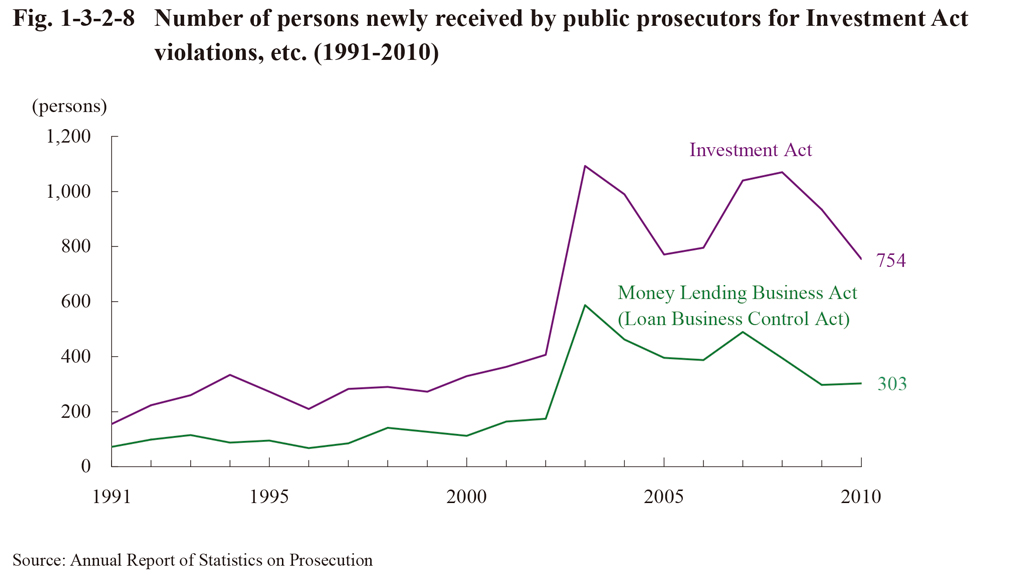
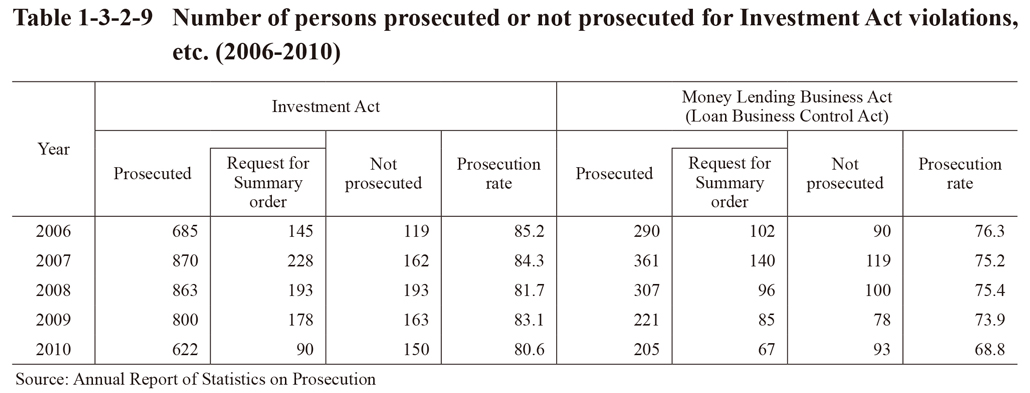
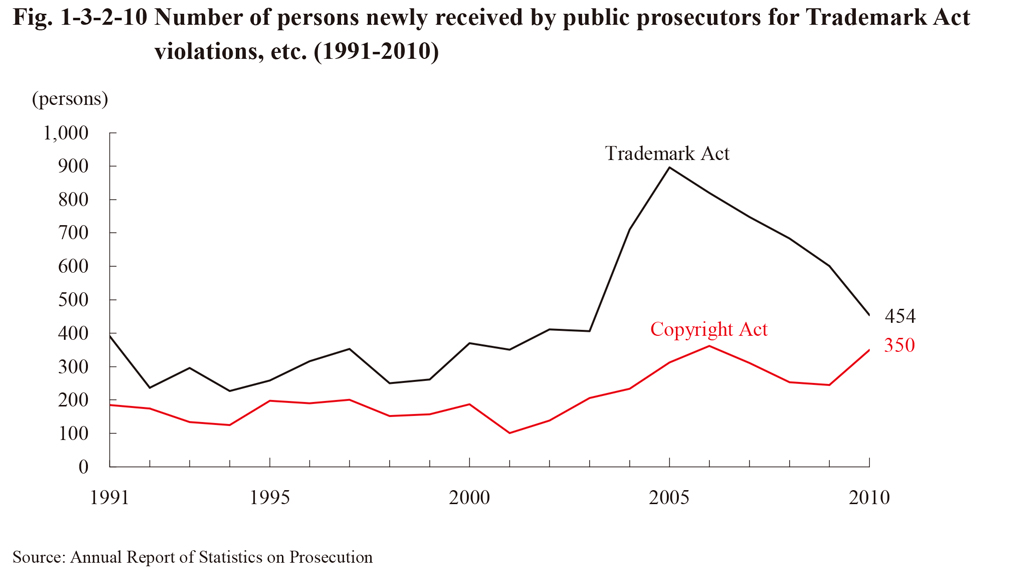
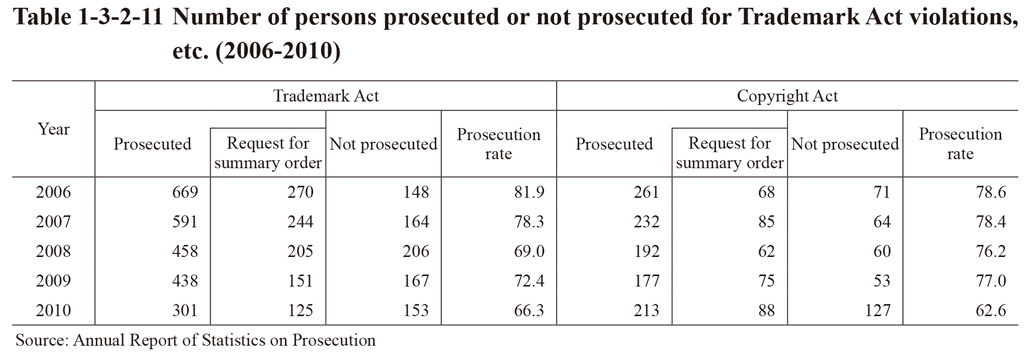
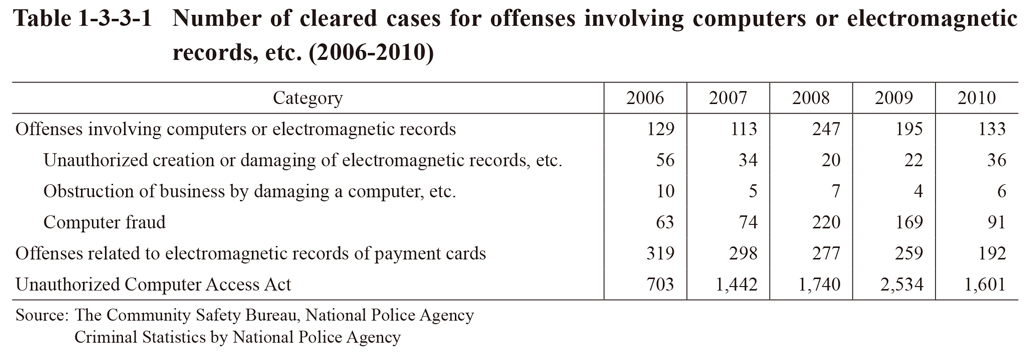
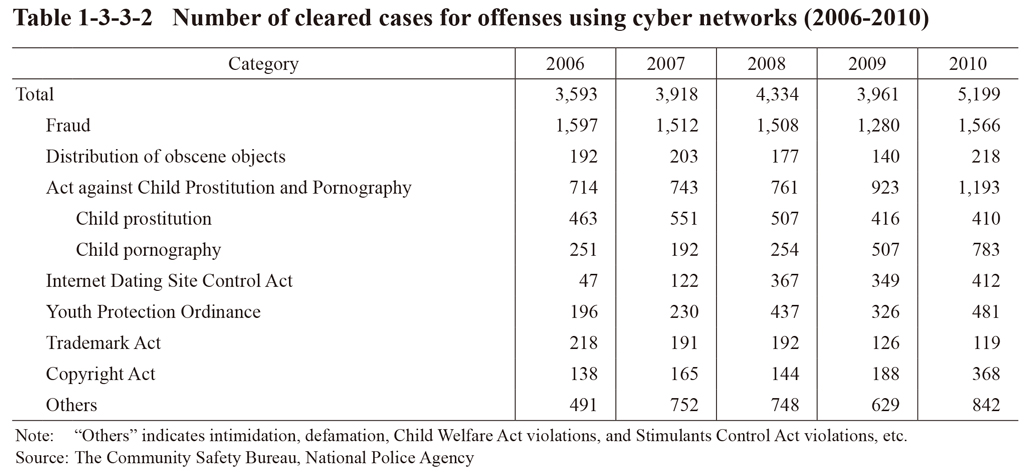 Table 1-3-3-2 Number of cleared cases for offenses using cyber networks (2006-2010)
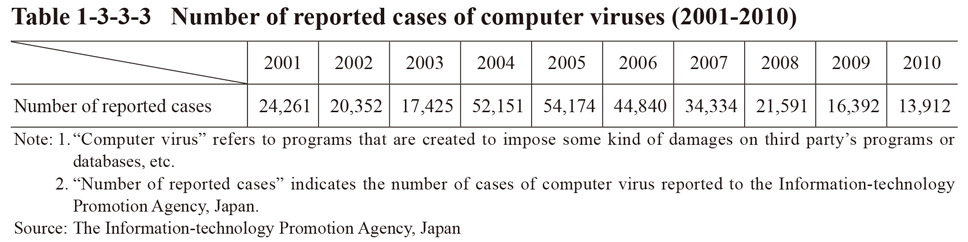 Table 1-3-3-3 Number of reported cases of computer viruses (2001-2010)
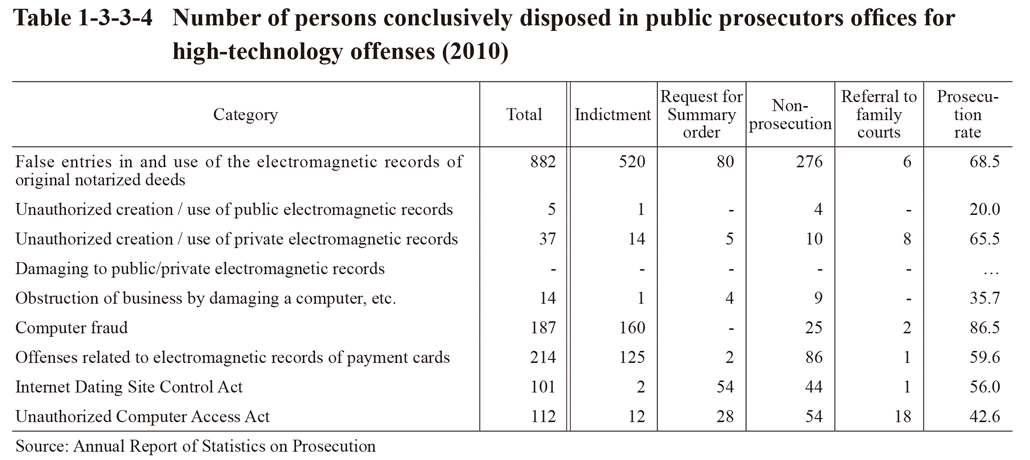
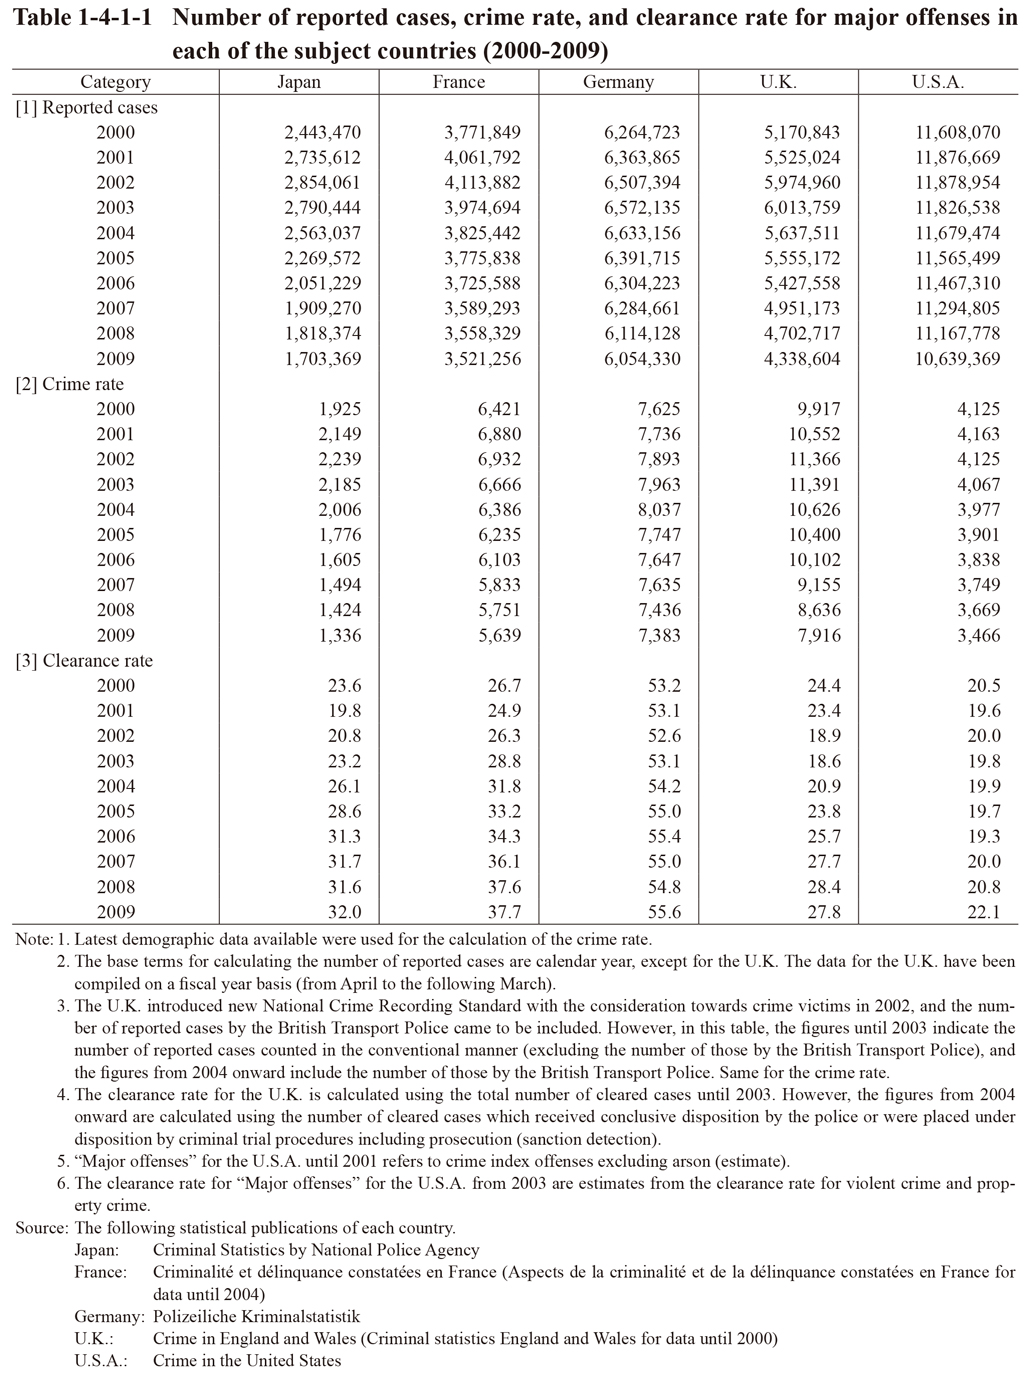
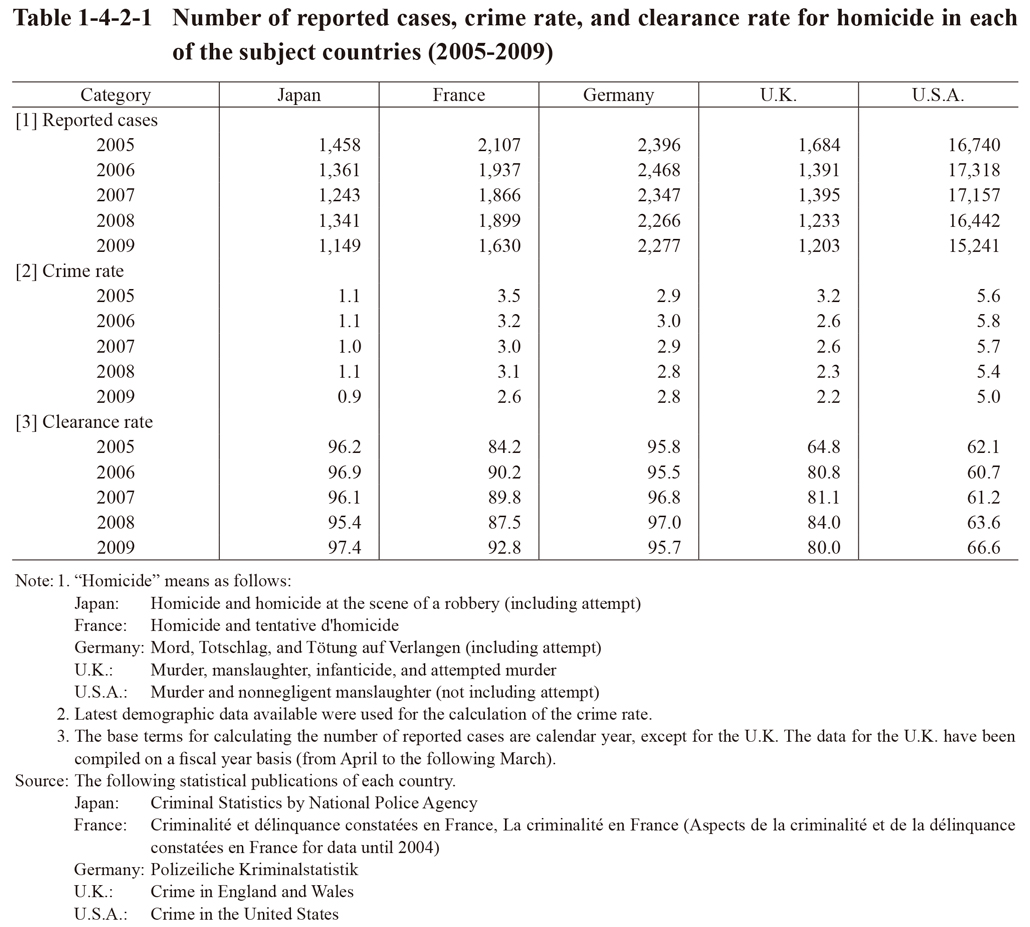
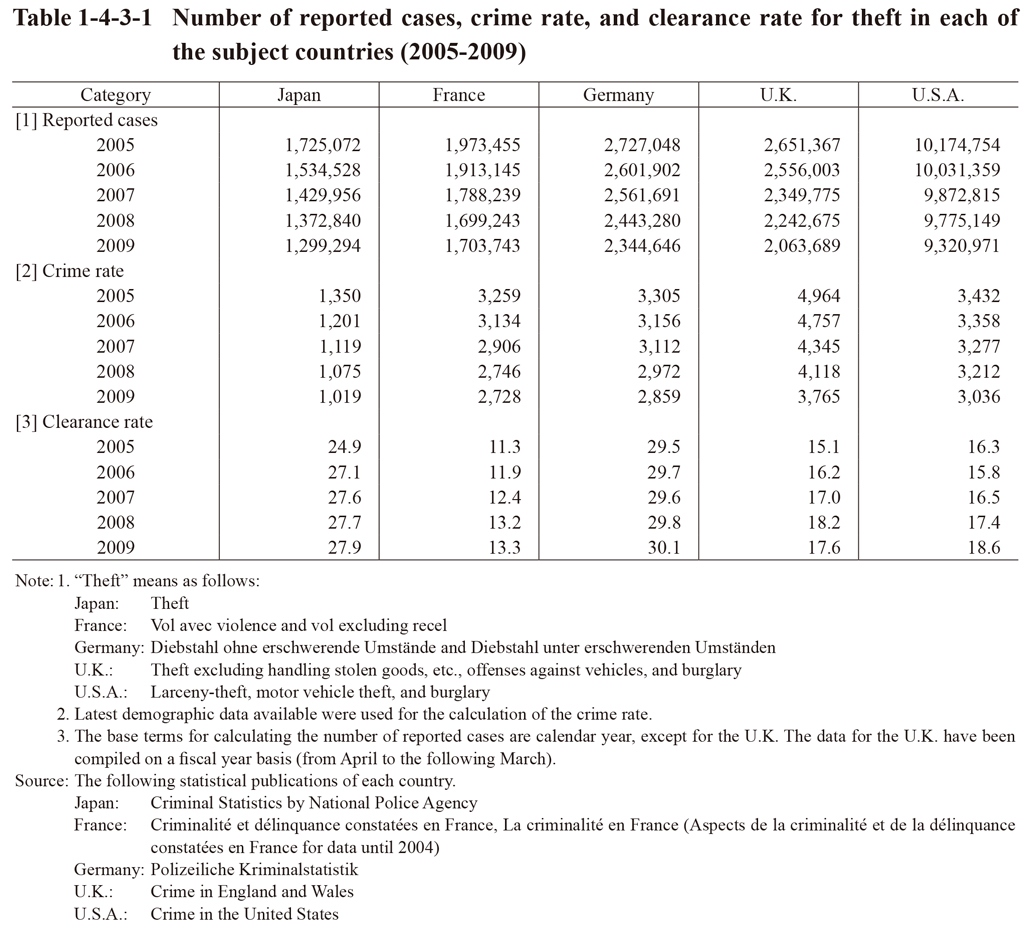
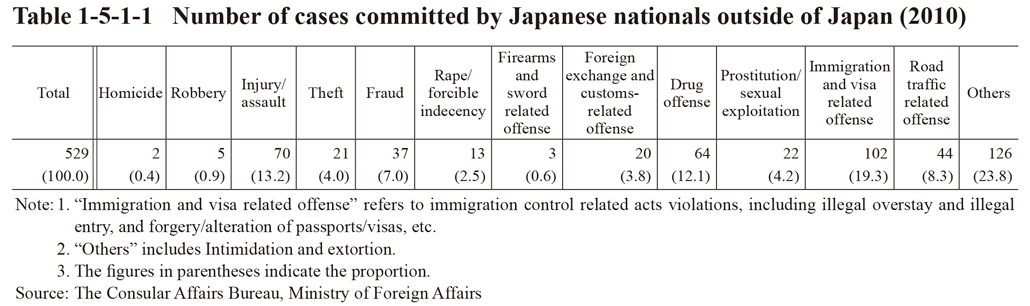 Table 1-5-1-1 Number of cases committed by Japanese nationals outside of Japan (2010)
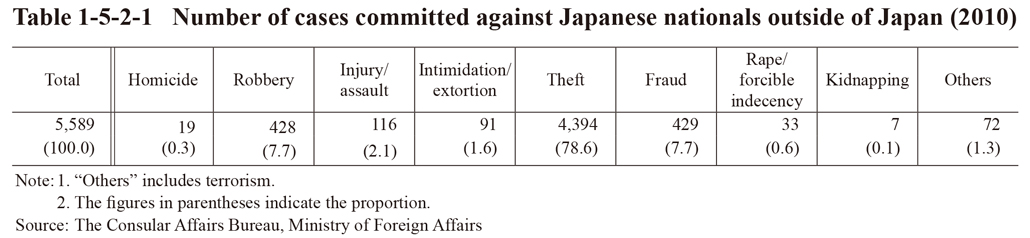 Table 1-5-2-1 Number of cases committed against Japanese nationals outside of Japan (2010)
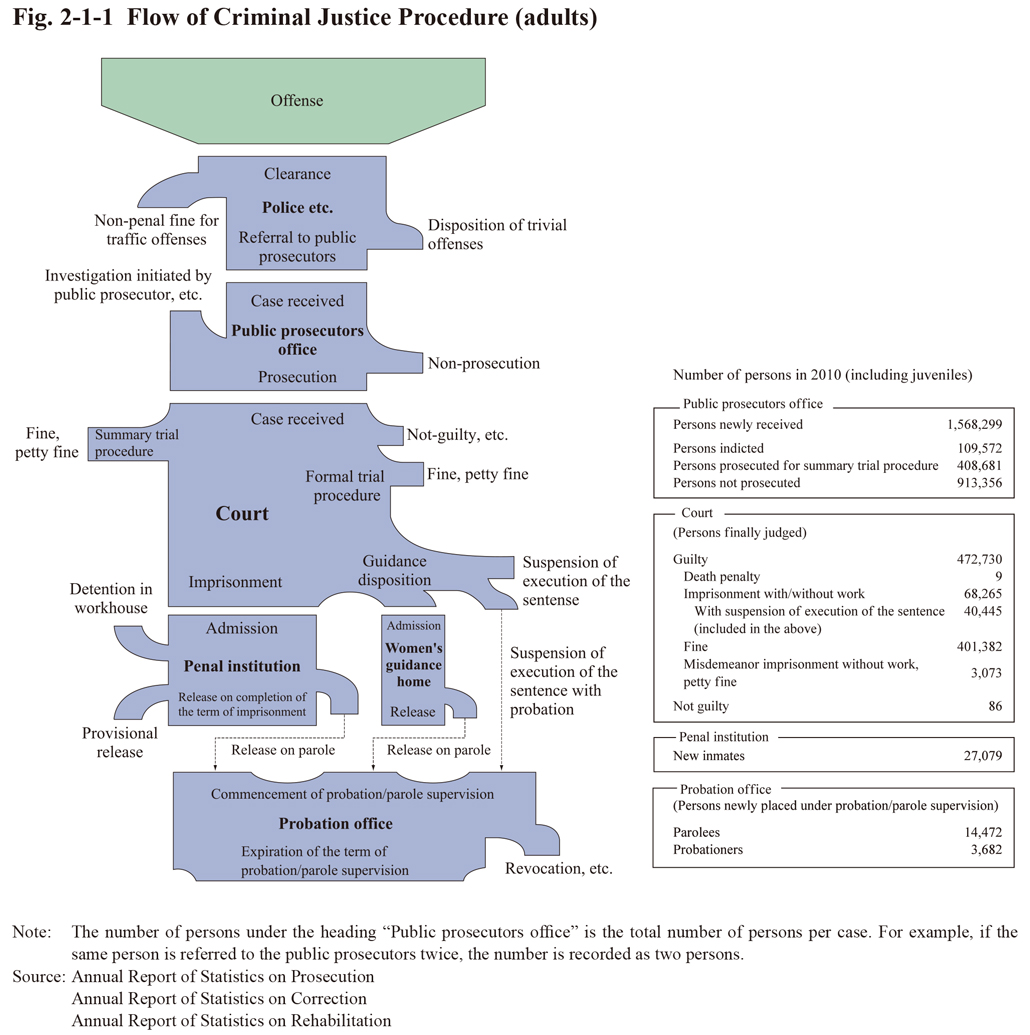 Fig. 2-1-1 Flow of Criminal Justice Procedure (adults)
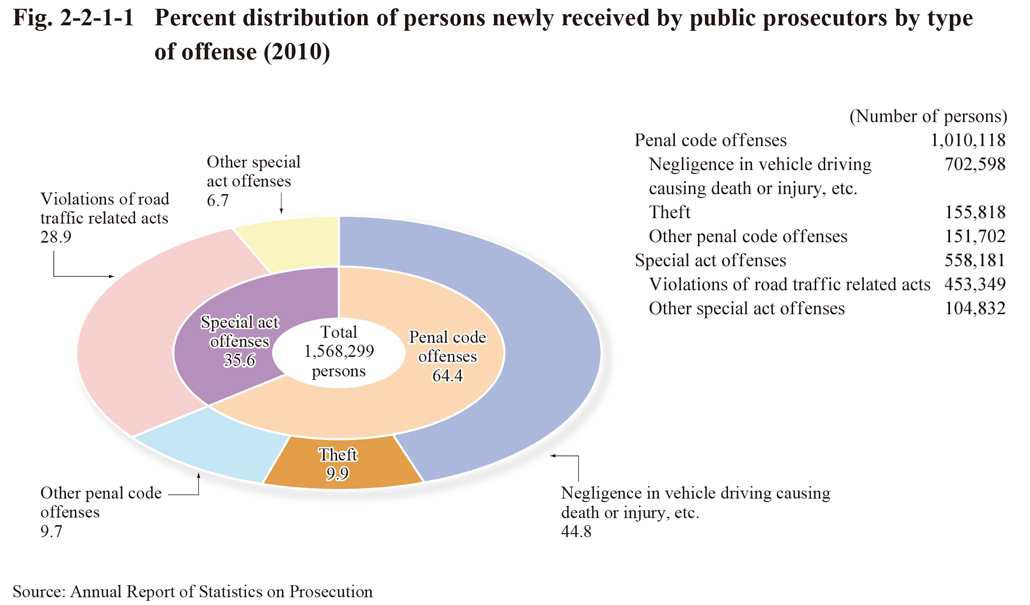
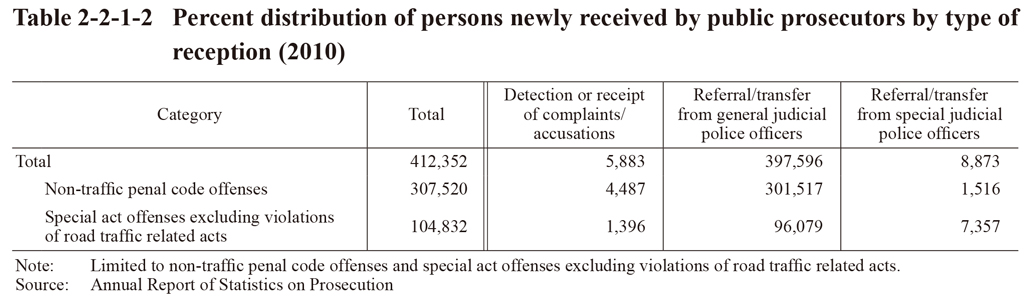
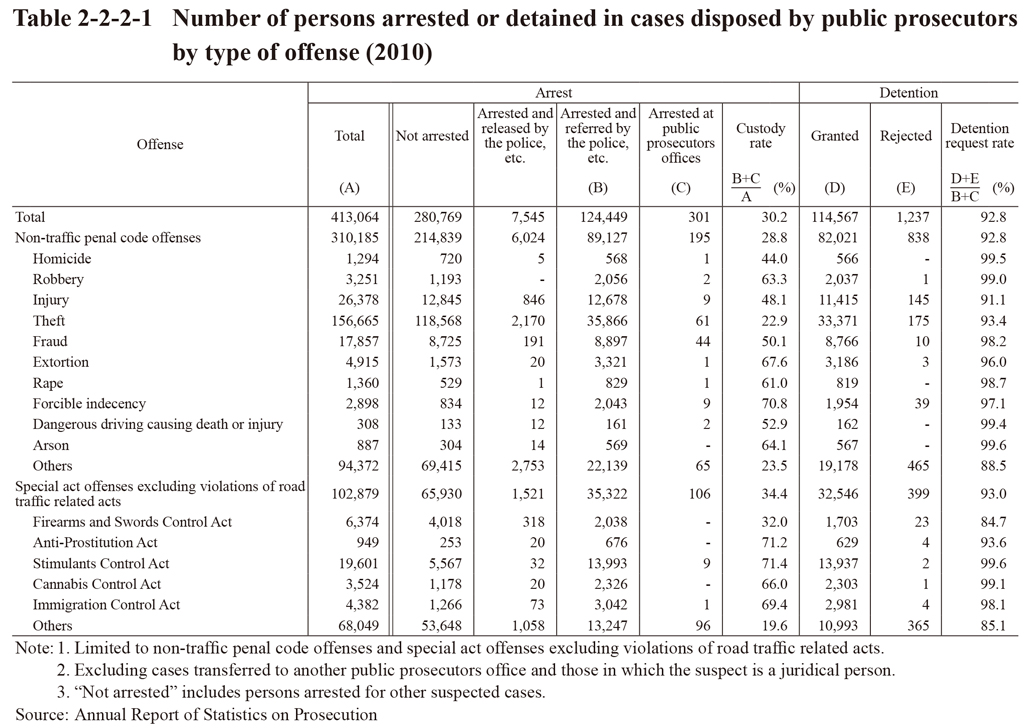
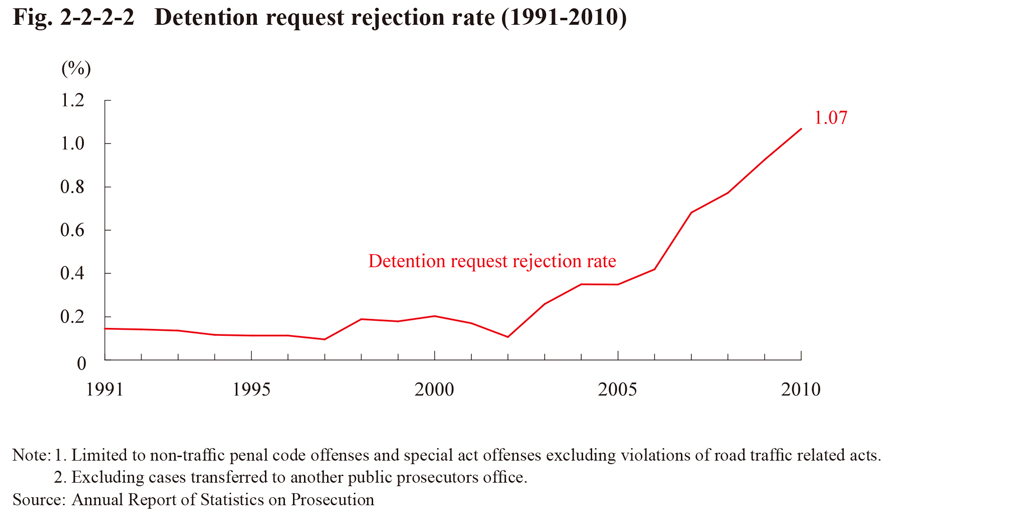 Fig. 2-2-2-2 Detention request rejection rate (1991-2010)
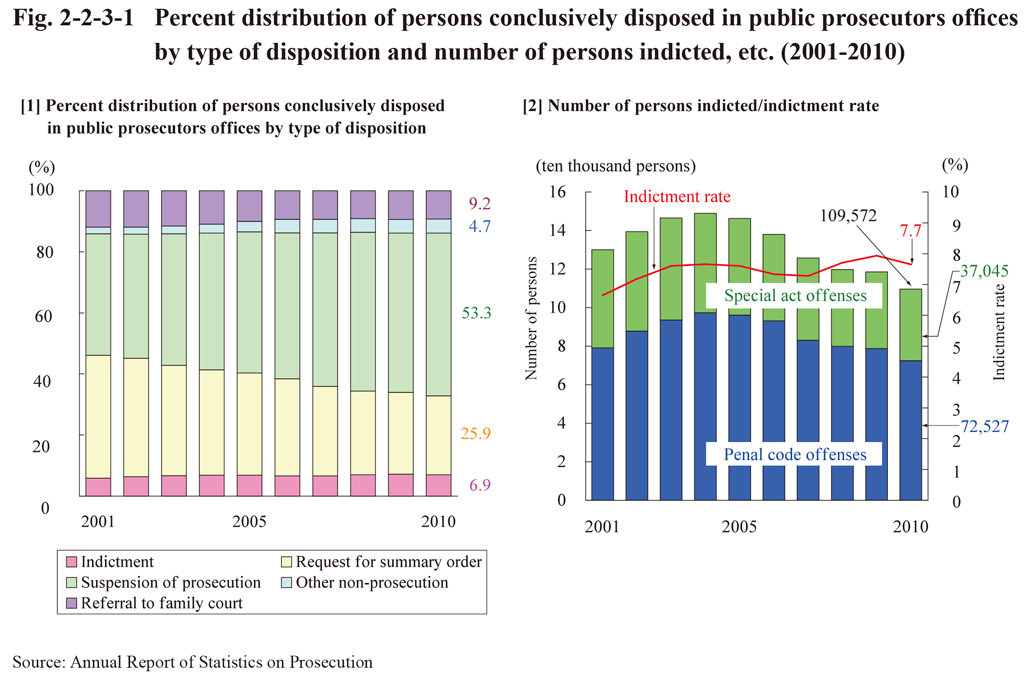
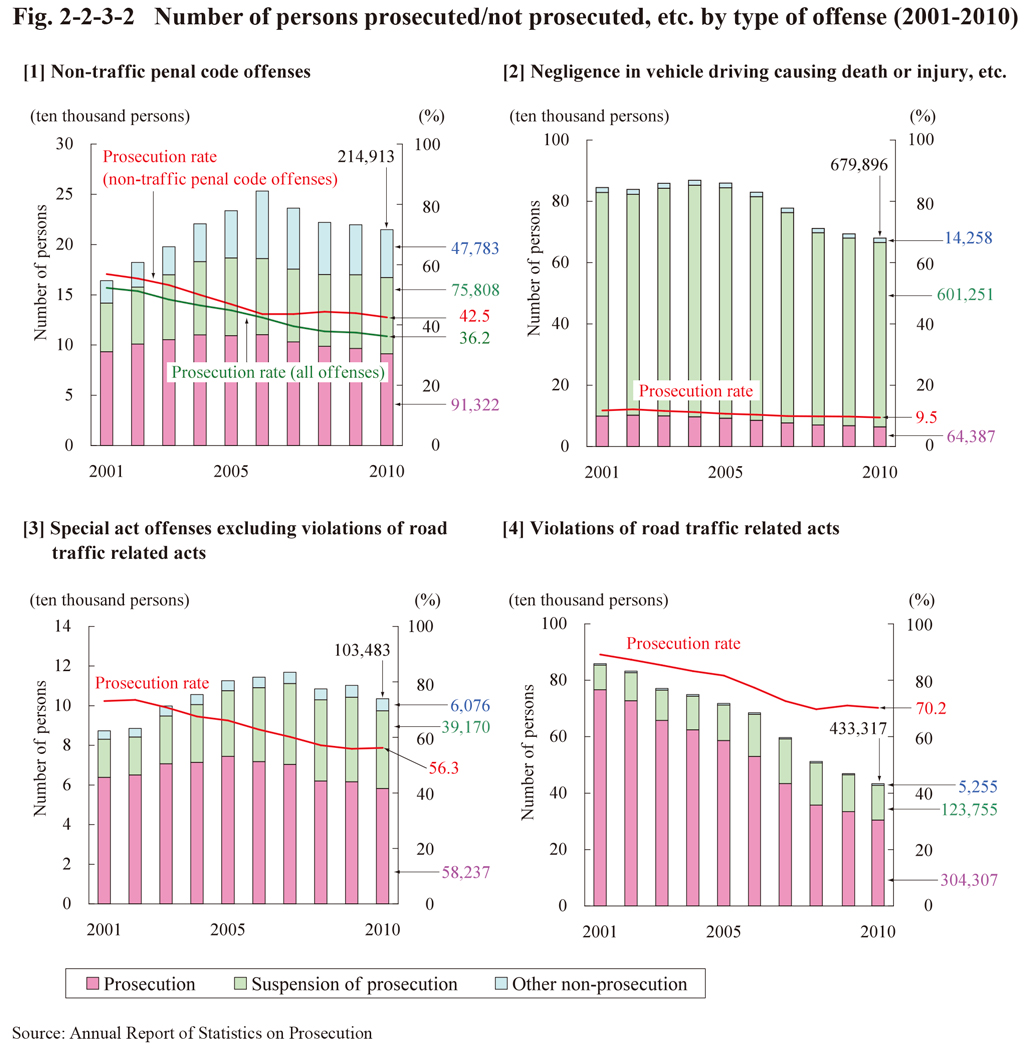 Fig. 2-2-3-2 Number of persons prosecuted/not prosecuted, etc. by type of offense (2001-2010)
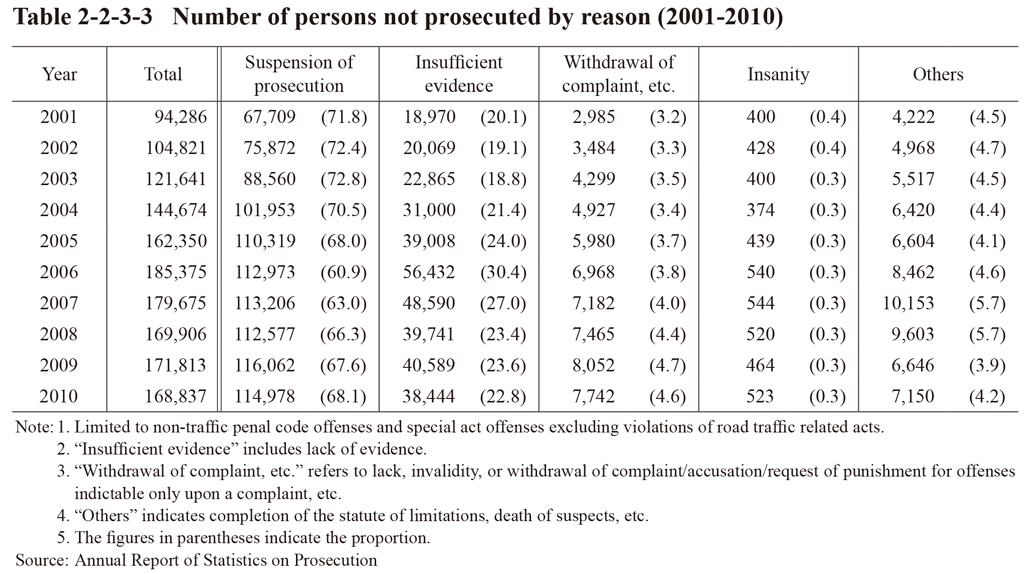 Table 2-2-3-3 Number of persons not prosecuted by reason (2001-2010)
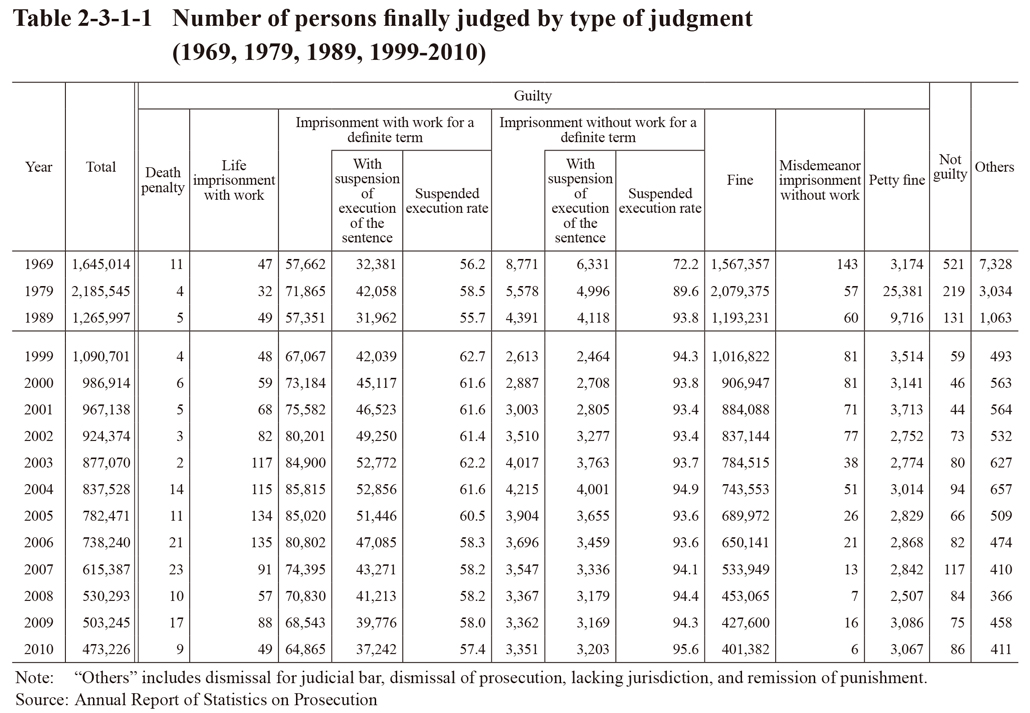 Table 2-3-1-1 Number of persons finally judged by type of judgment (1969, 1979, 1989, 1999-2010)
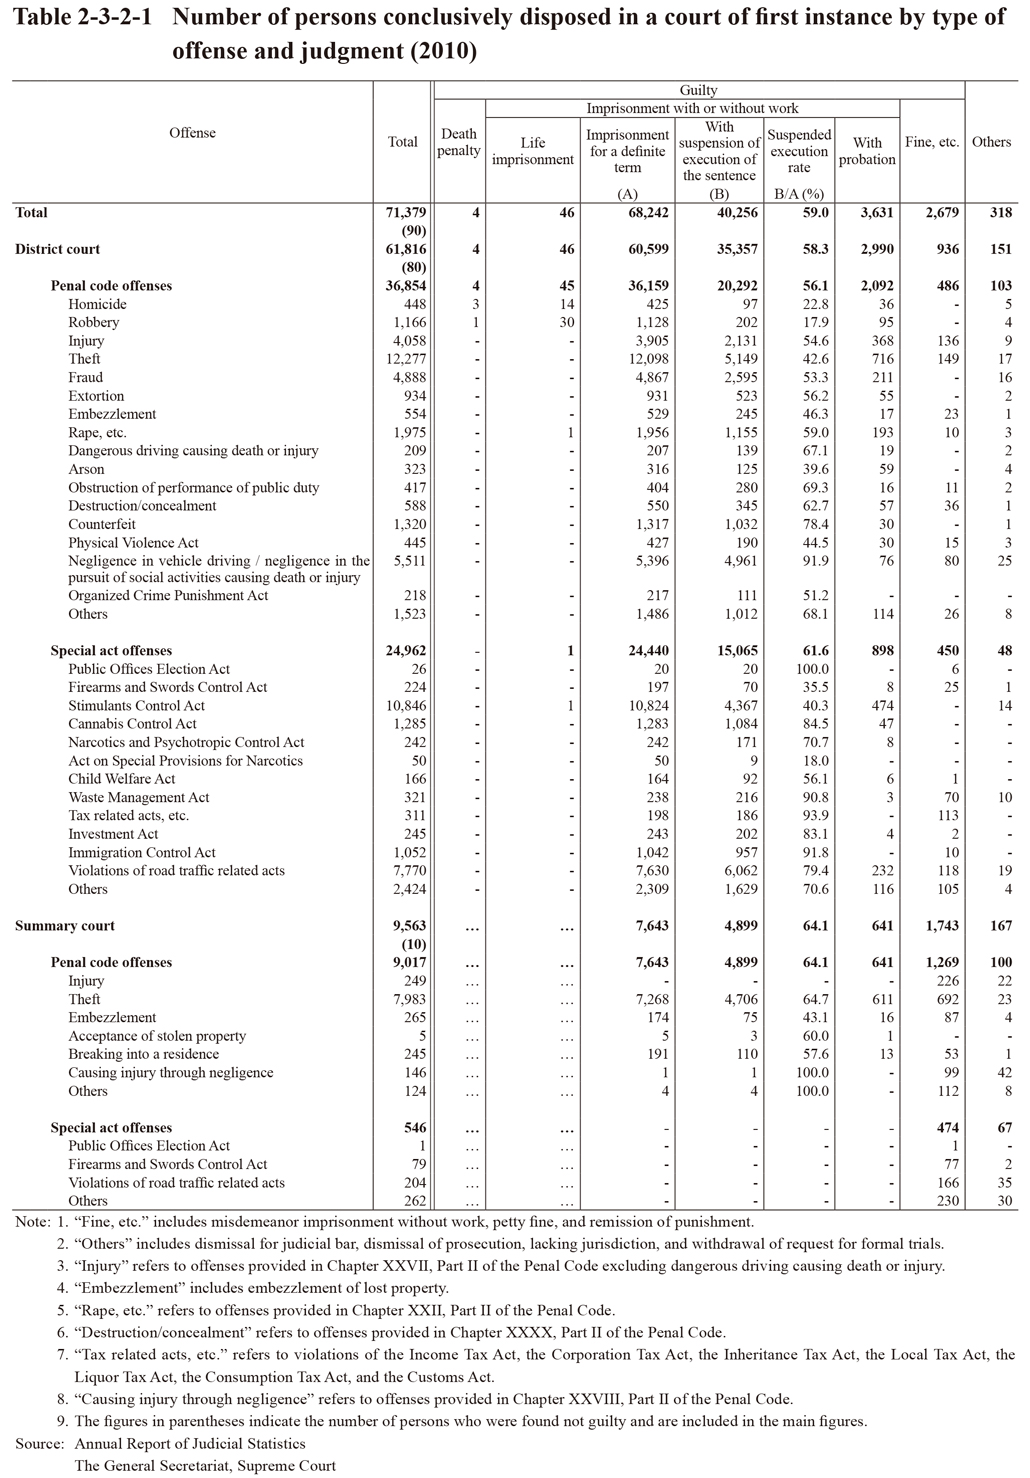
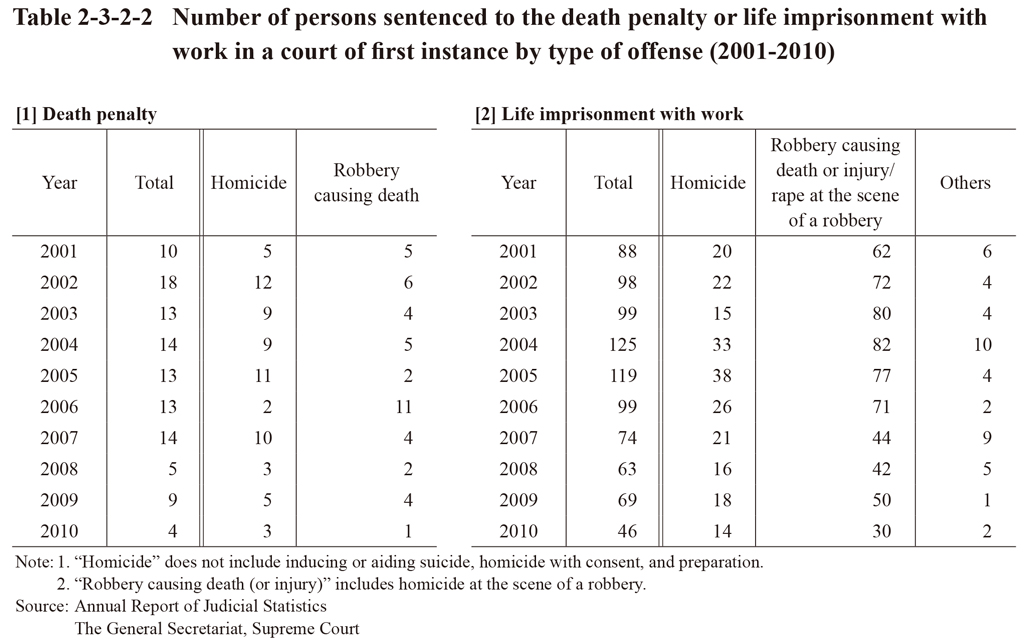
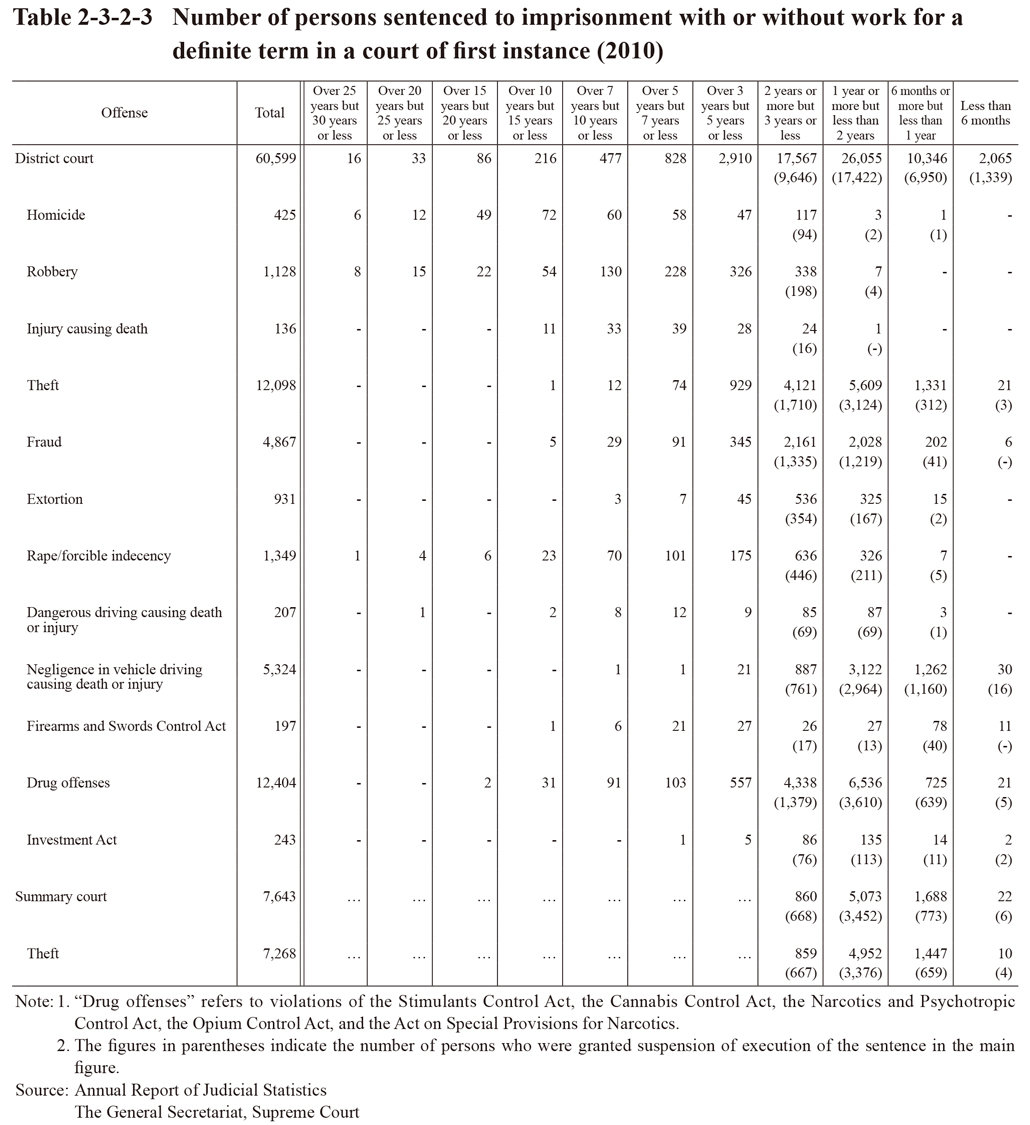
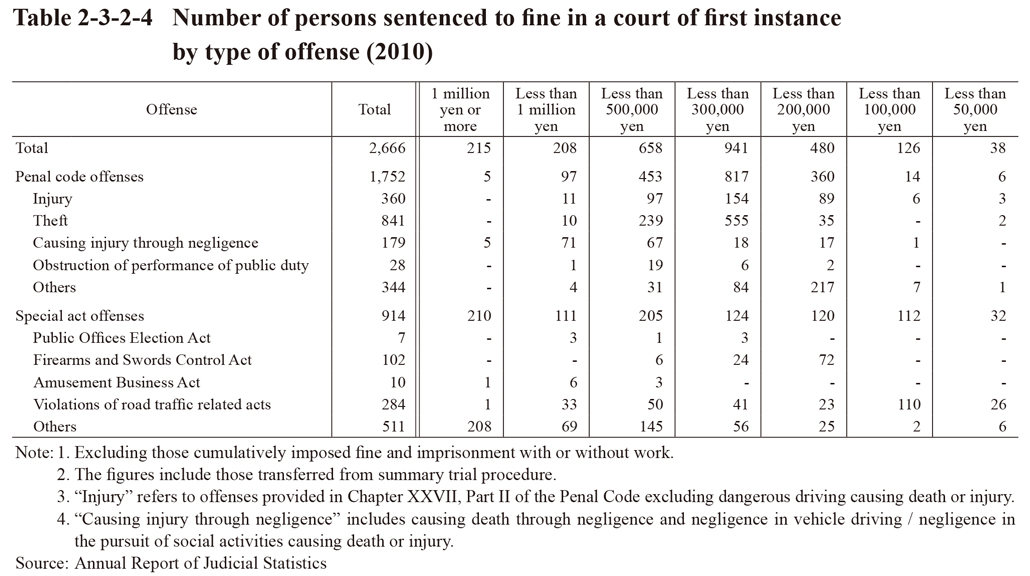
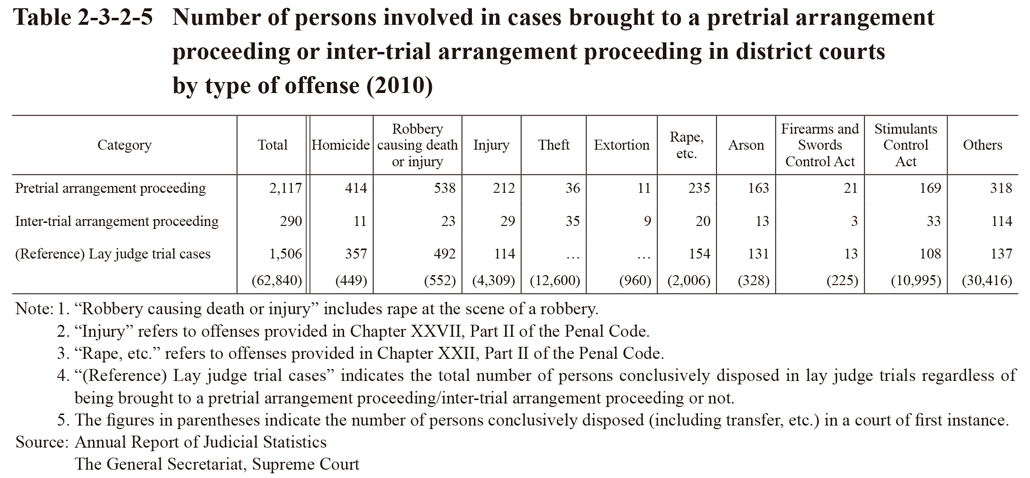
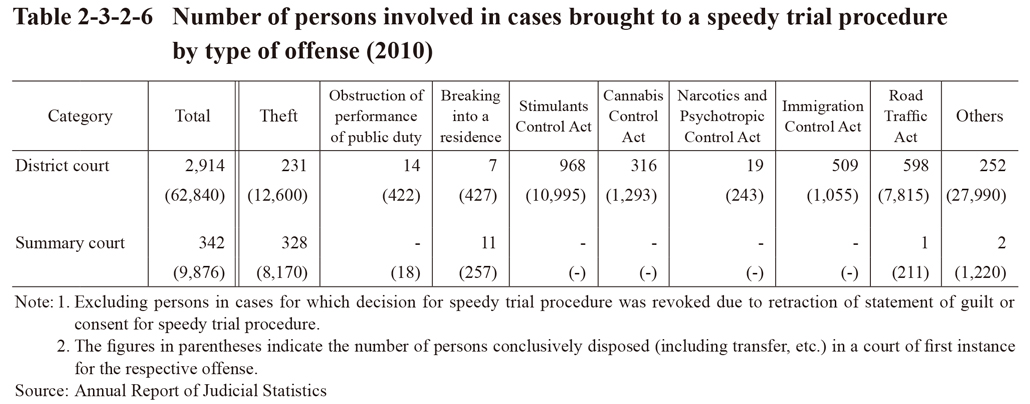
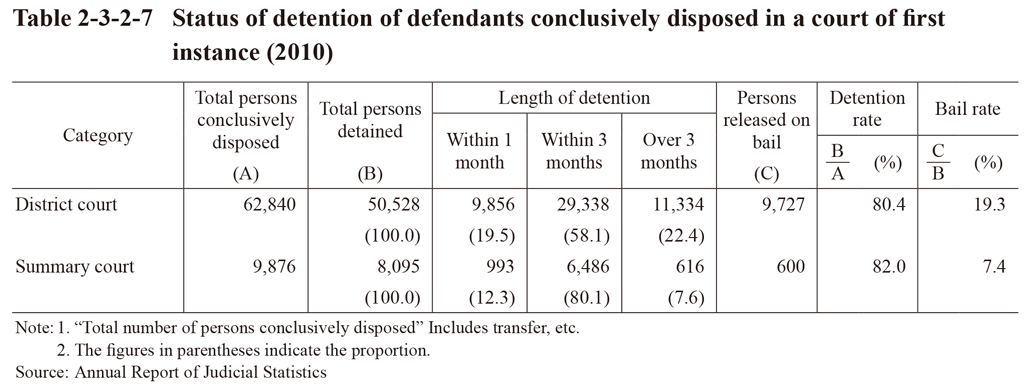
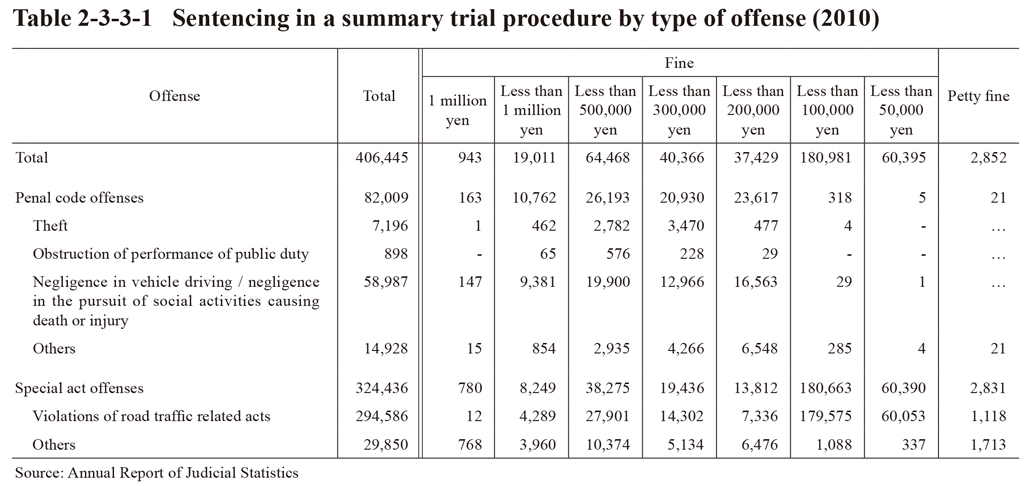 Table 2-3-3-1 Sentencing in a summary trial procedure by type of offense (2010)
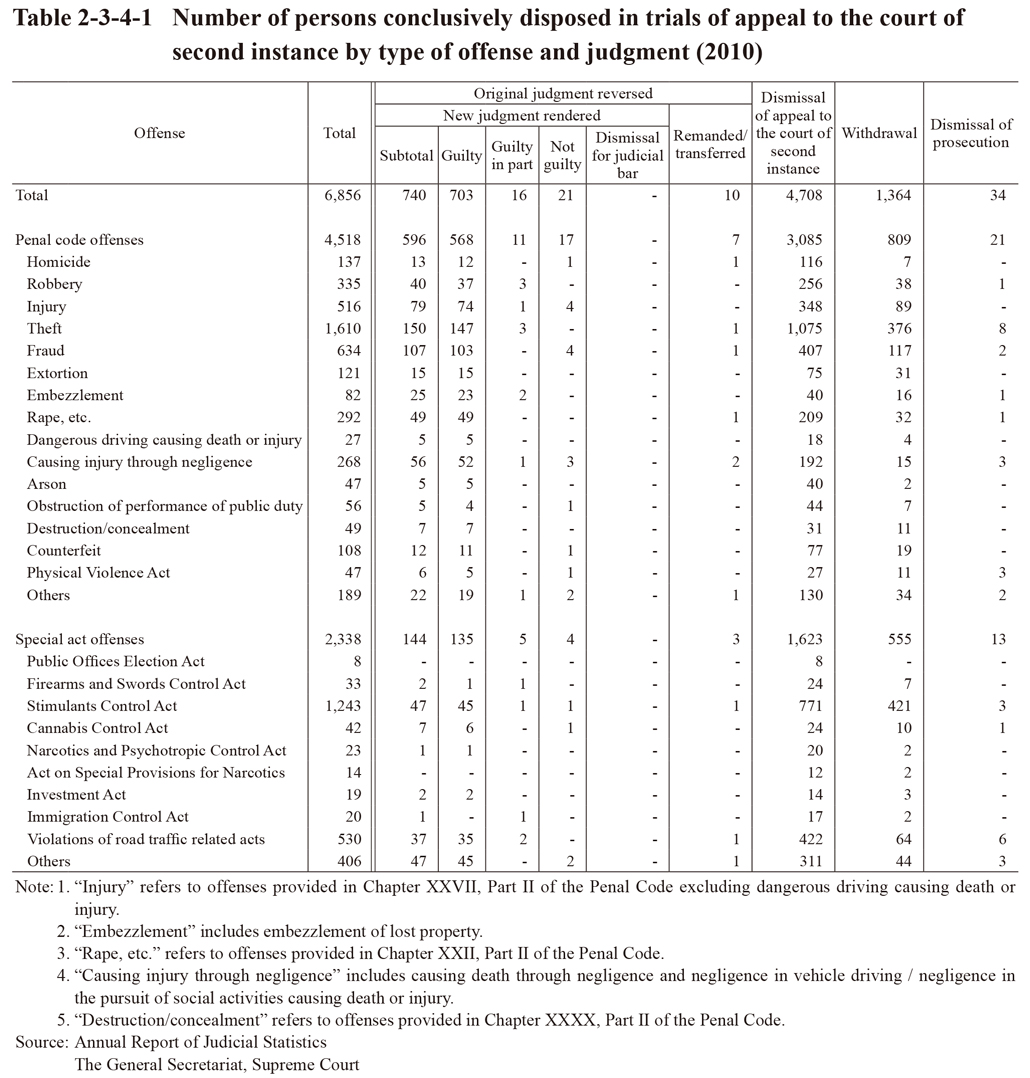
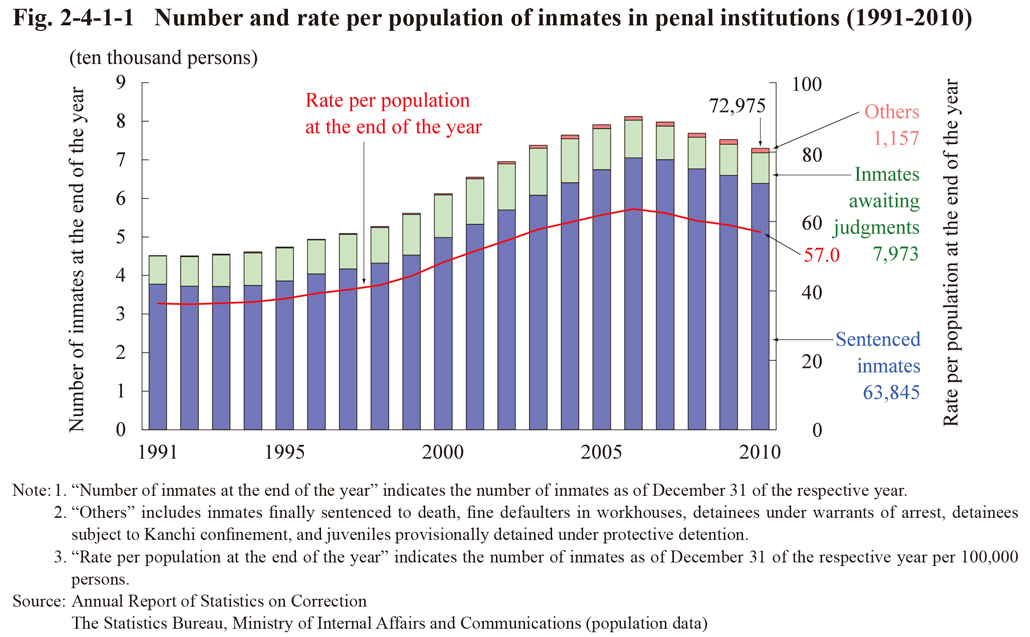 Fig. 2-4-1-1 Number and rate per population of inmates in penal institutions (1991-2010)
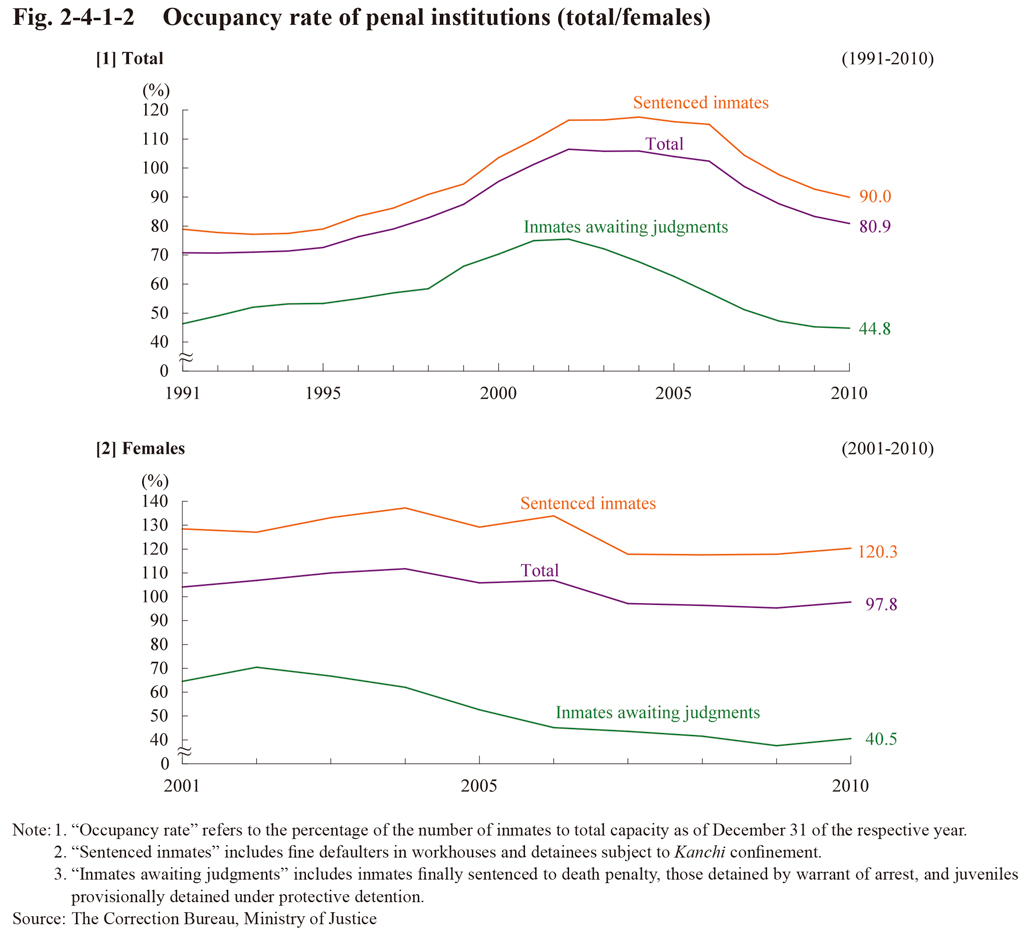 Fig. 2-4-1-2 Occupancy rate of penal institutions (total/females)
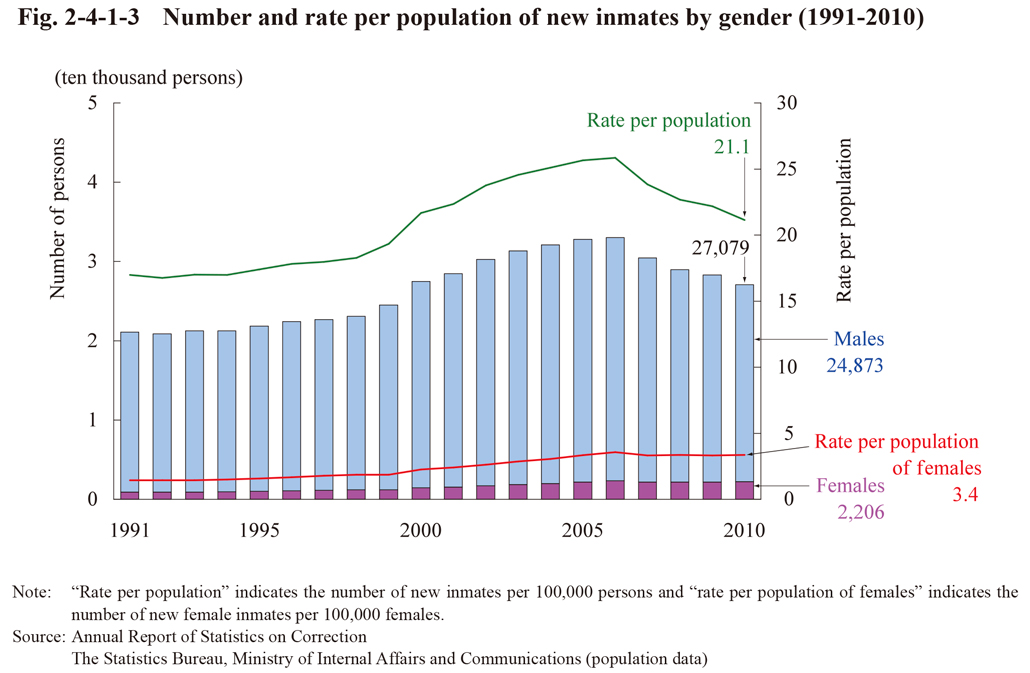 Fig. 2-4-1-3 Number and rate per population of new inmates by gender (1991-2010)
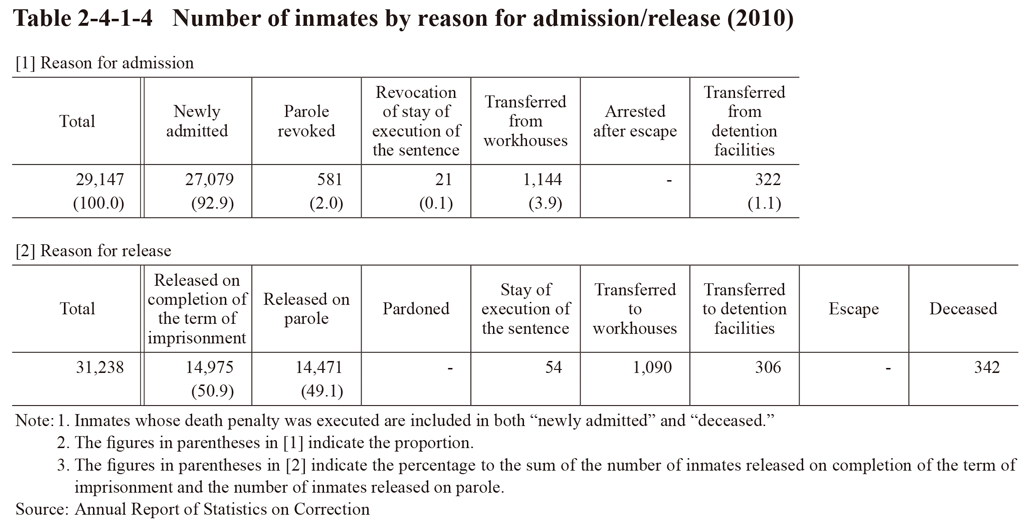 Table 2-4-1-4 Number of inmates by reason for admission/release (2010)
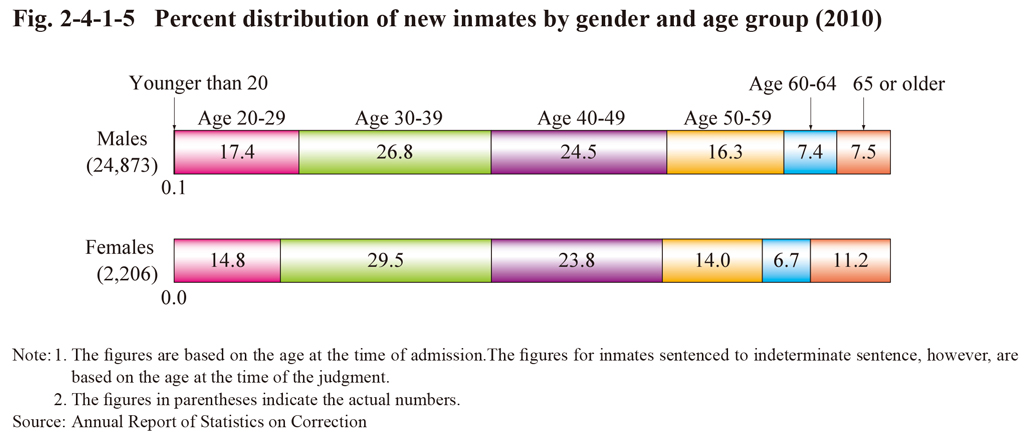 Fig. 2-4-1-5 Percent distribution of new inmates by gender and age group (2010)
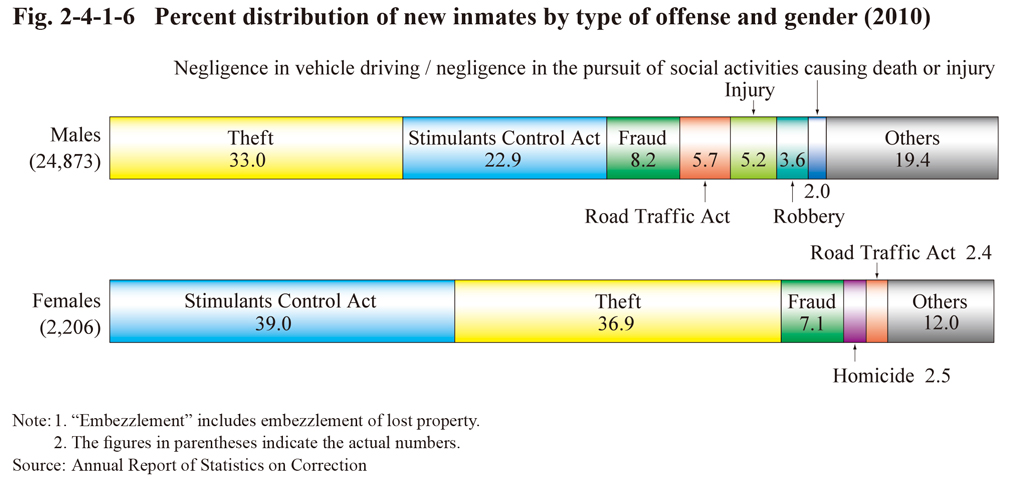 Fig. 2-4-1-6 Percent distribution of new inmates by type of offense and gender (2010)
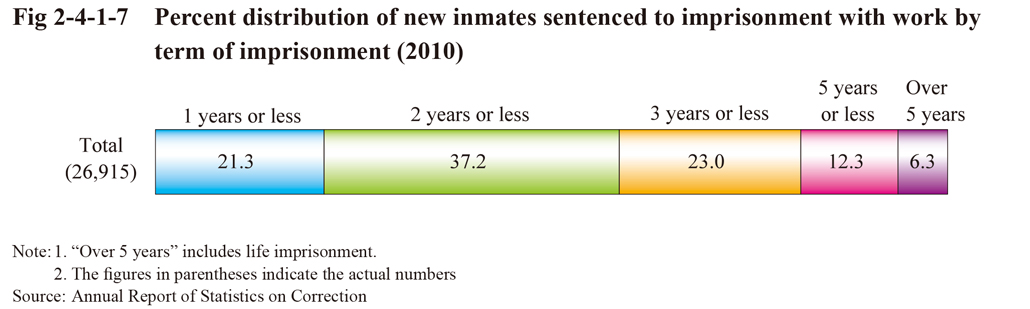
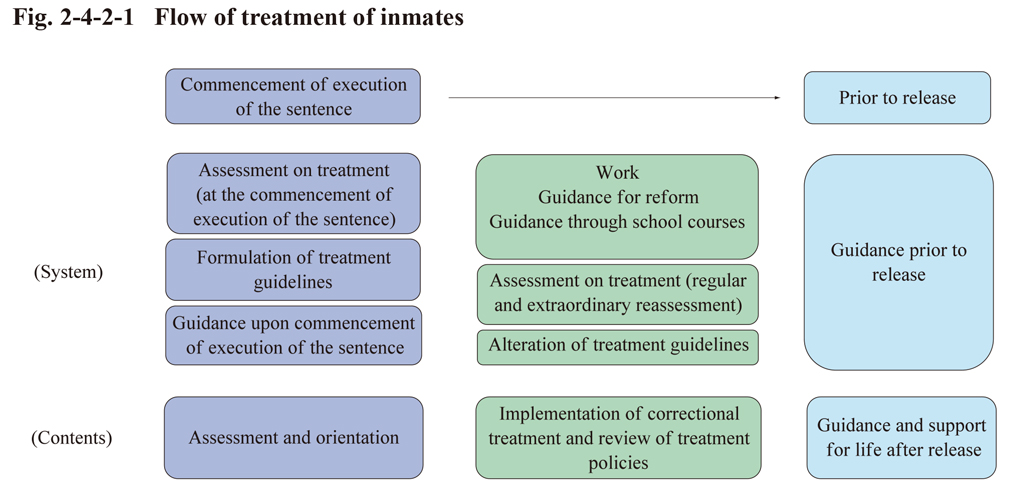 Fig. 2-4-2-1 Flow of treatment of inmates
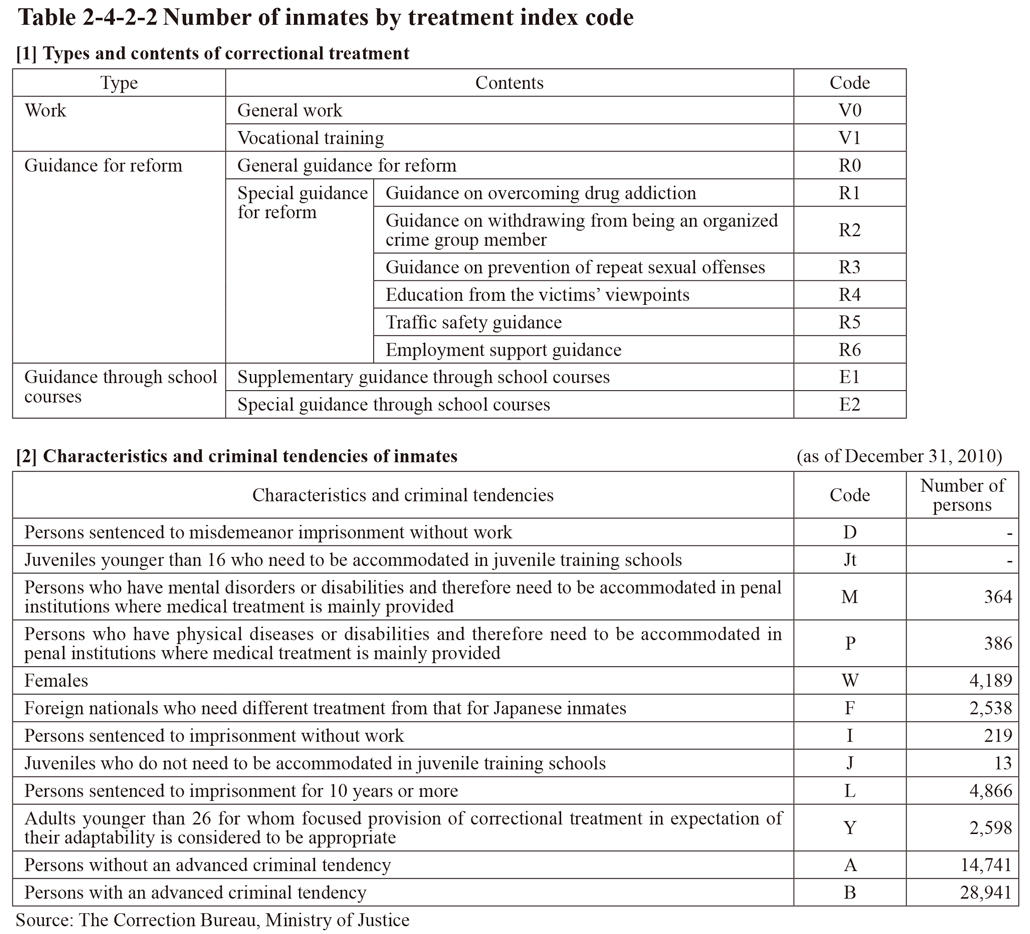 Table 2-4-2-2 Number of inmates by treatment index code
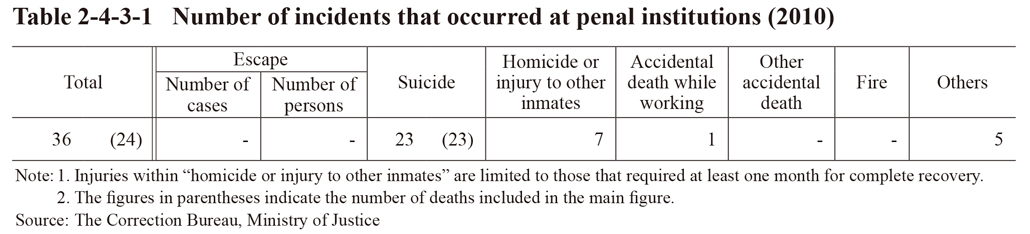 Table 2-4-3-1 Number of incidents that occurred at penal institutions (2010)
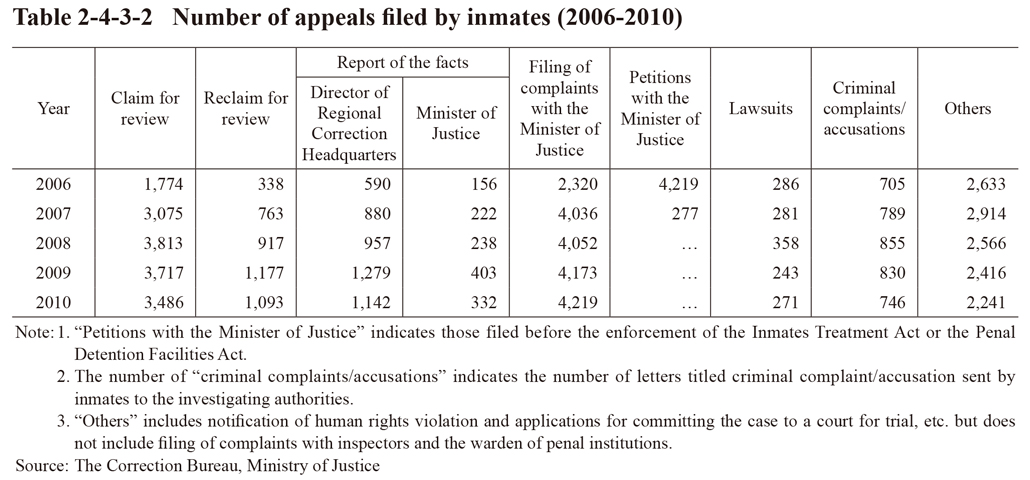 Table 2-4-3-2 Number of appeals filed by inmates (2006-2010)
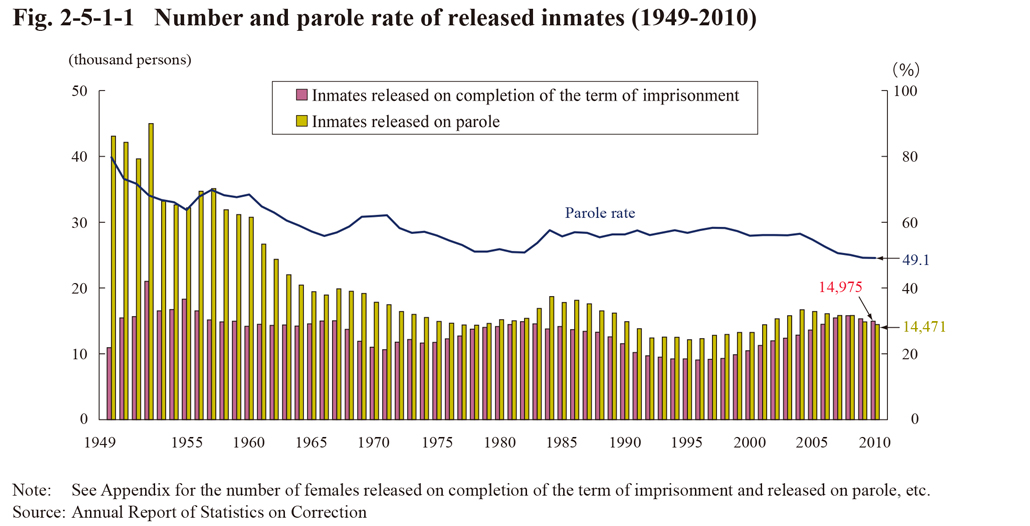 Fig. 2-5-1-1 Number and parole rate of released inmates (1949-2010)
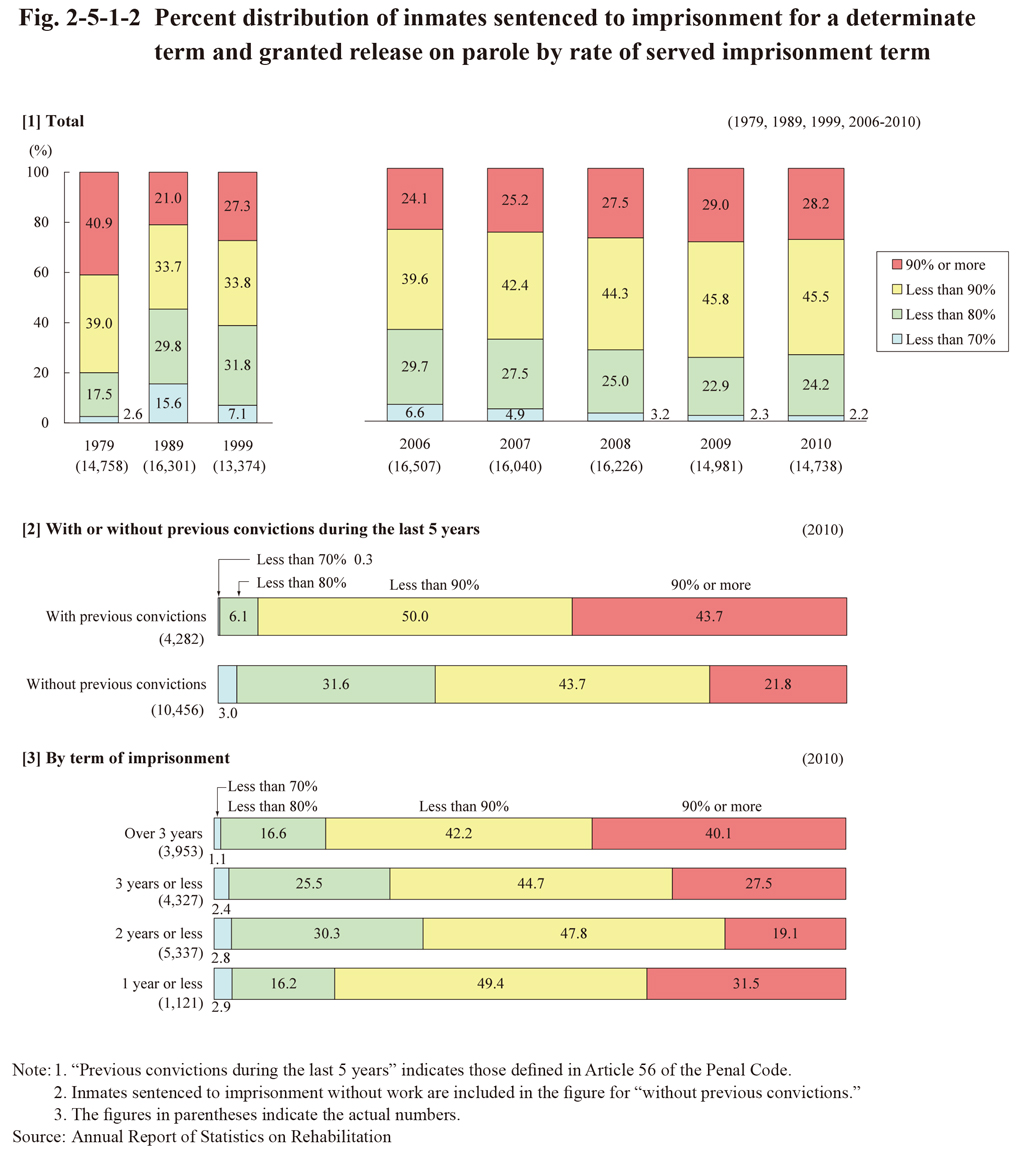
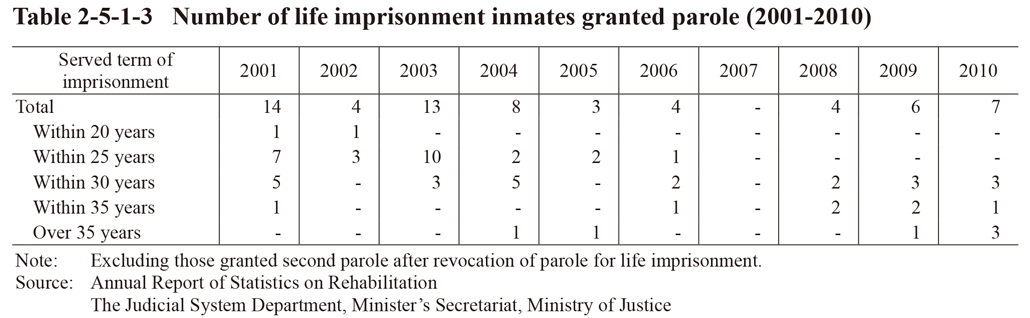 Table 2-5-1-3 Number of life imprisonment inmates granted parole (2001-2010)
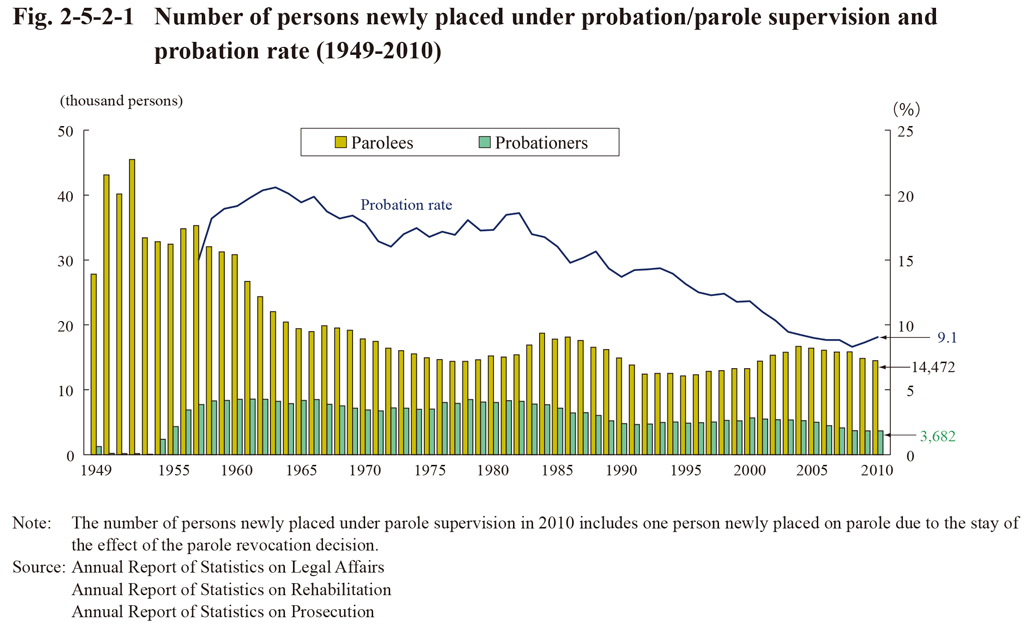
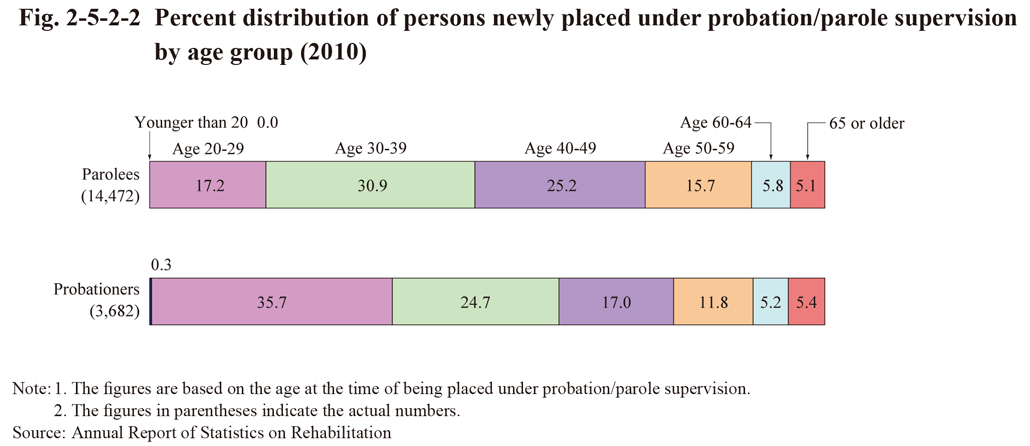
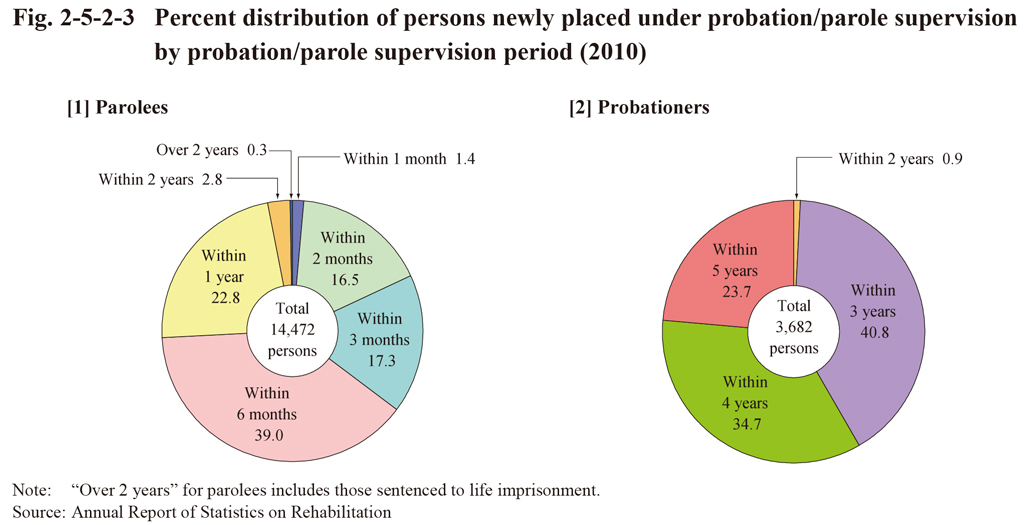
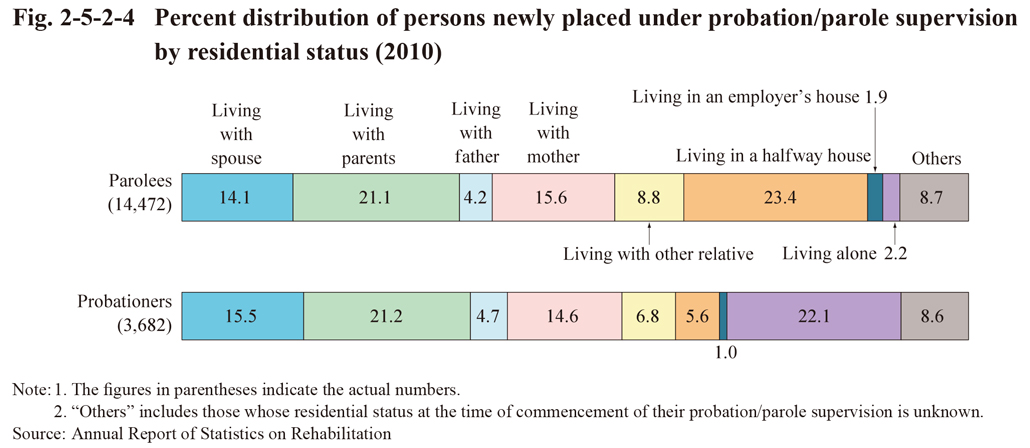
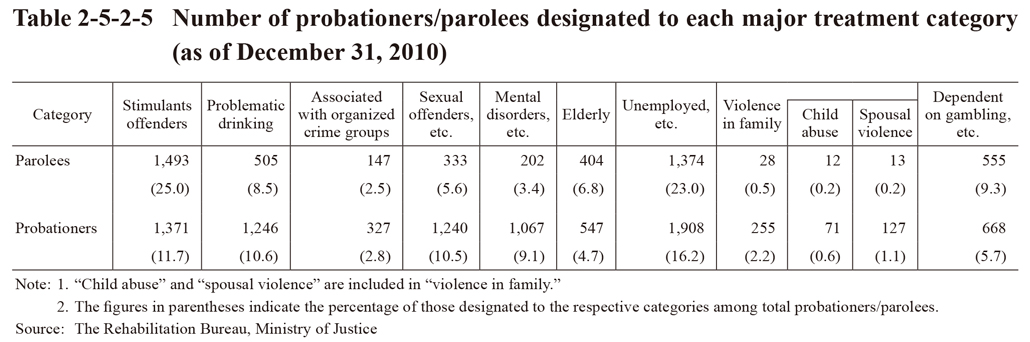
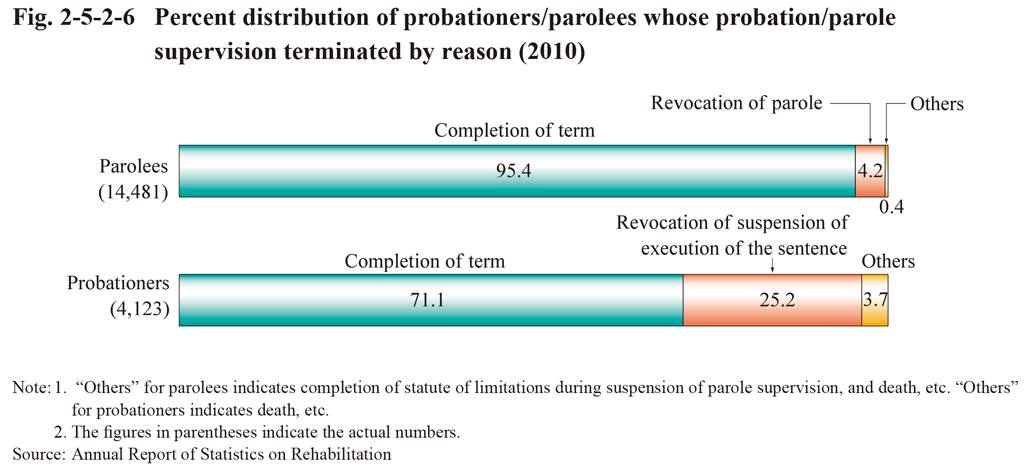
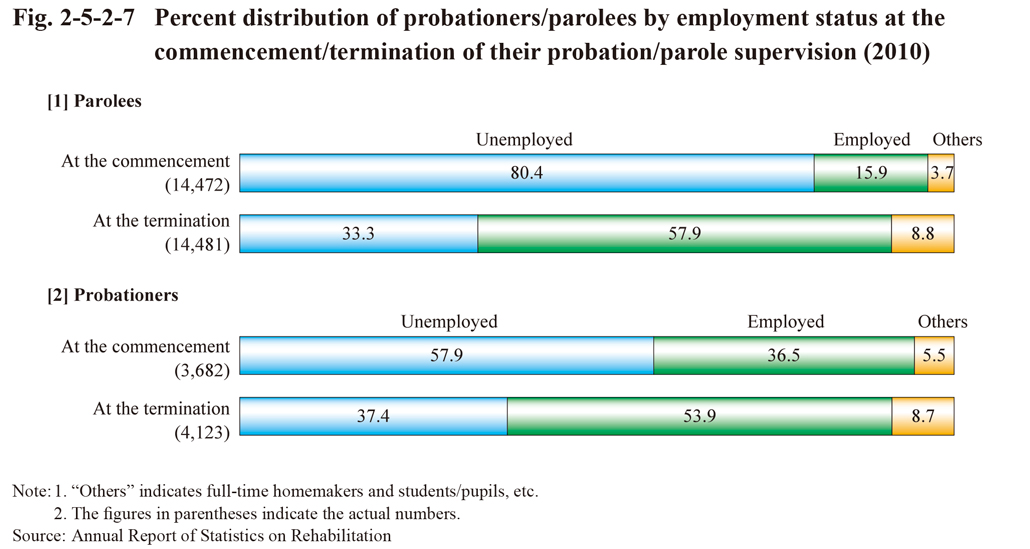
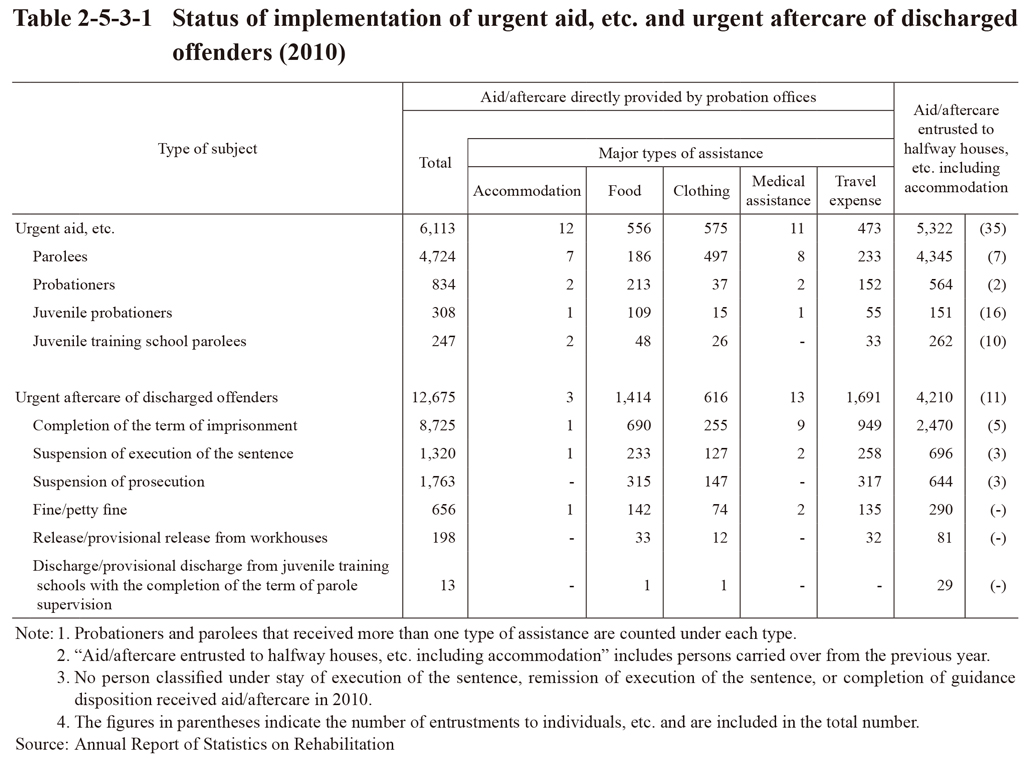
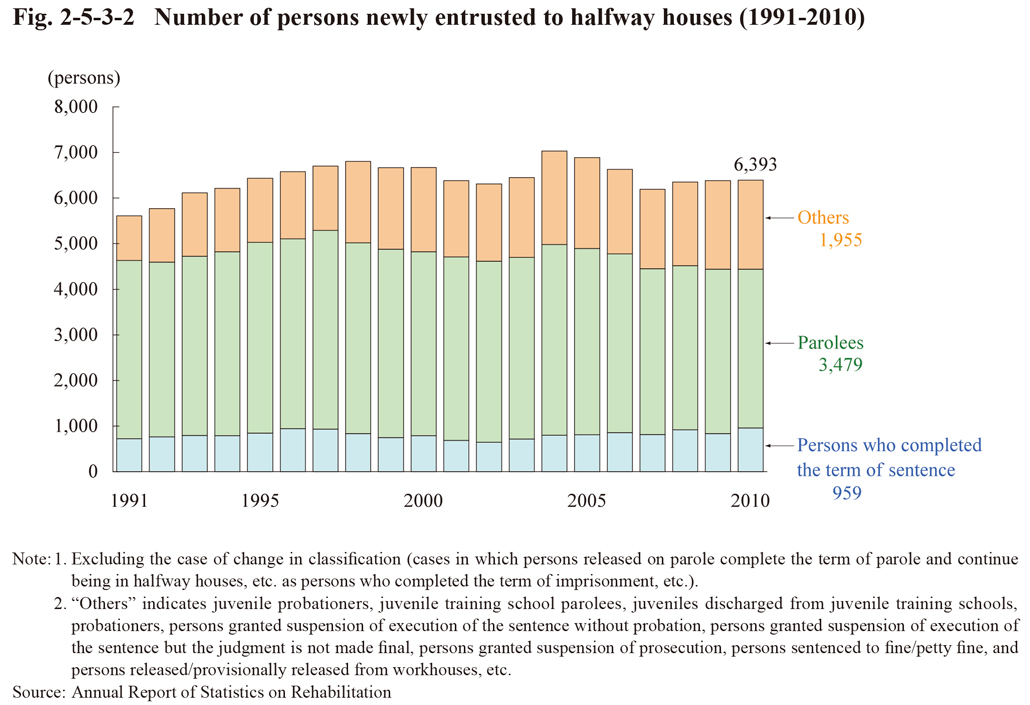 Fig. 2-5-3-2 Number of persons newly entrusted to halfway houses (1991-2010)
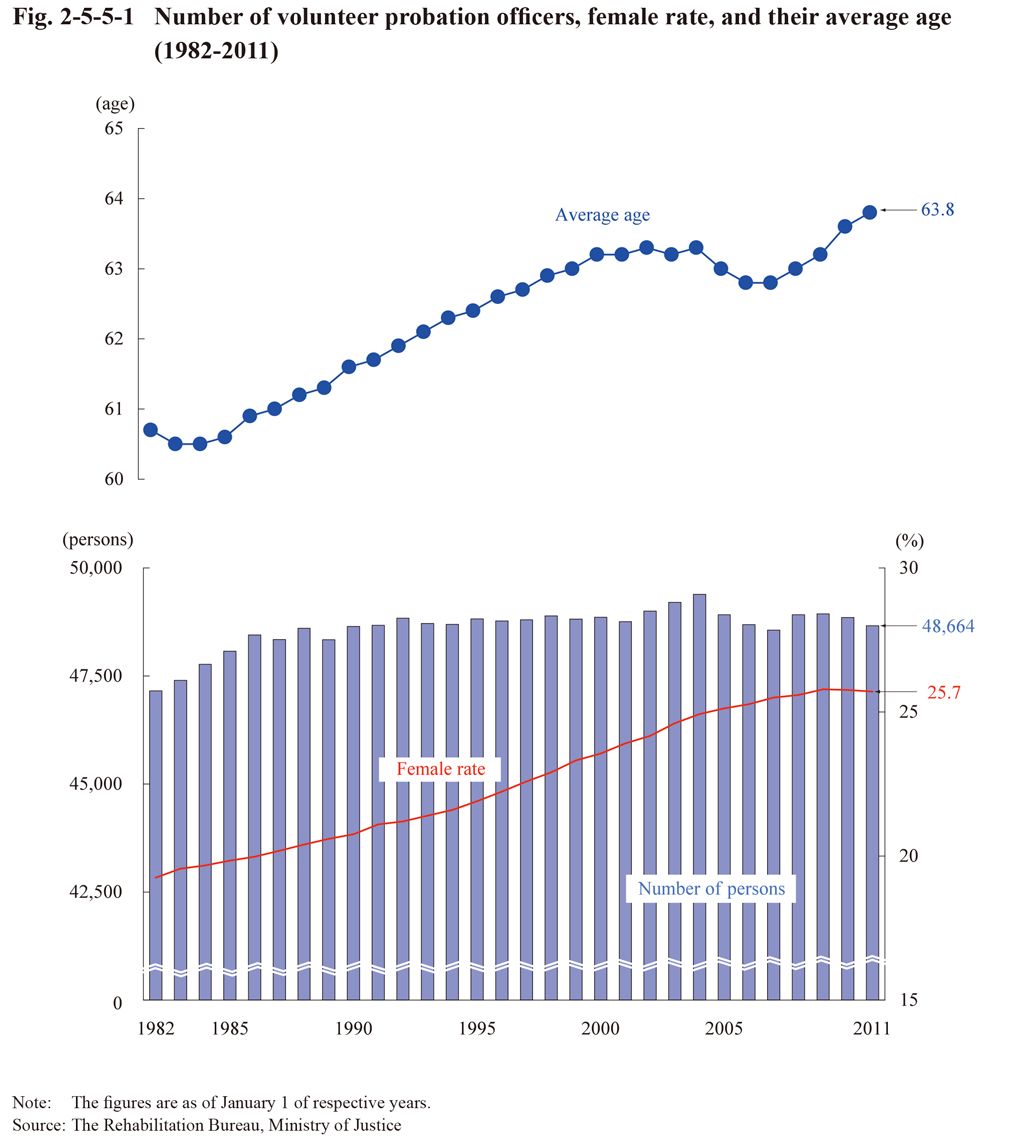 Fig. 2-5-5-1 Number of volunteer probation officers, female rate, and their average age (1982-2011)
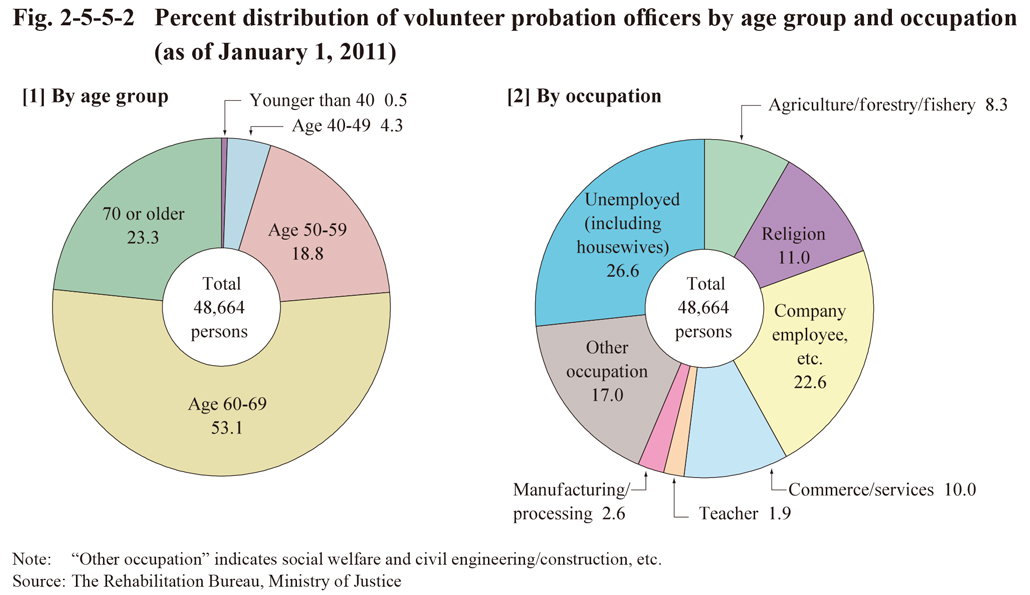
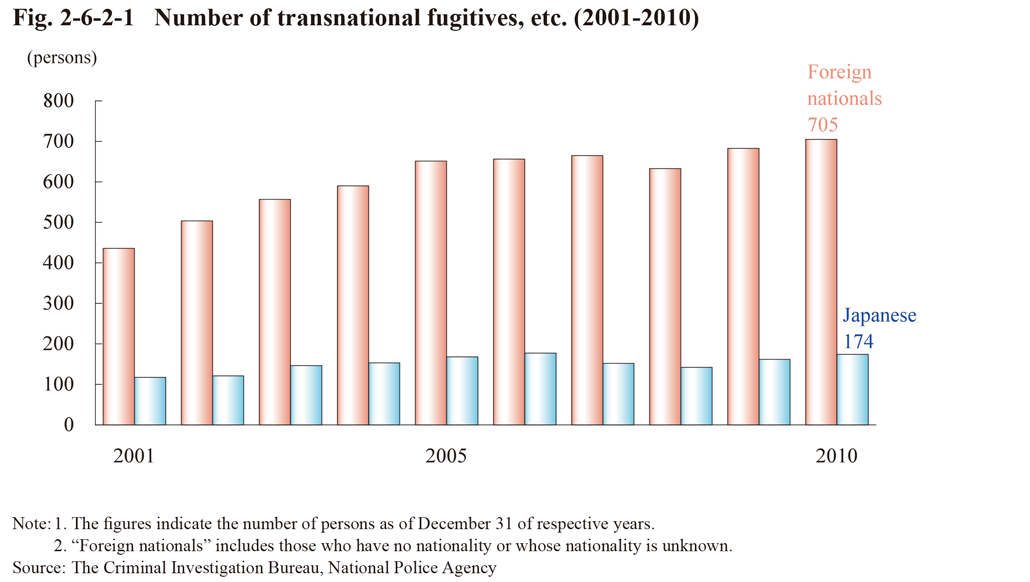 Fig. 2-6-2-1 Number of transnational fugitives, etc. (2001-2010)
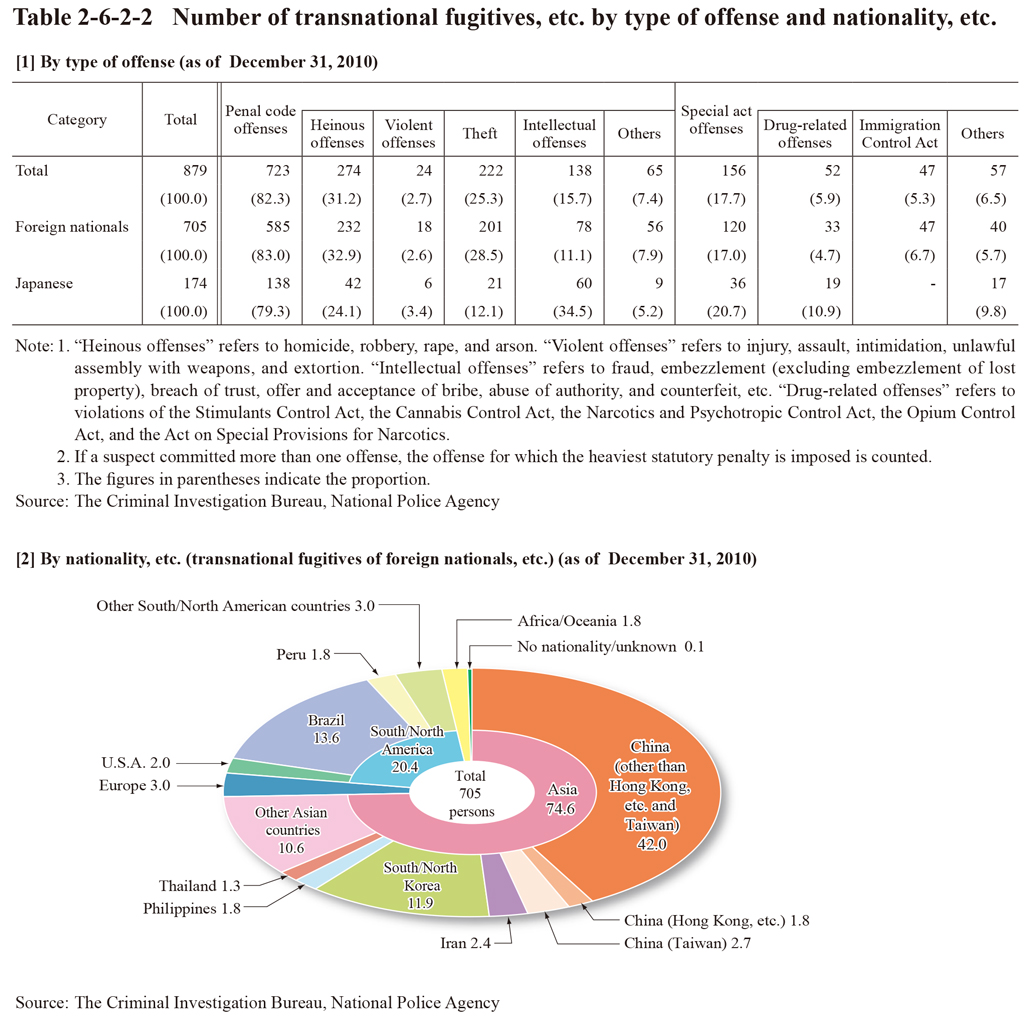 Table 2-6-2-2 Number of transnational fugitives, etc. by type of offense and nationality, etc.
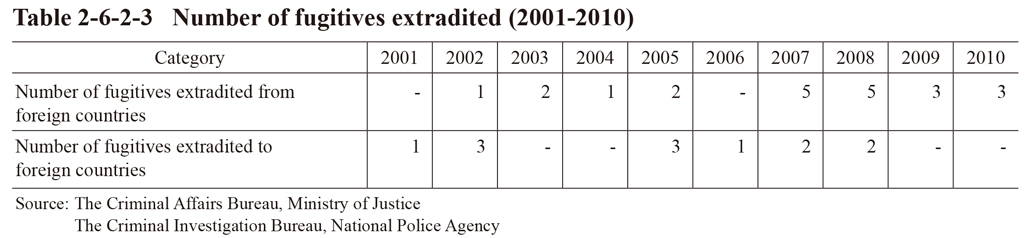 Table 2-6-2-3 Number of fugitives extradited (2001-2010)
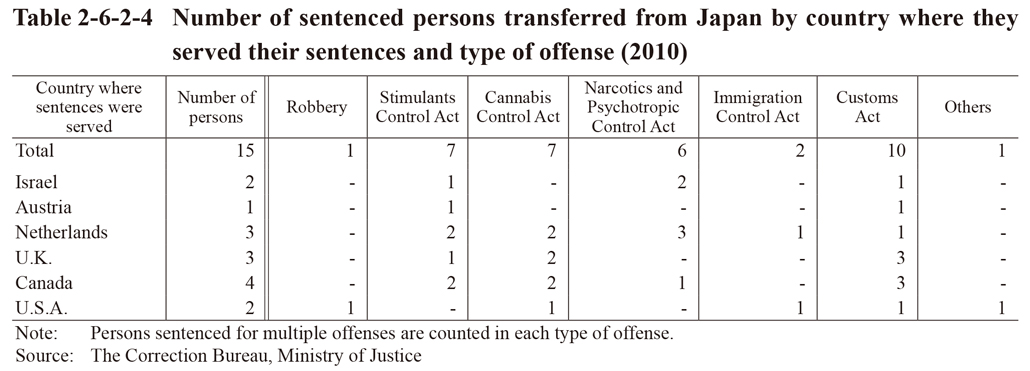
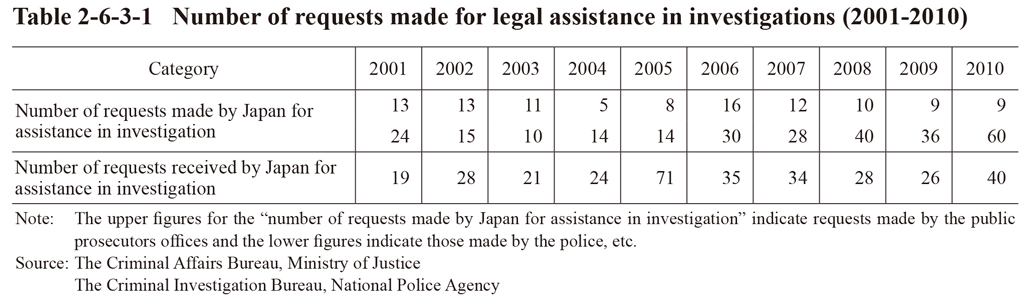 Table 2-6-3-1 Number of requests made for legal assistance in investigations (2001-2010)
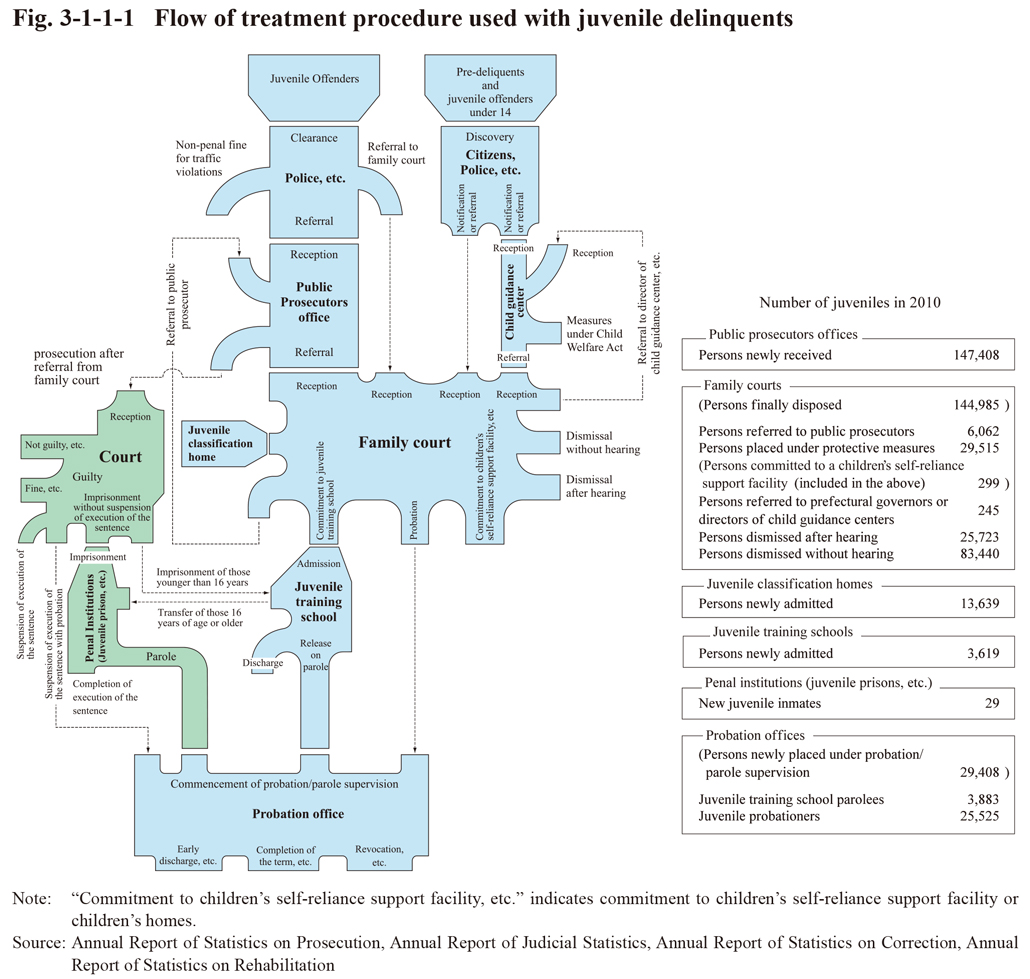 Fig. 3-1-1-1 Flow of treatment procedure used with juvenile delinquents
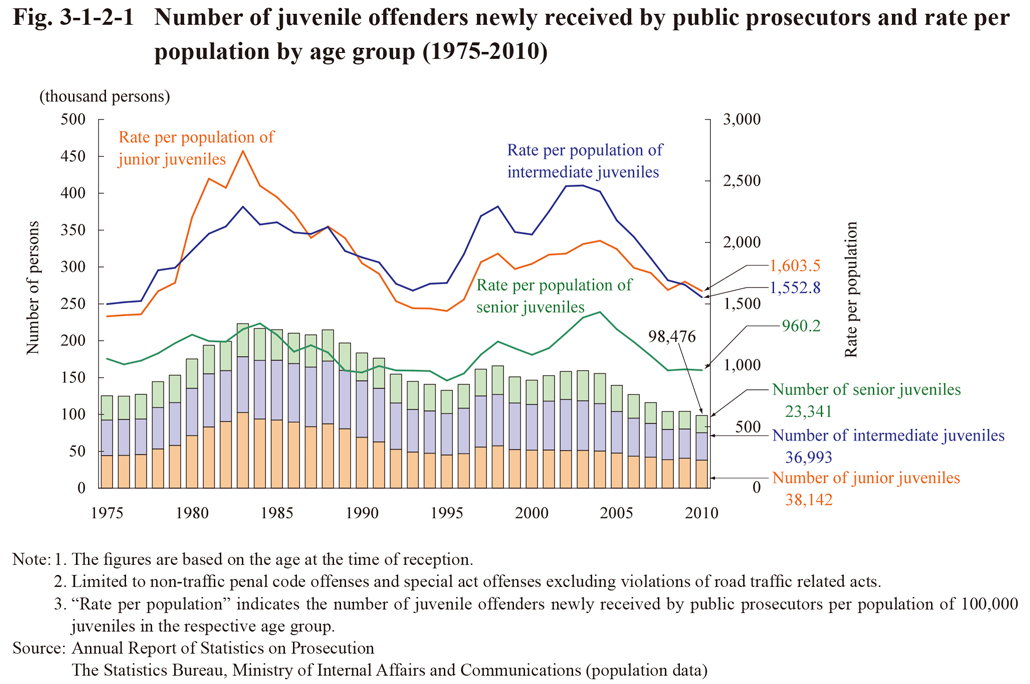
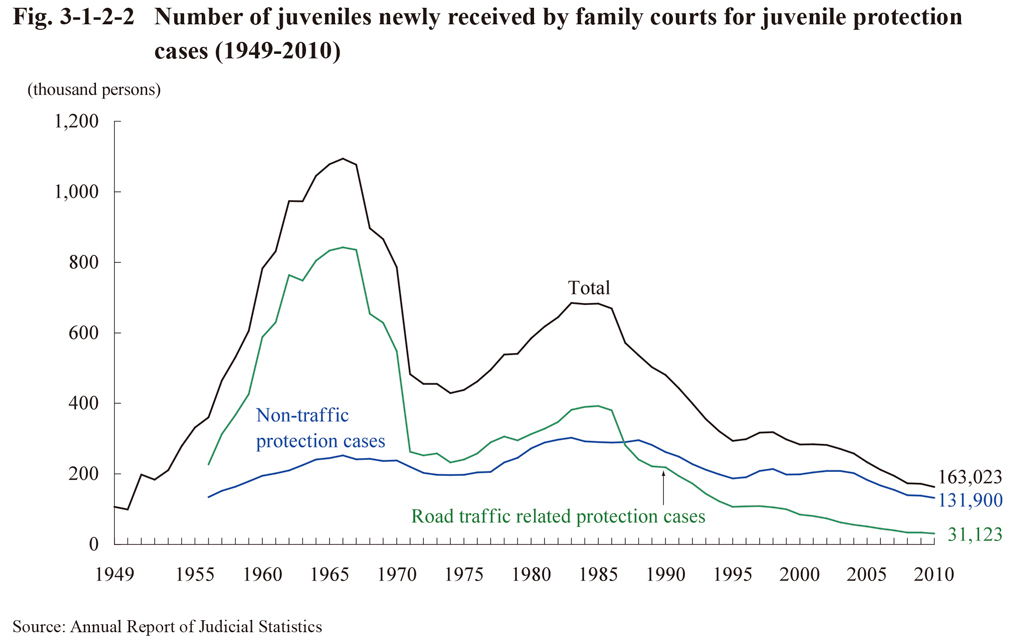
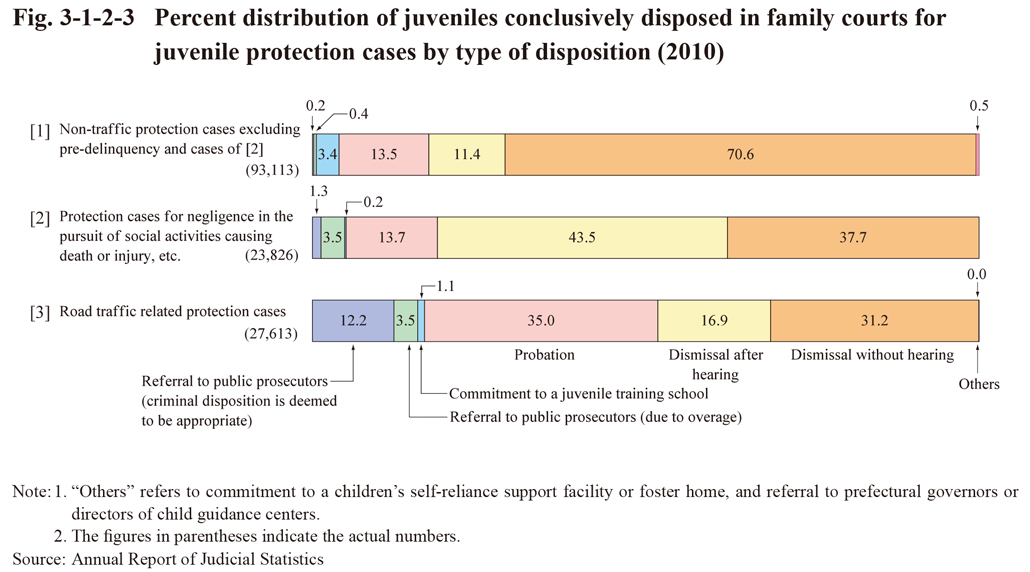
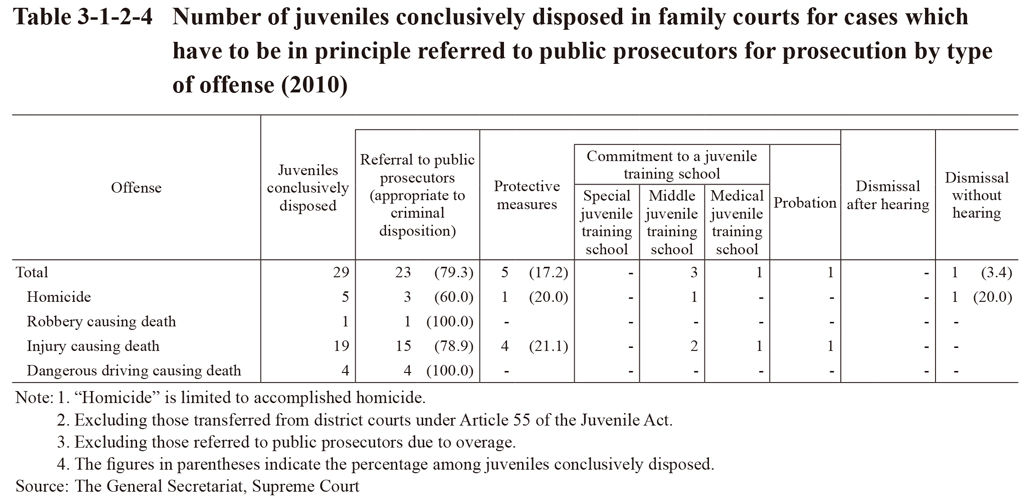
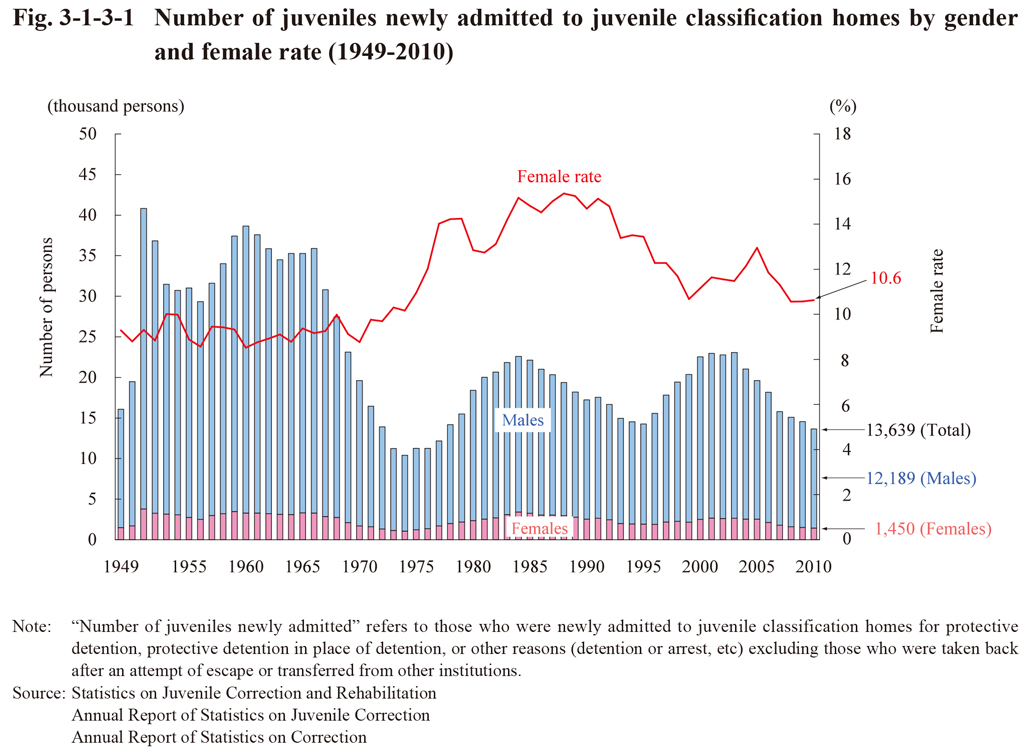
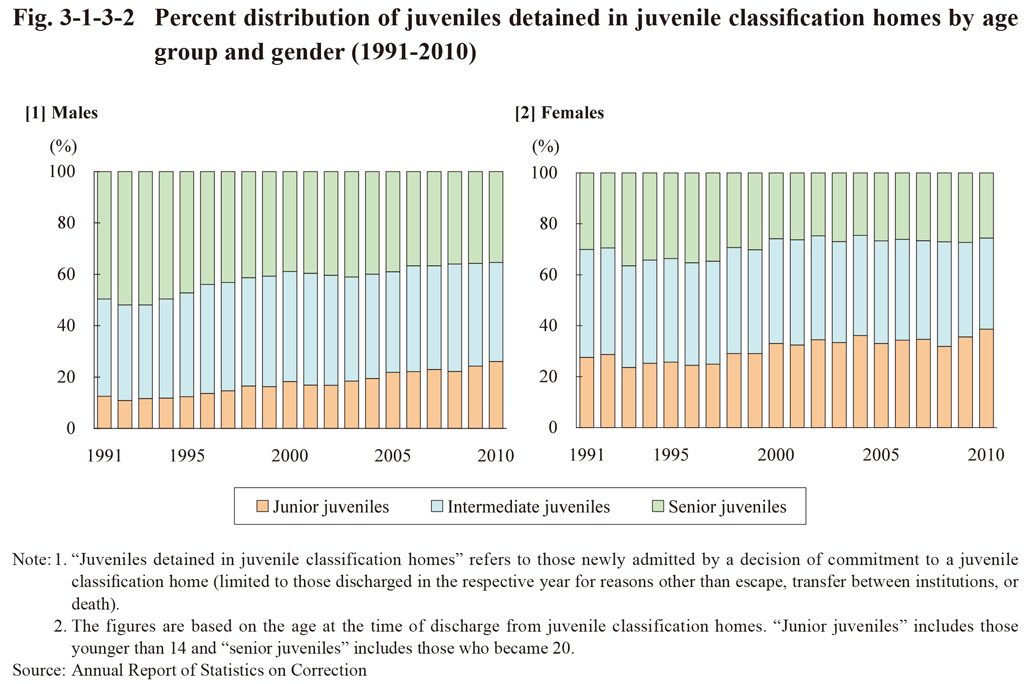
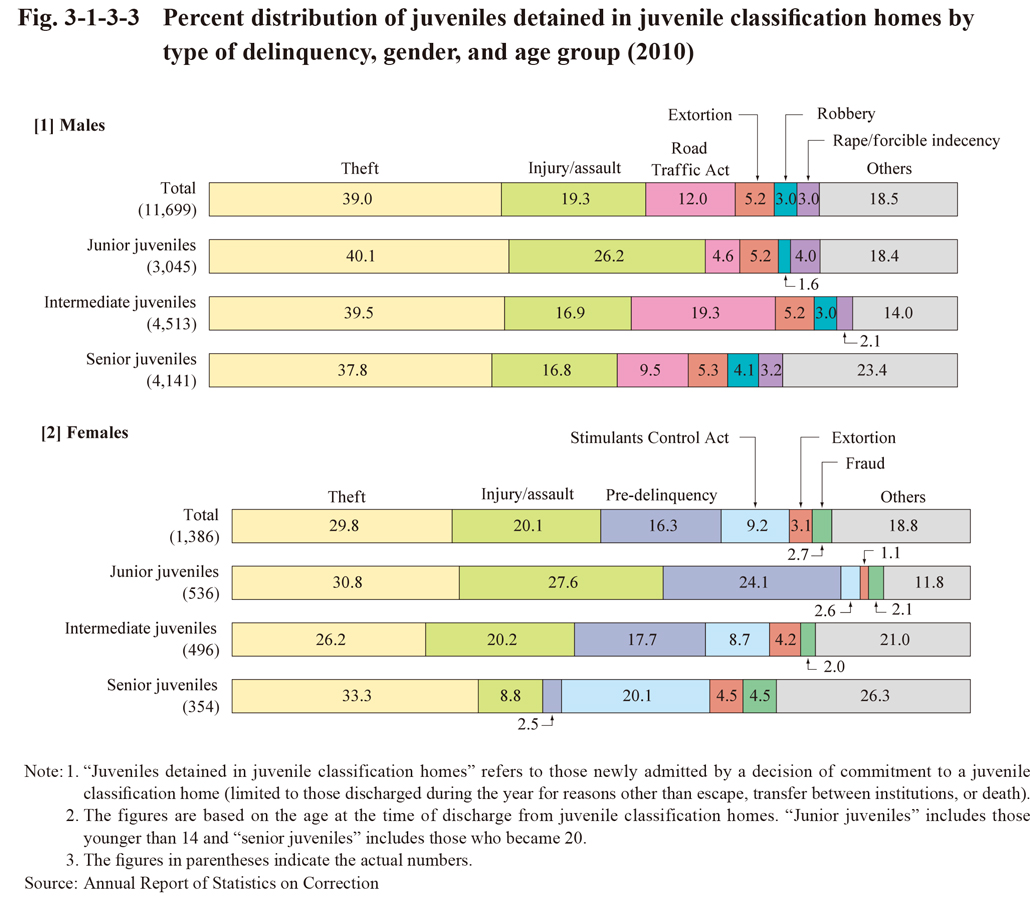
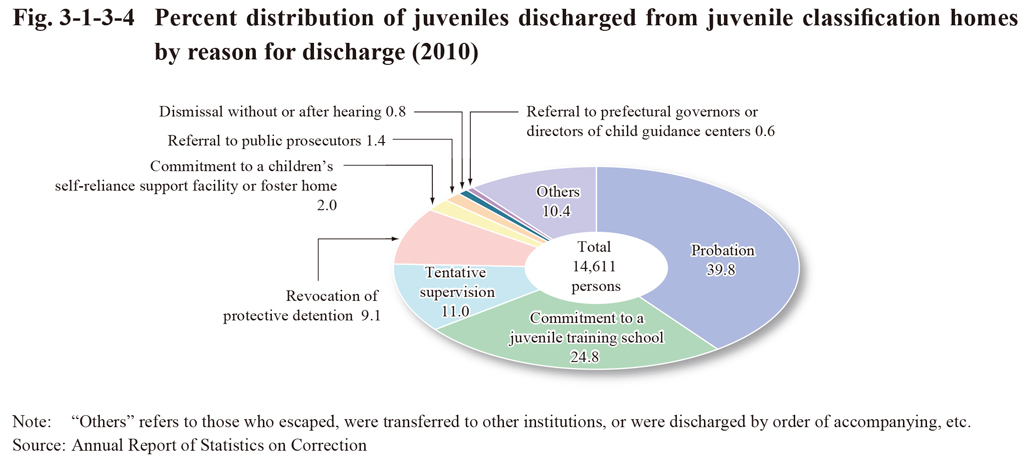
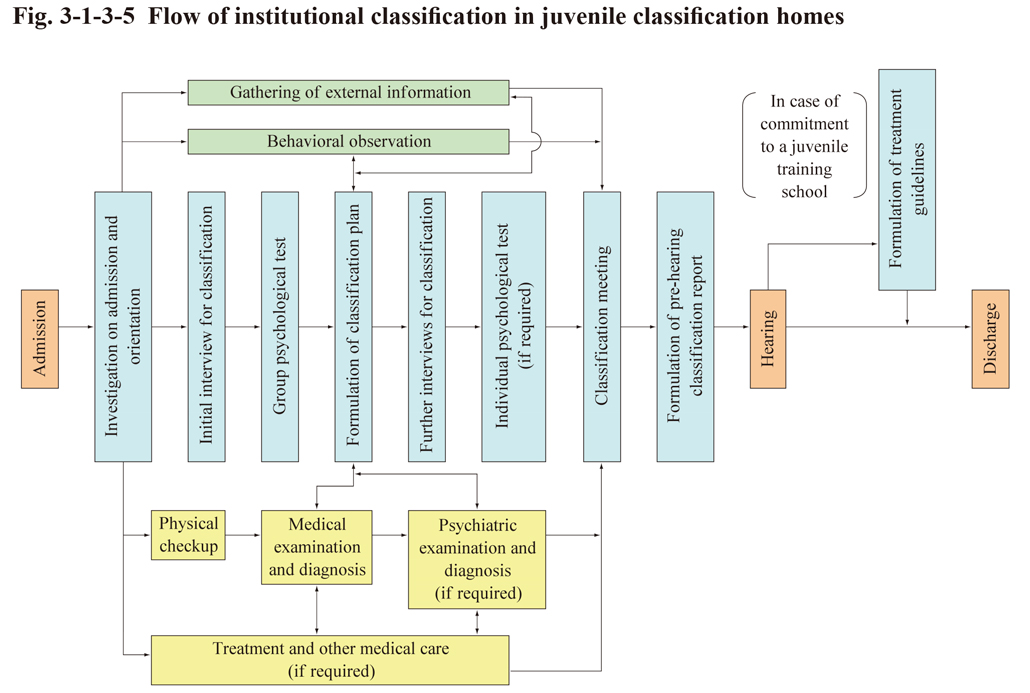 Fig. 3-1-3-5 Flow of institutional classification in juvenile classification homes
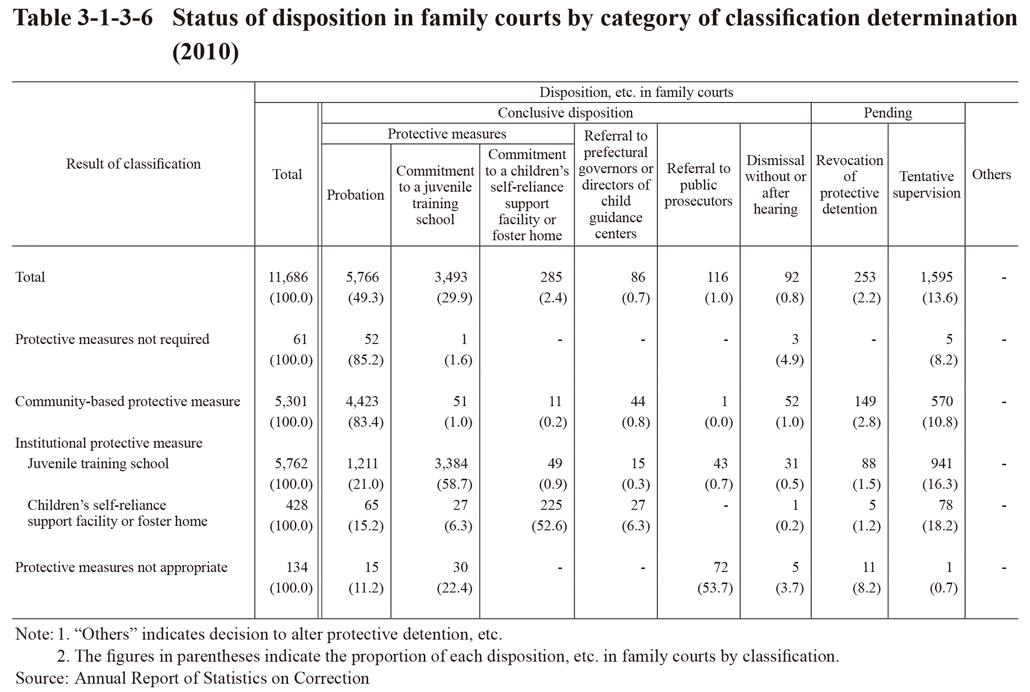
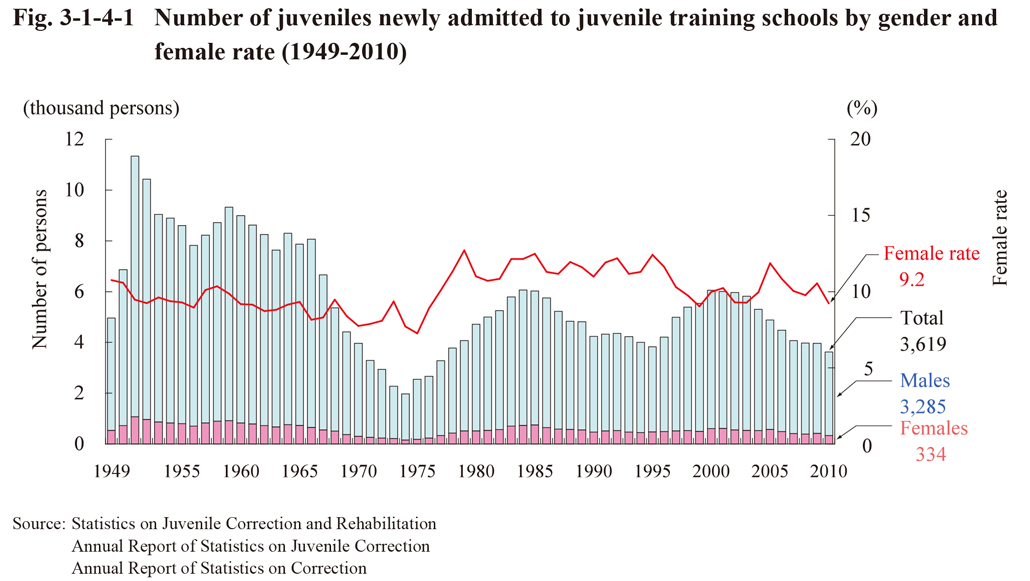
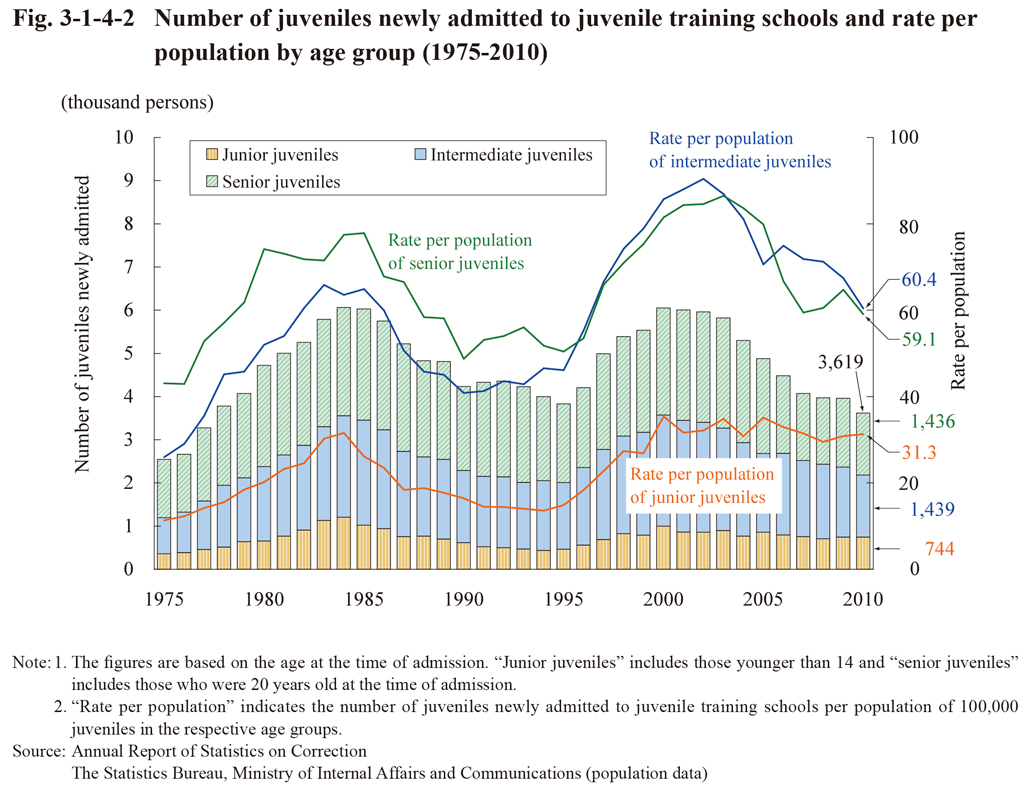
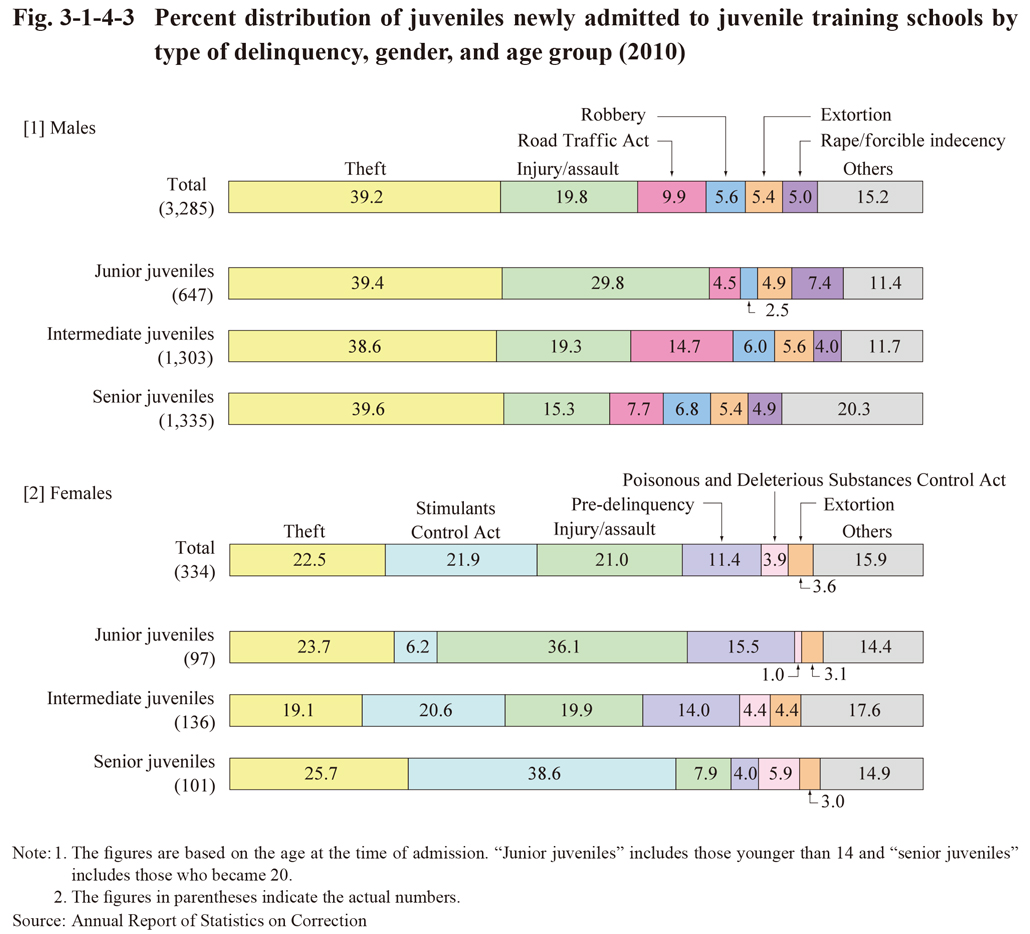
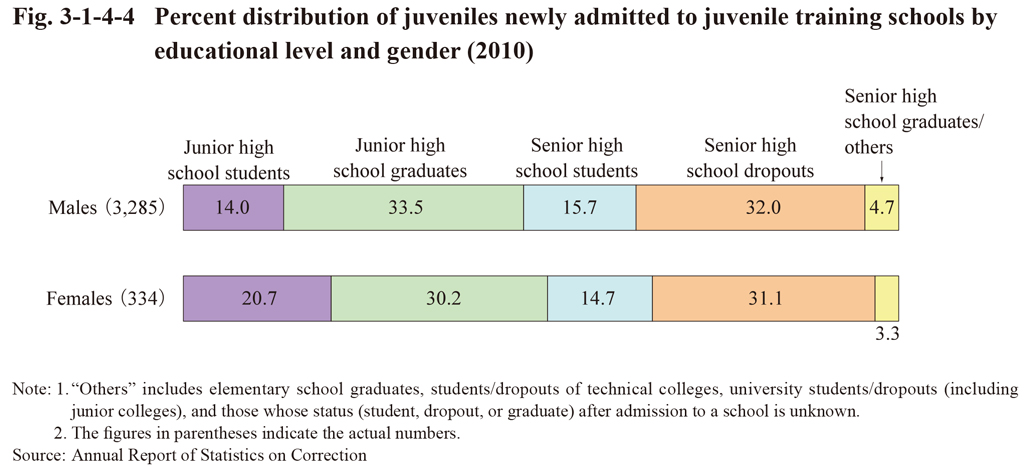
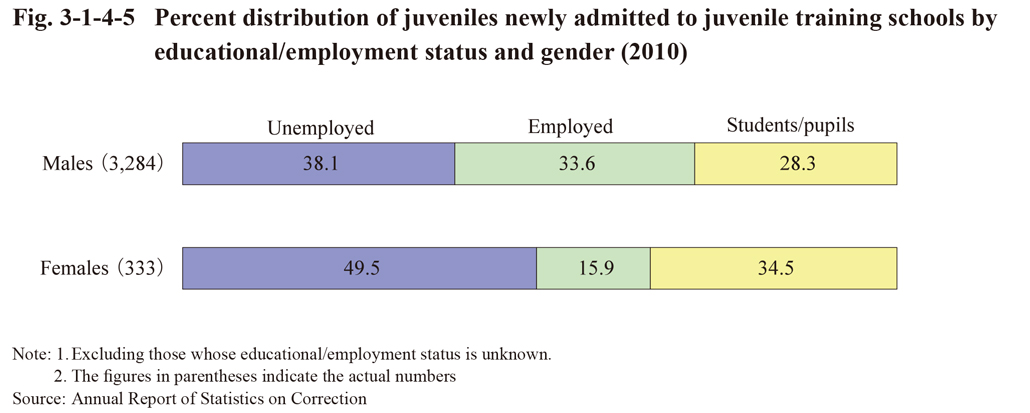
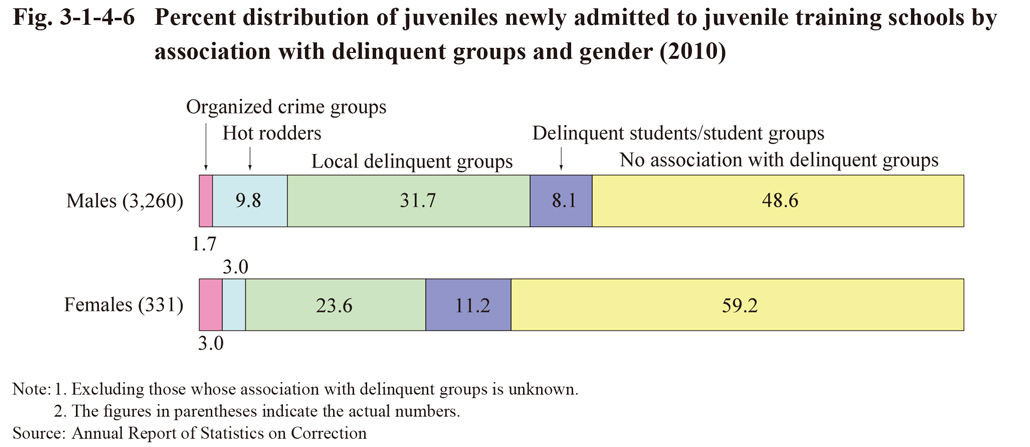
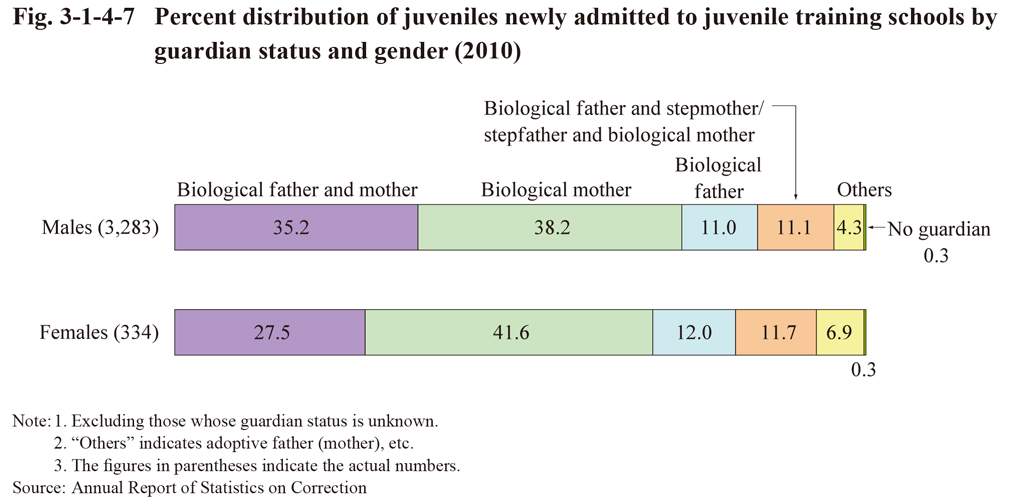
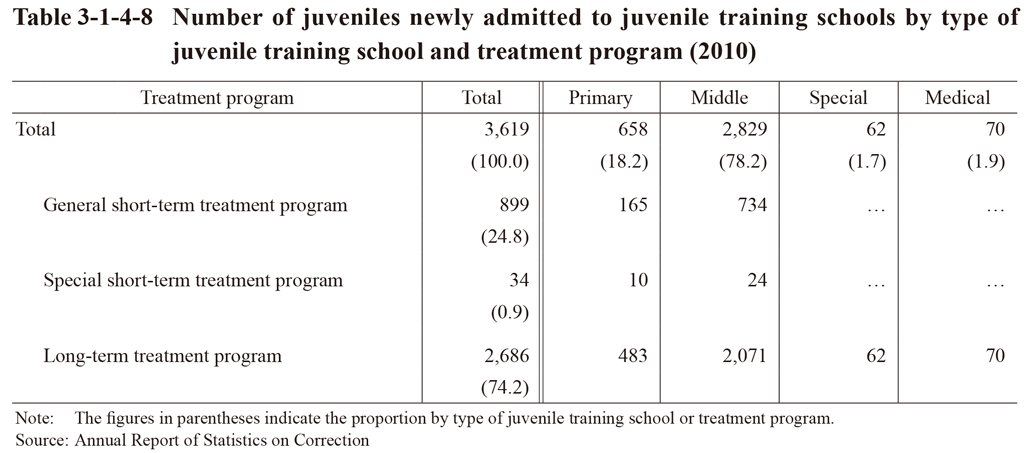
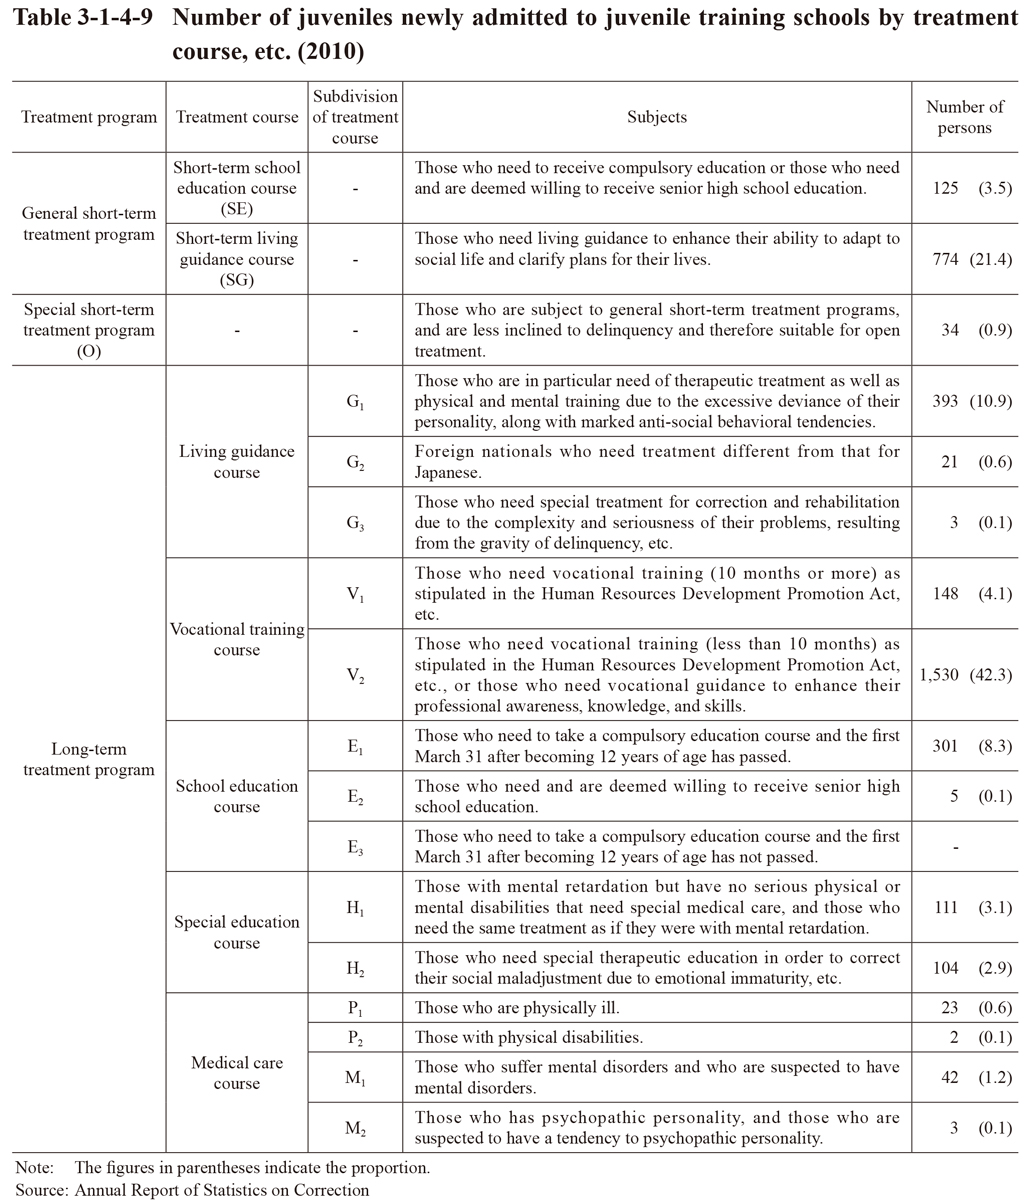
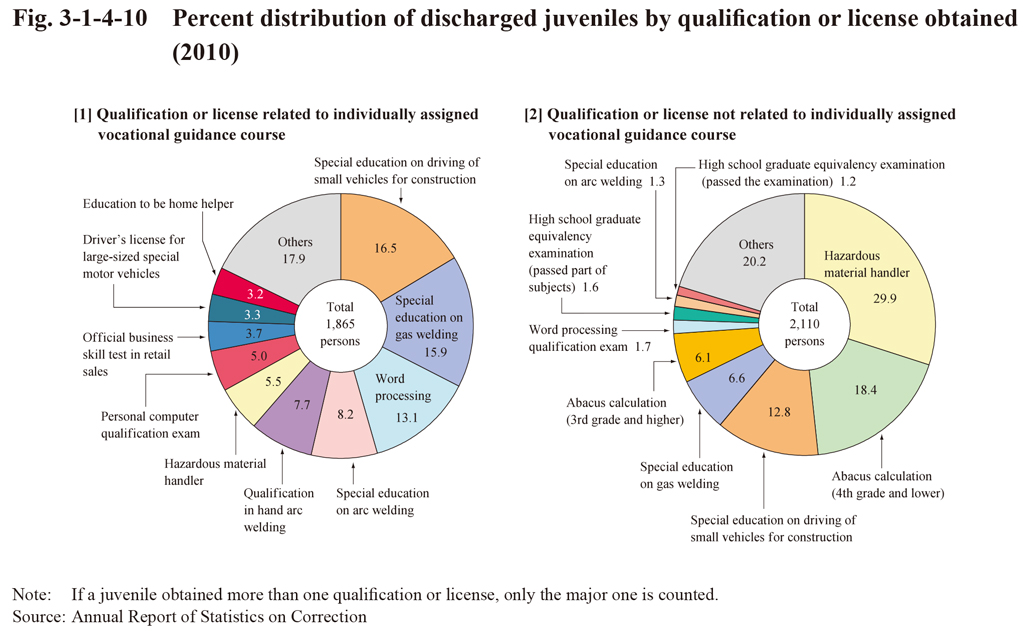
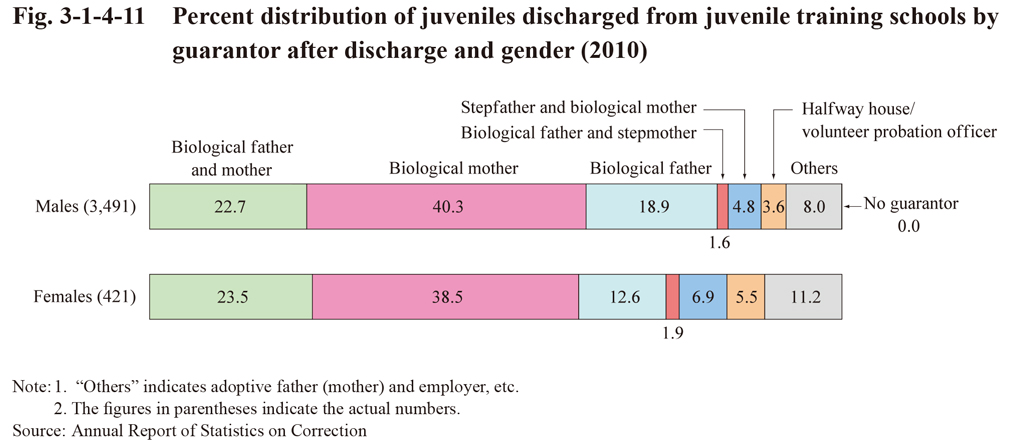
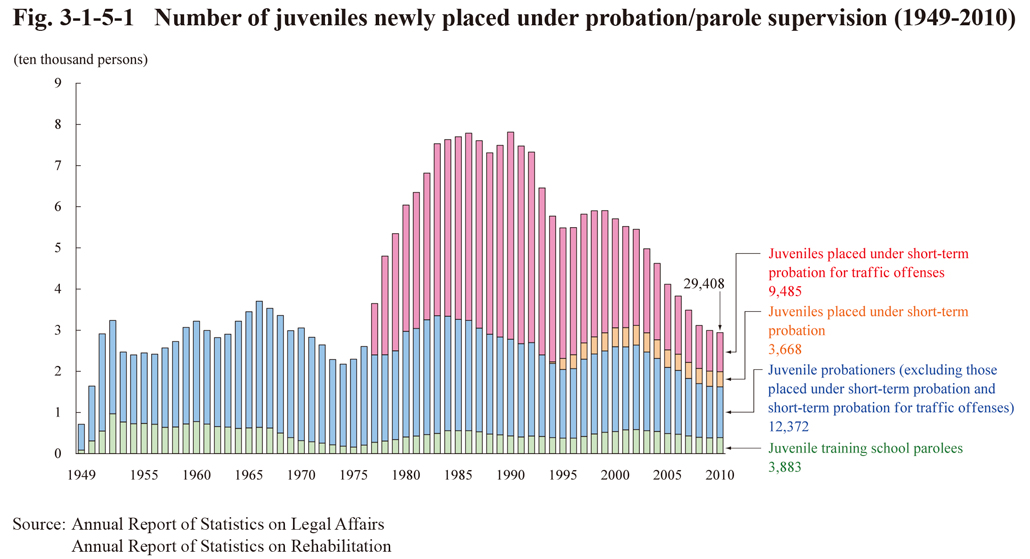 Fig. 3-1-5-1 Number of juveniles newly placed under probation/parole supervision (1949-2010)
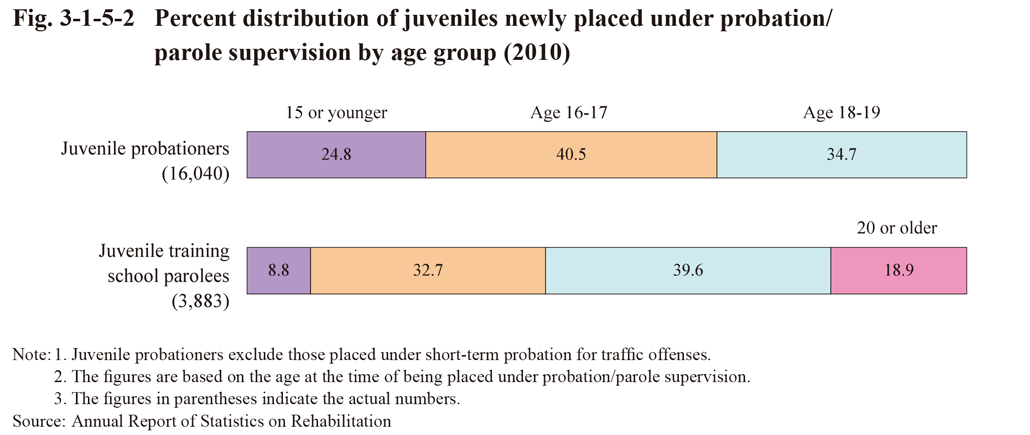
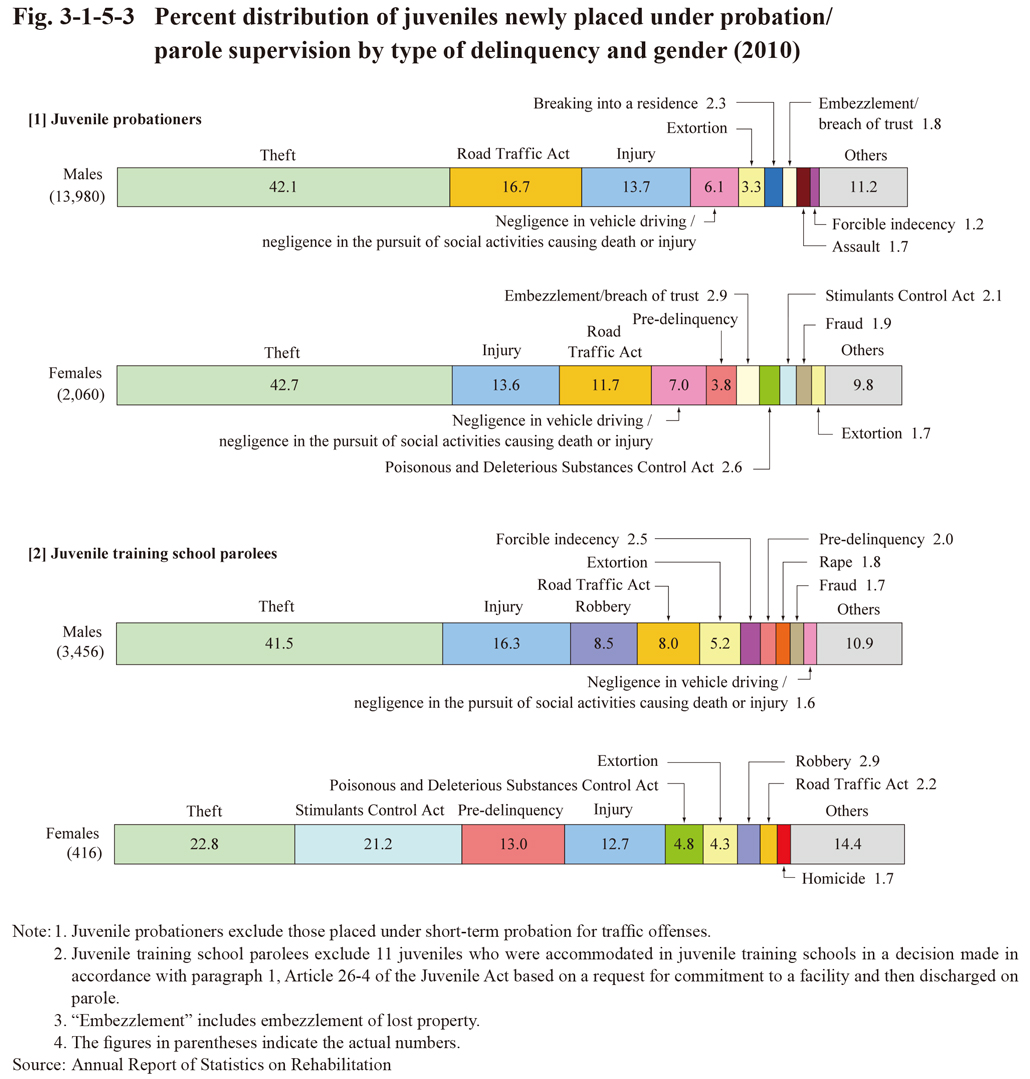
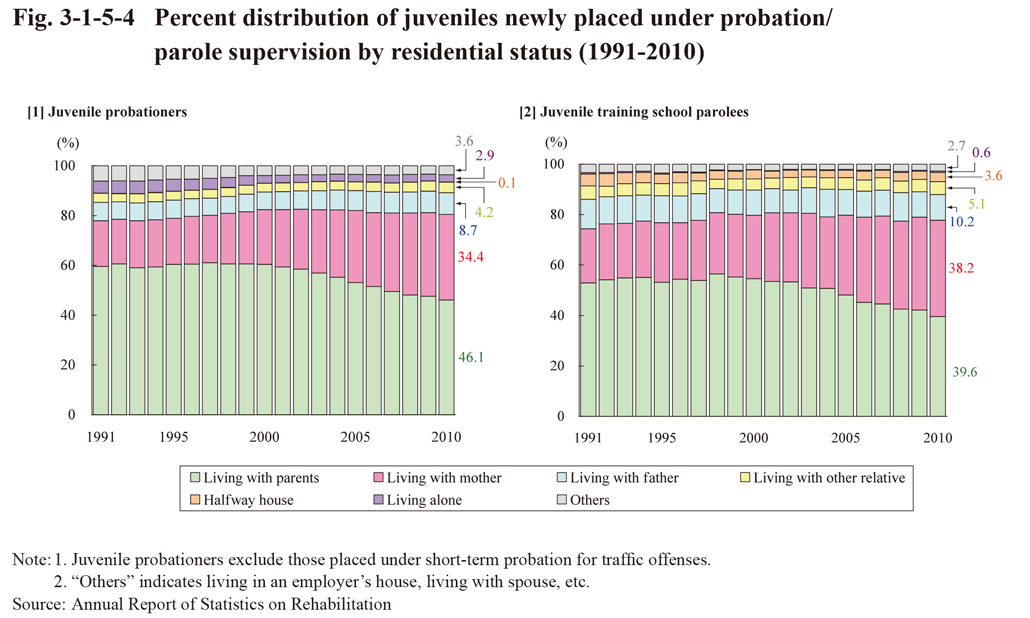
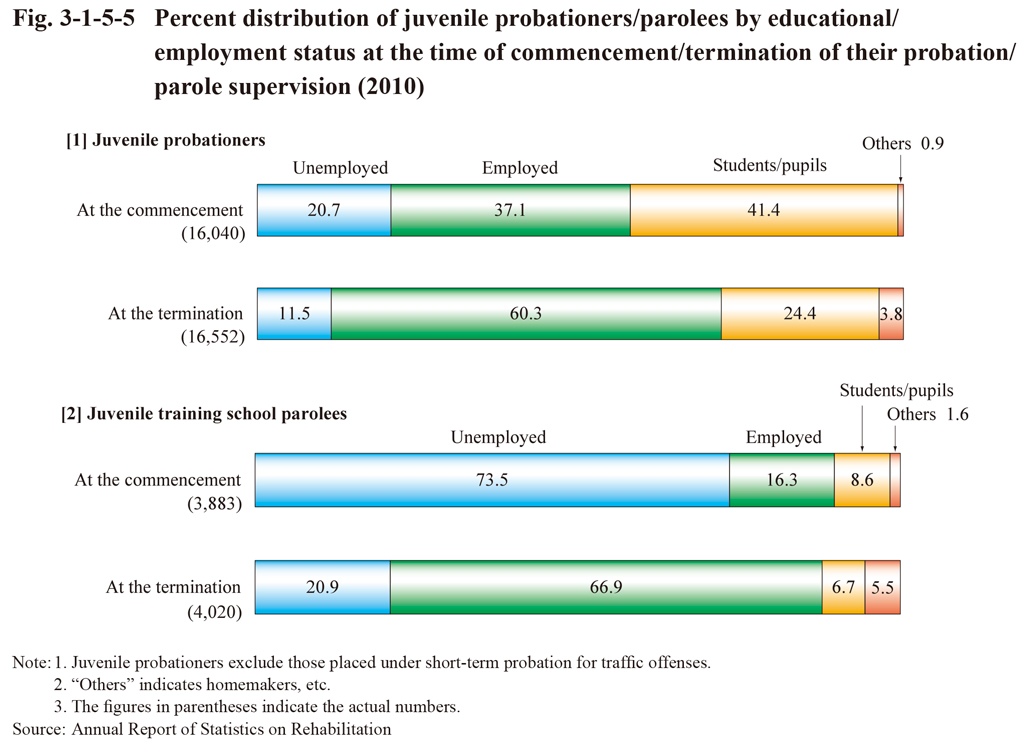
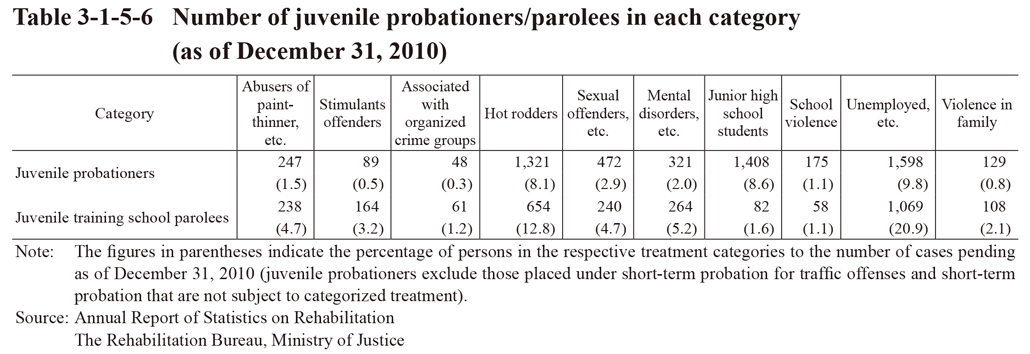 Table 3-1-5-6 Number of juvenile probationers/parolees in each category (as of December 31, 2010)
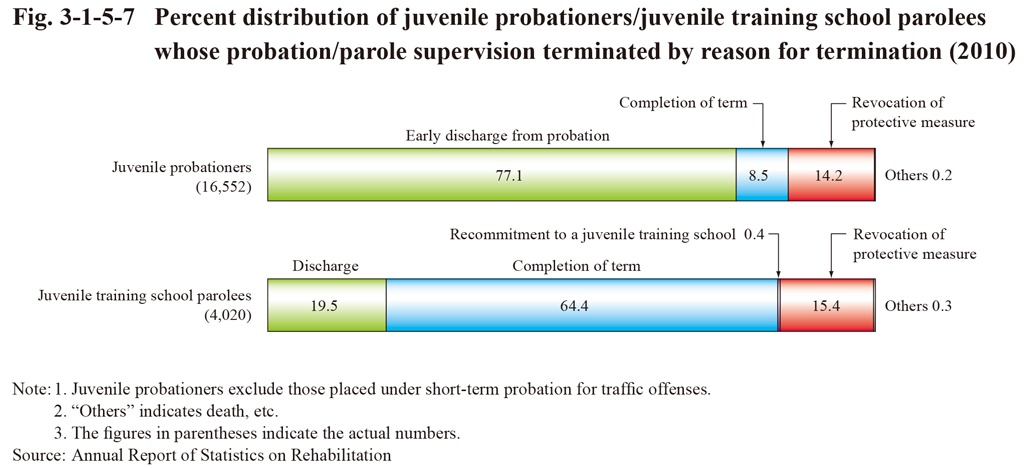
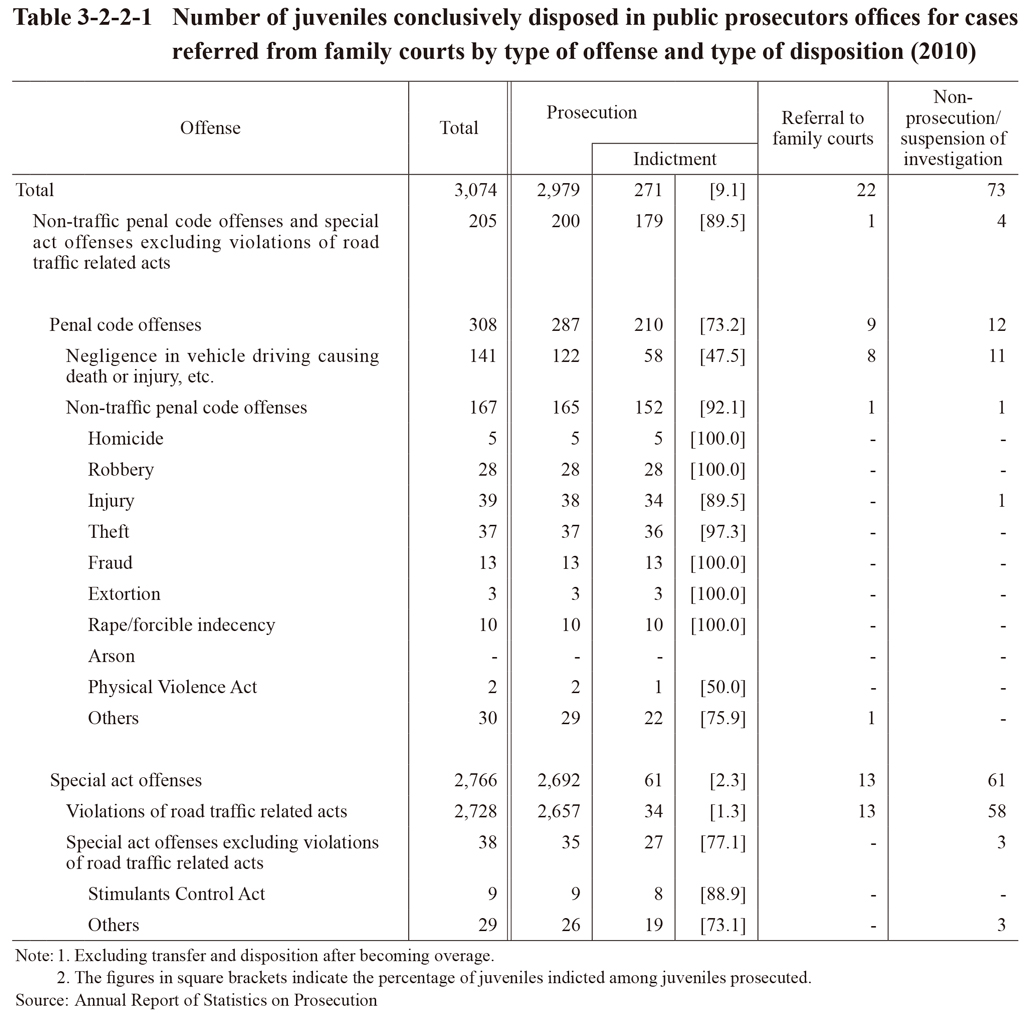
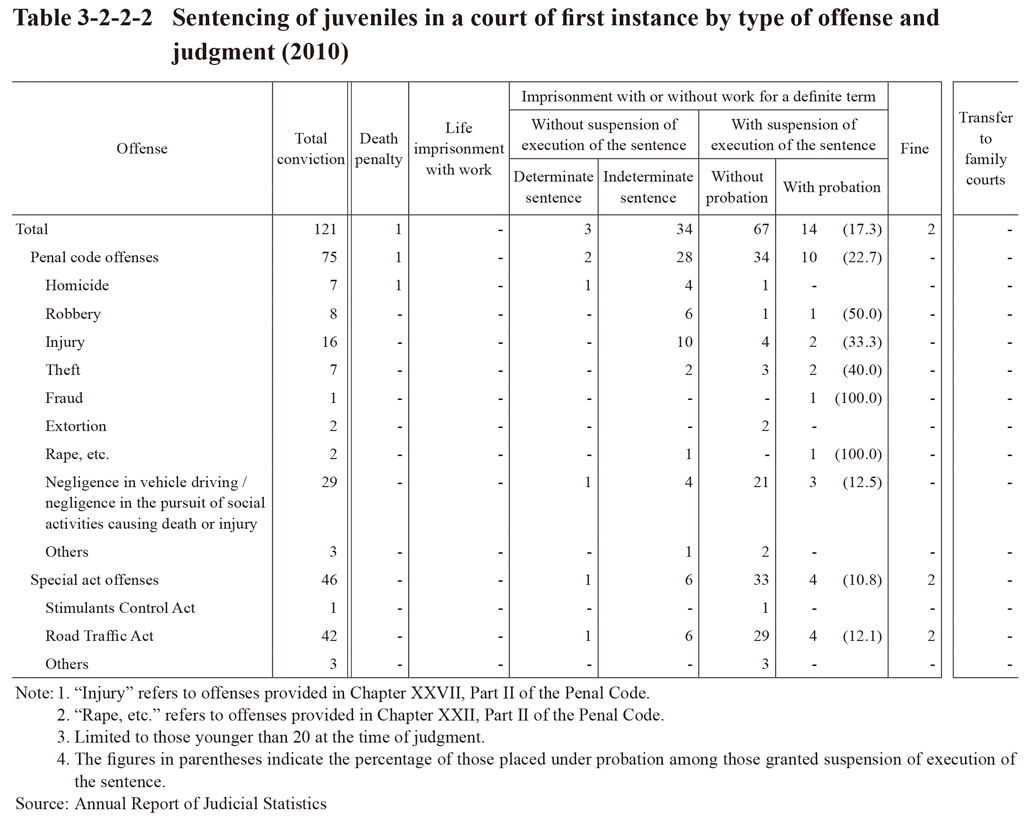
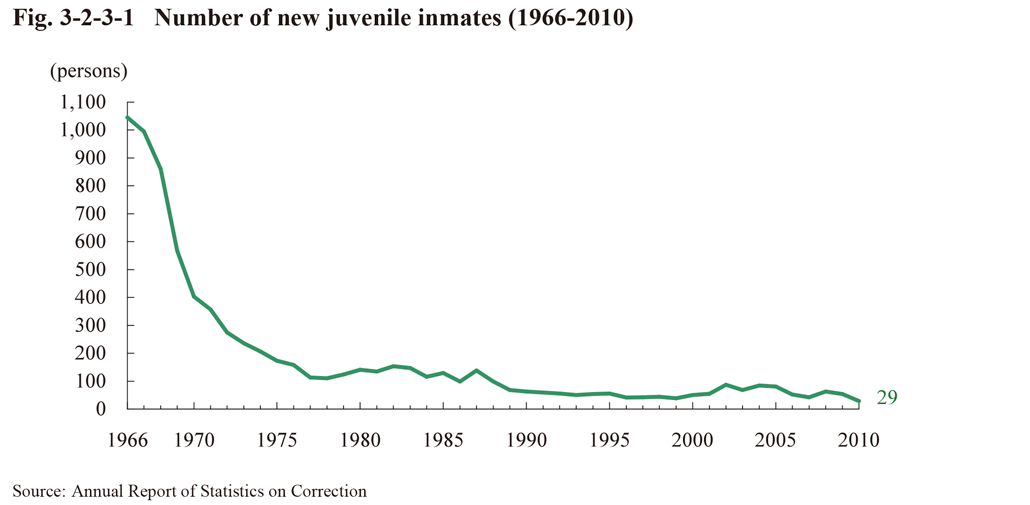 Fig. 3-2-3-1 Number of new juvenile inmates (1966-2010)
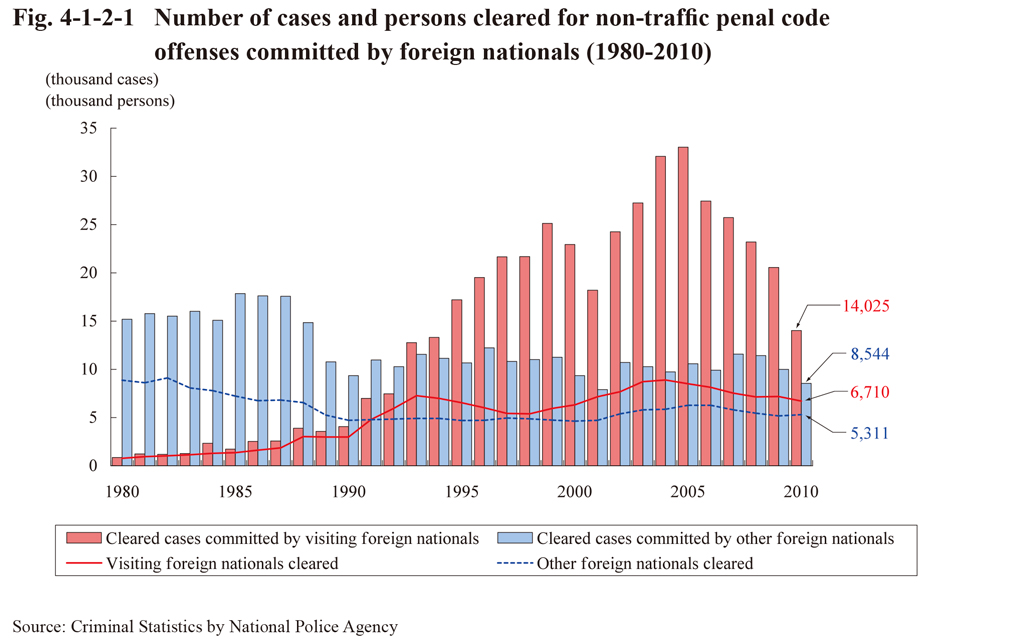
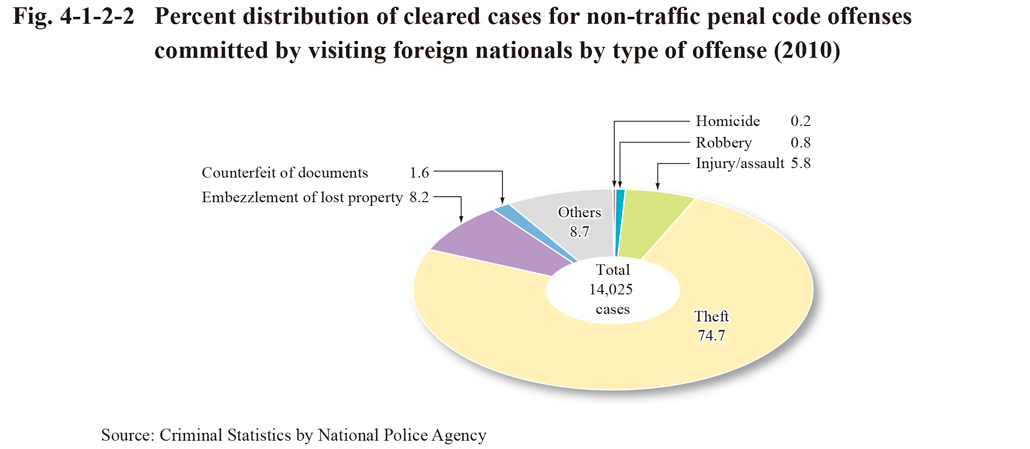
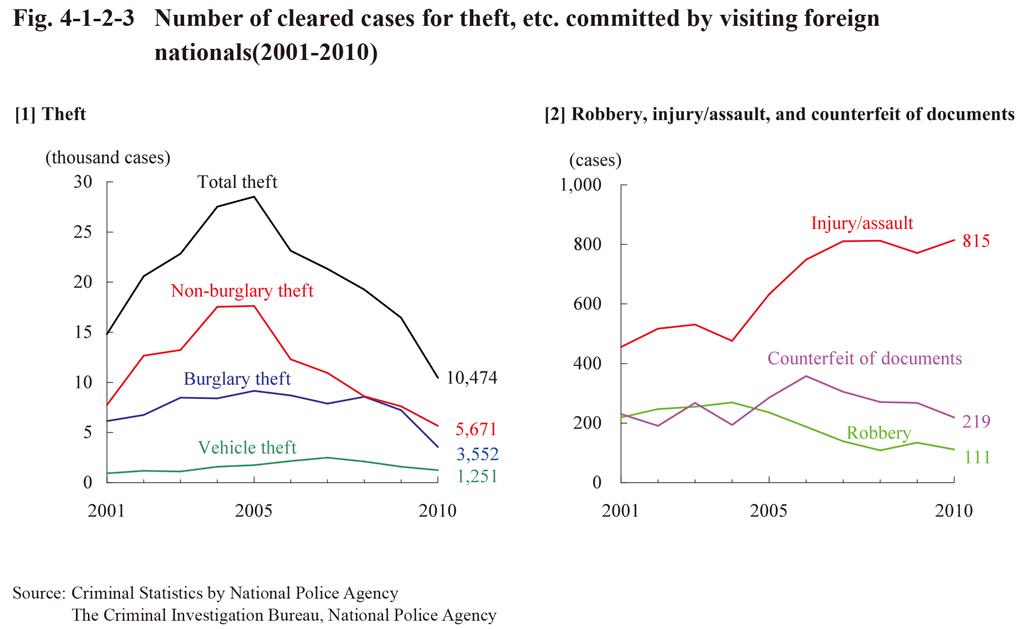
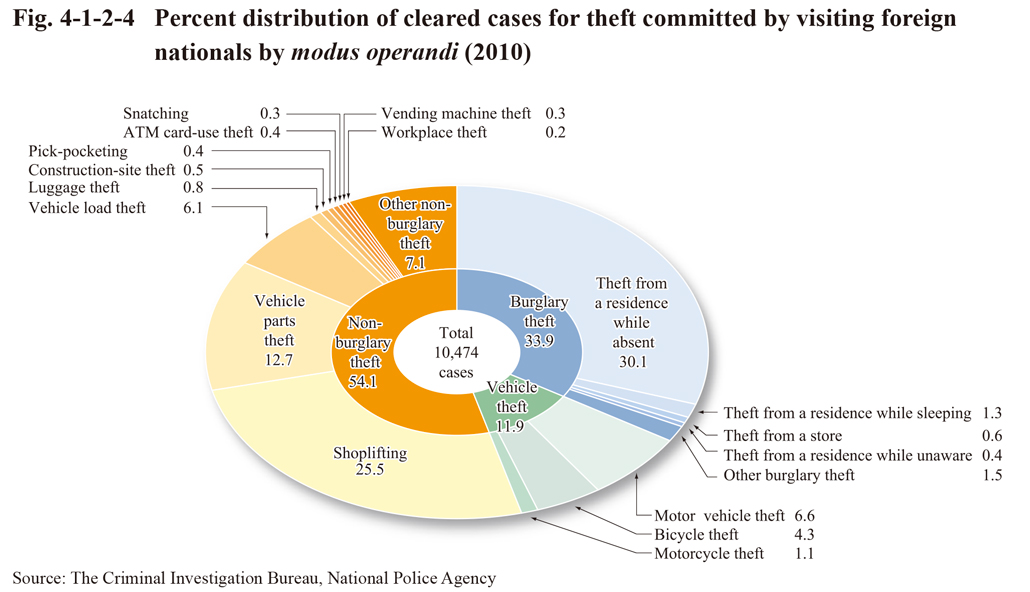
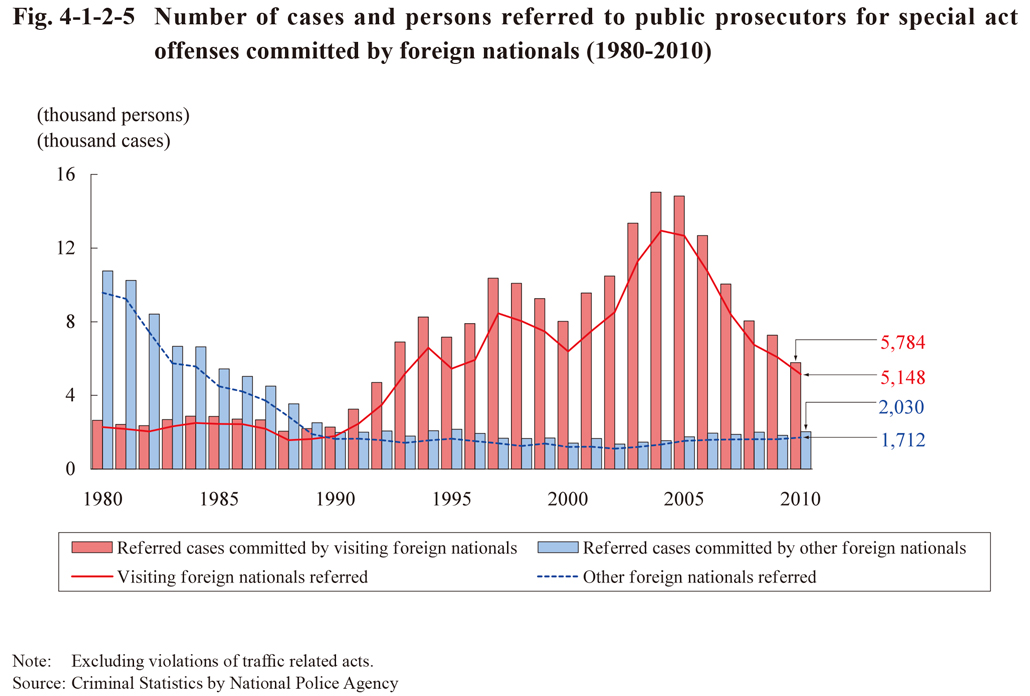
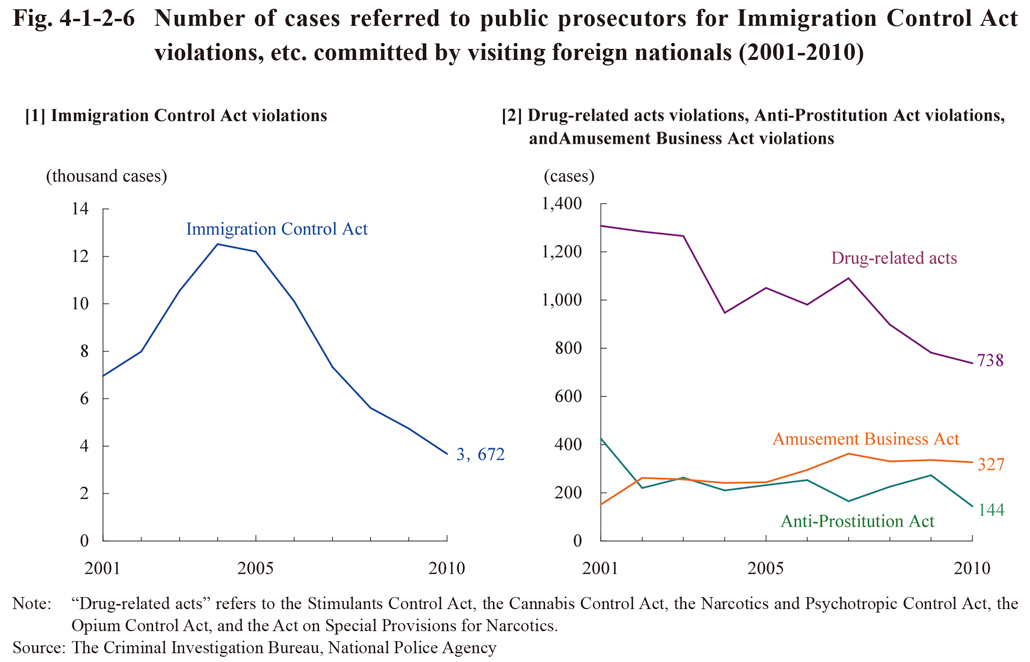
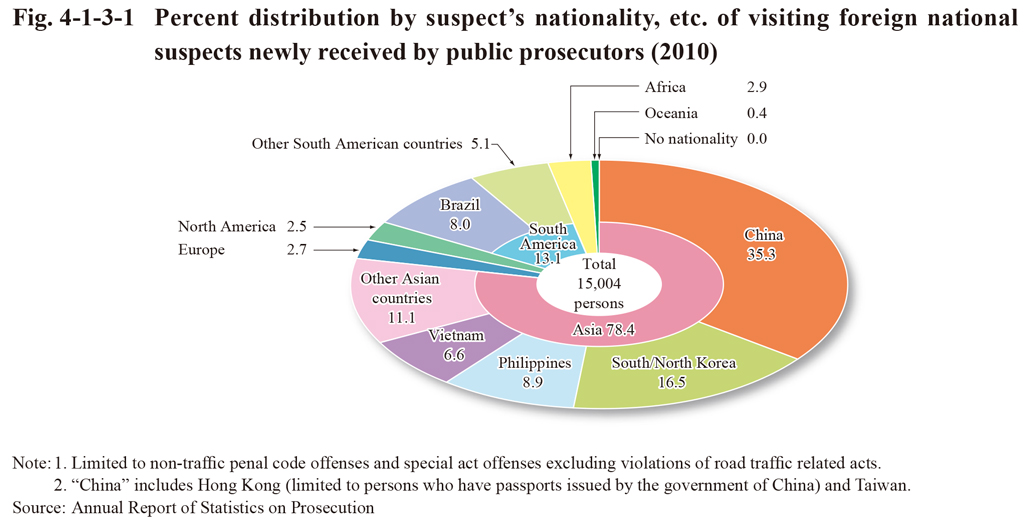
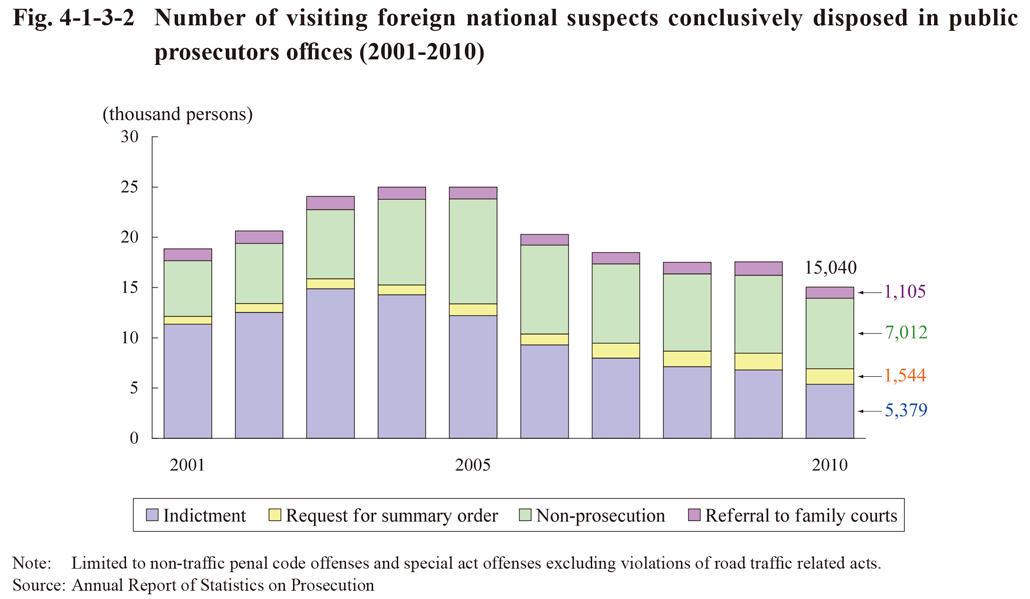
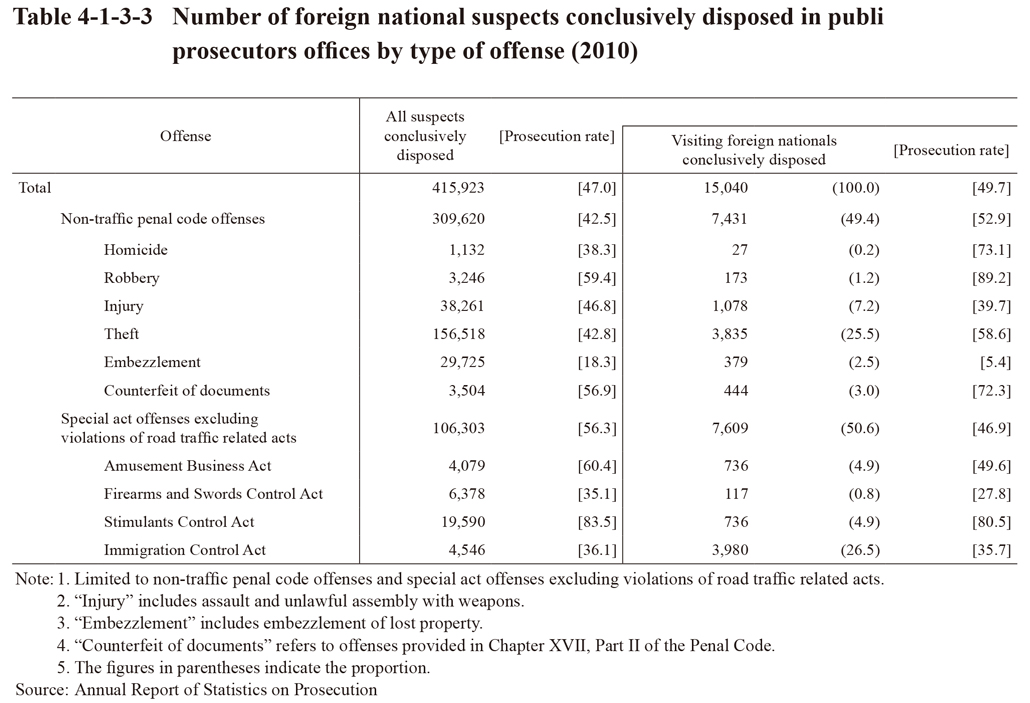
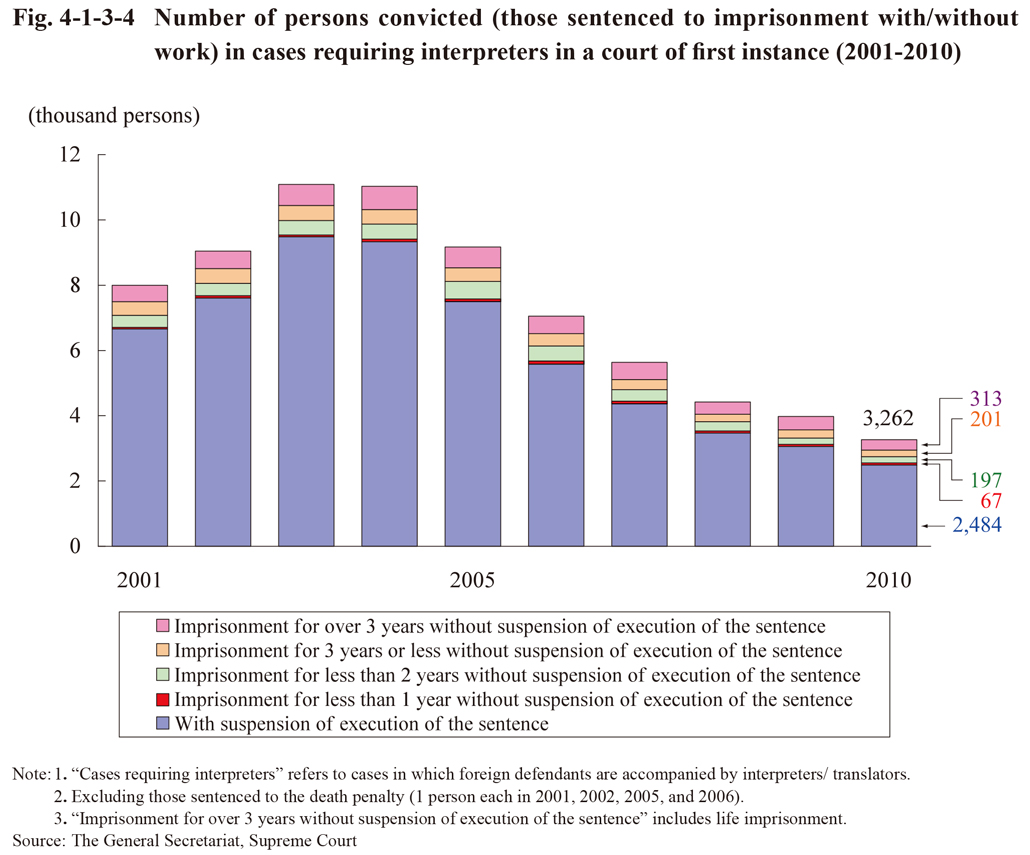
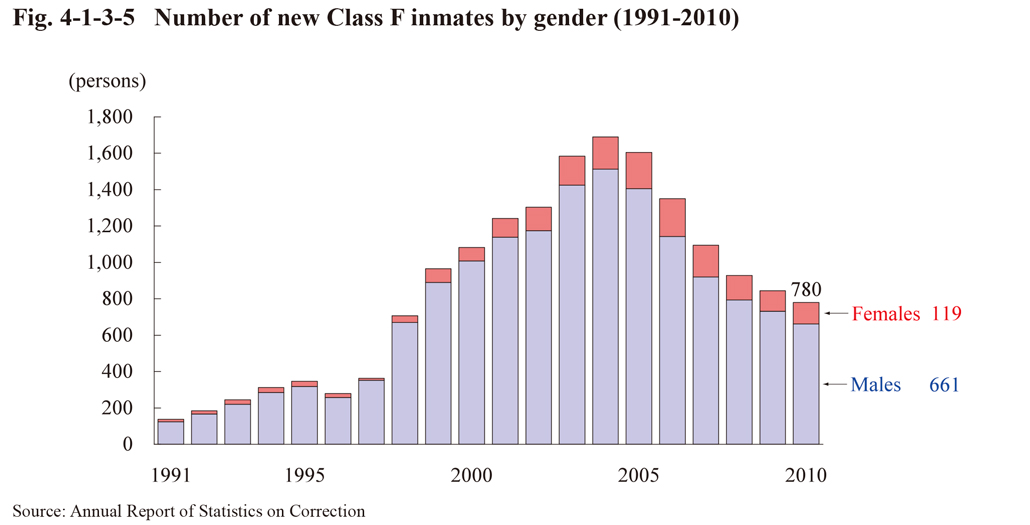 Fig. 4-1-3-5 Number of new Class F inmates by gender (1991-2010)
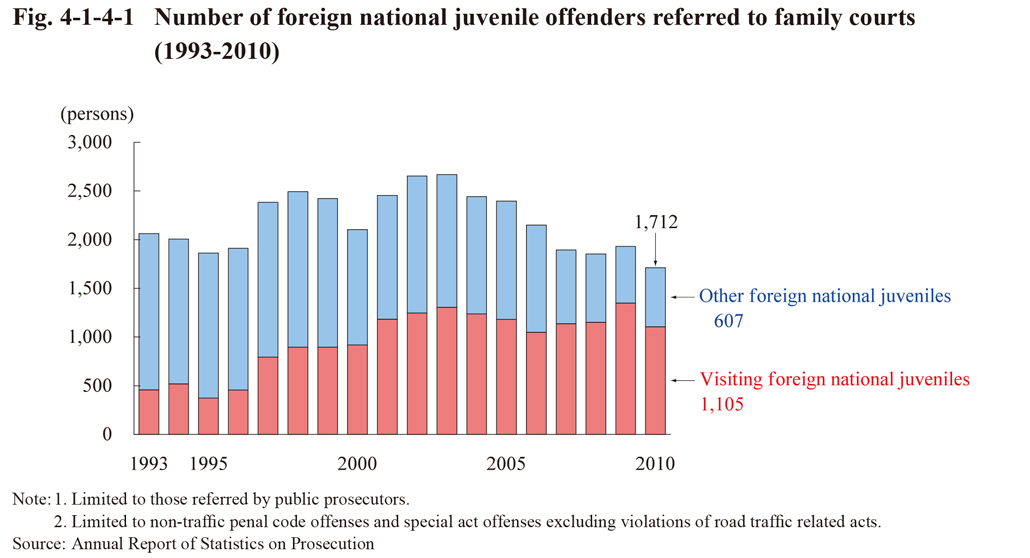 Fig. 4-1-4-1 Number of foreign national juvenile offenders referred to family courts (1993-2010)
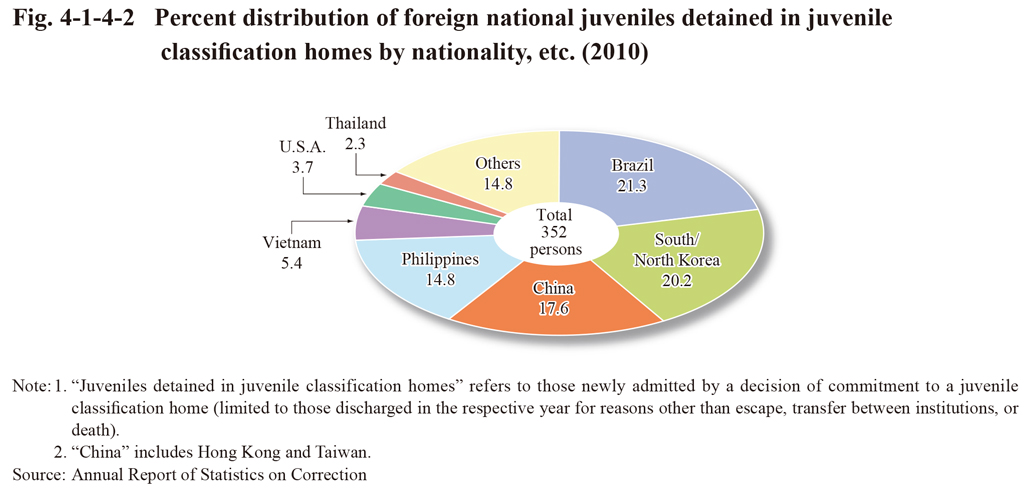
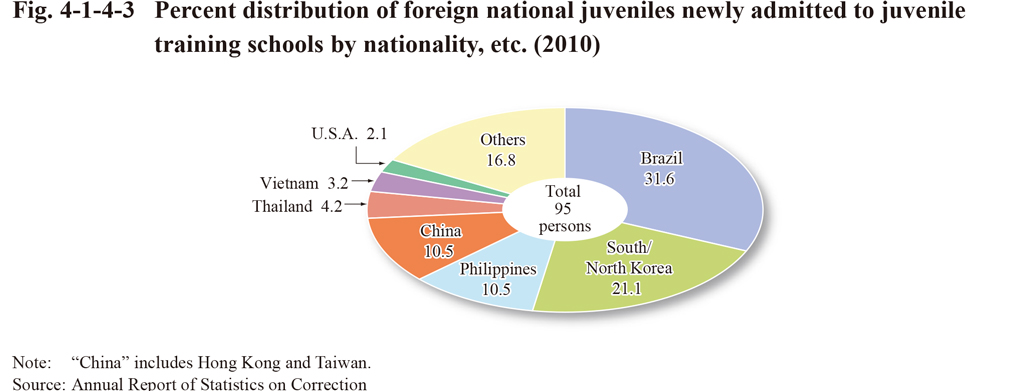
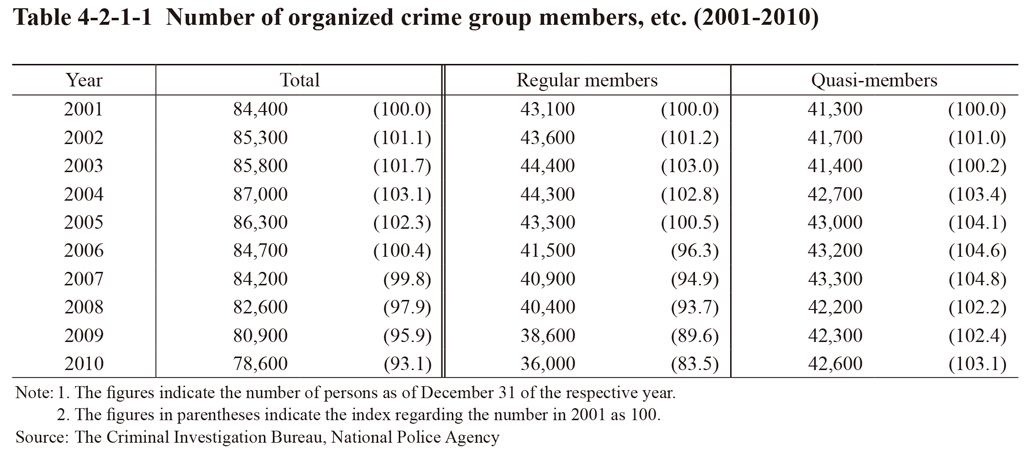 Table 4-2-1-1 Number of organized crime group members, etc. (2001-2010)
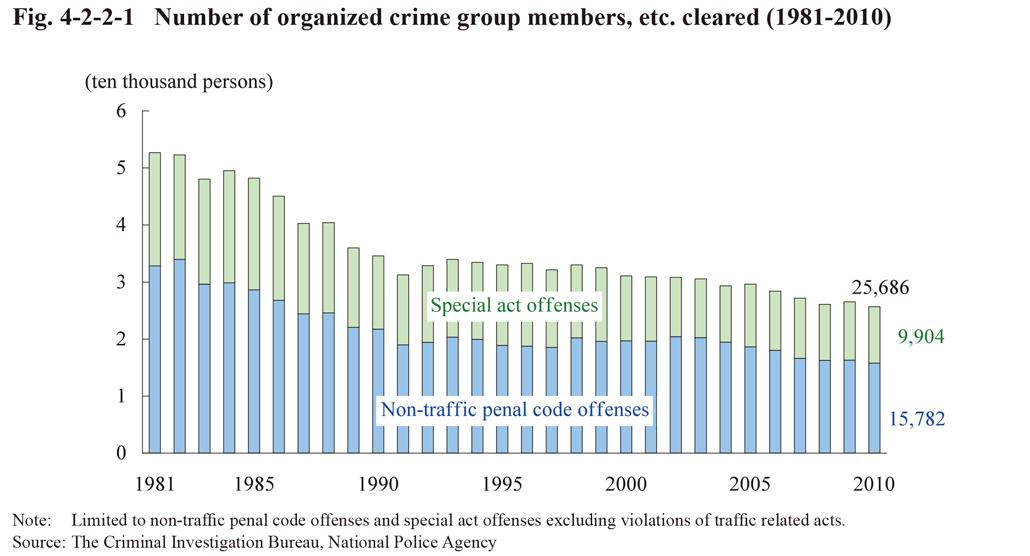 Fig. 4-2-2-1 Number of organized crime group members, etc. cleared (1981-2010)
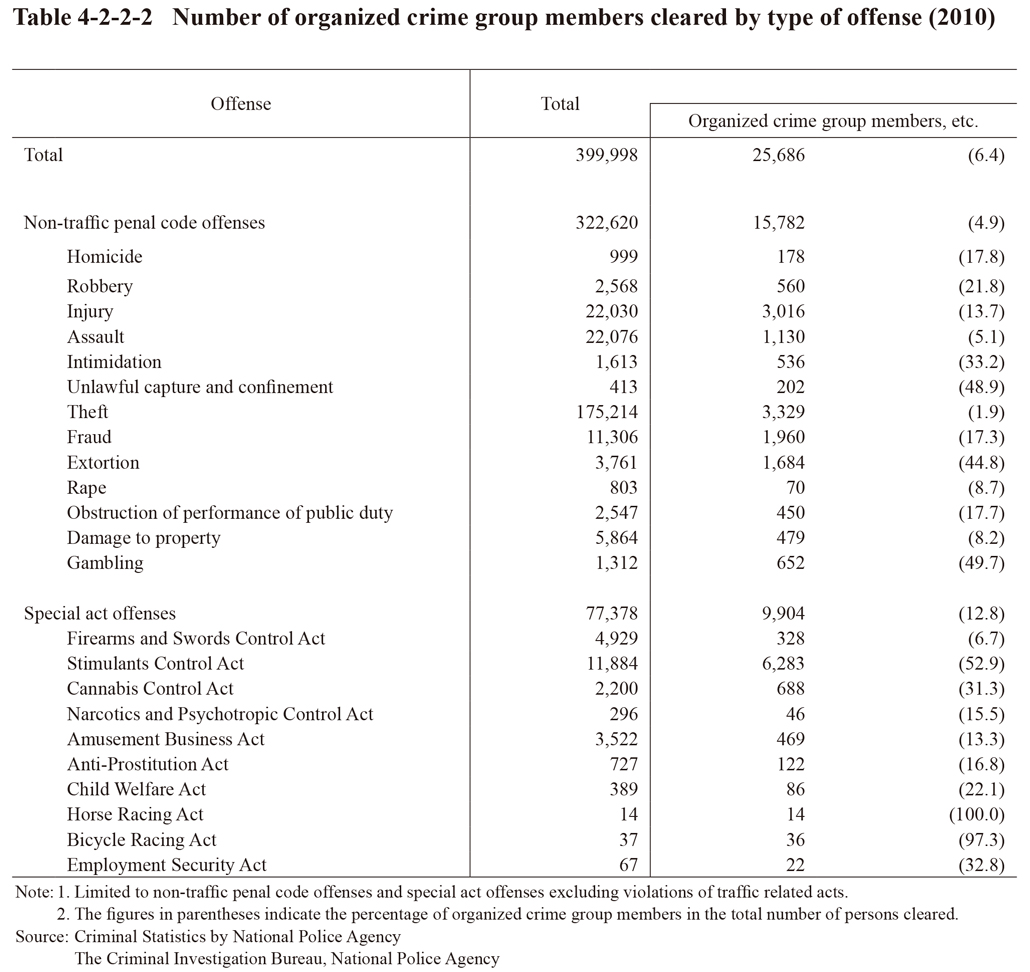 Table 4-2-2-2 Number of organized crime group members cleared by type of offense (2010)
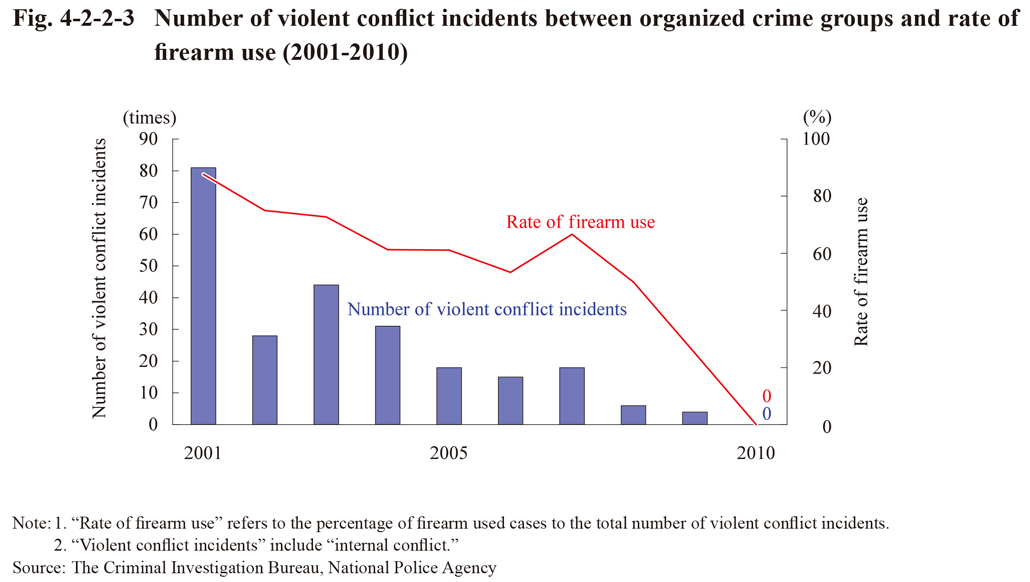
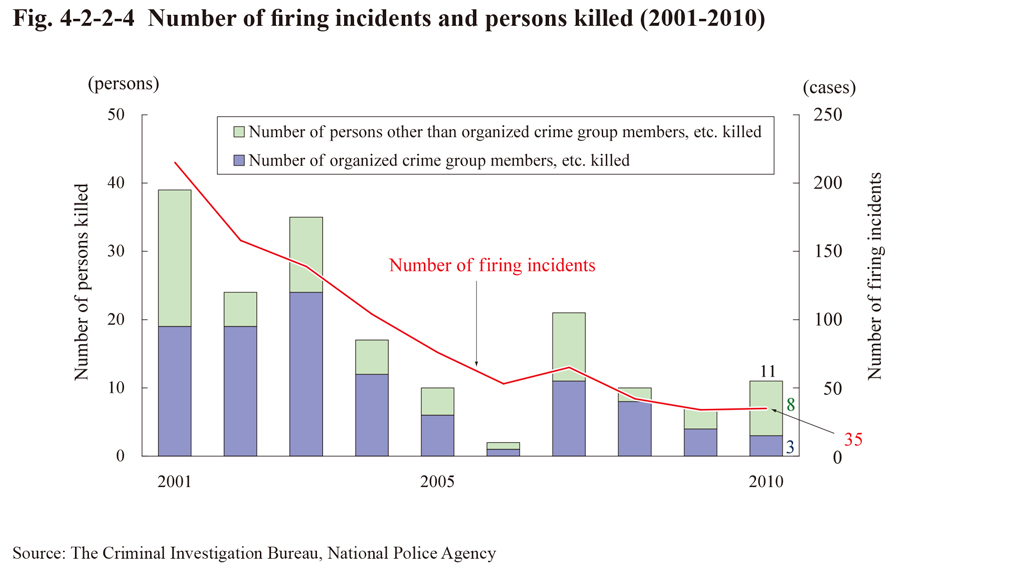 Fig. 4-2-2-4 Number of firing incidents and persons killed (2001-2010)
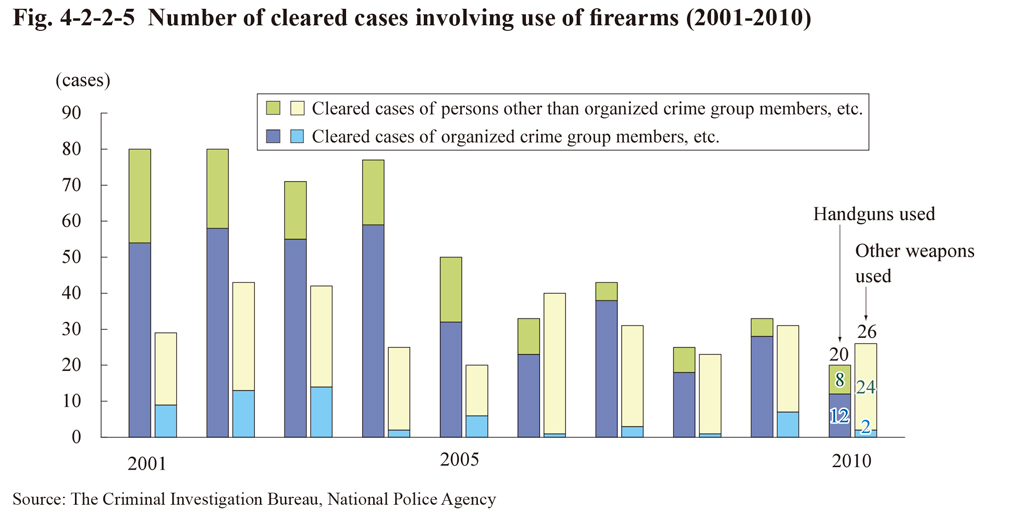 Fig. 4-2-2-5 Number of cleared cases involving use of firearms (2001-2010)
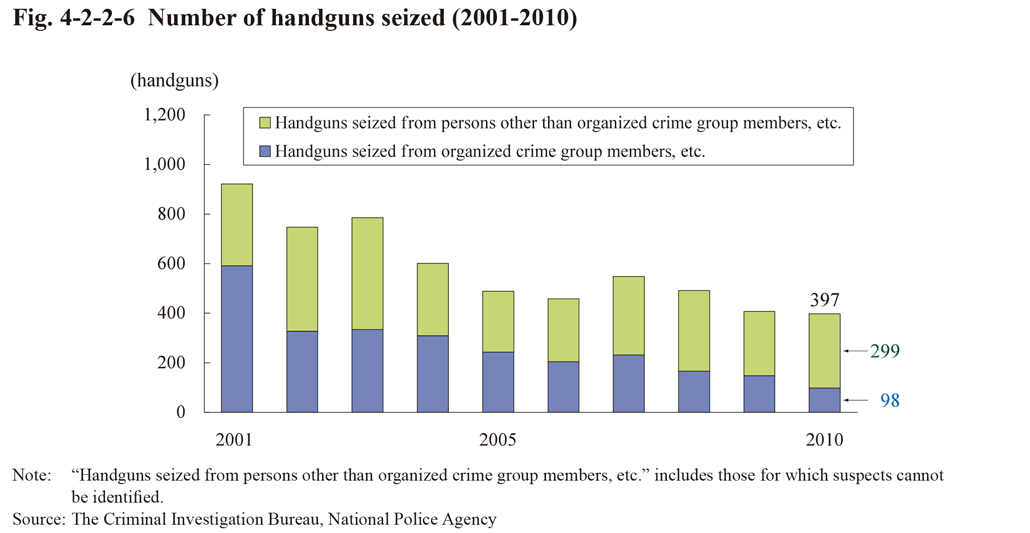 Fig. 4-2-2-6 Number of handguns seized (2001-2010)
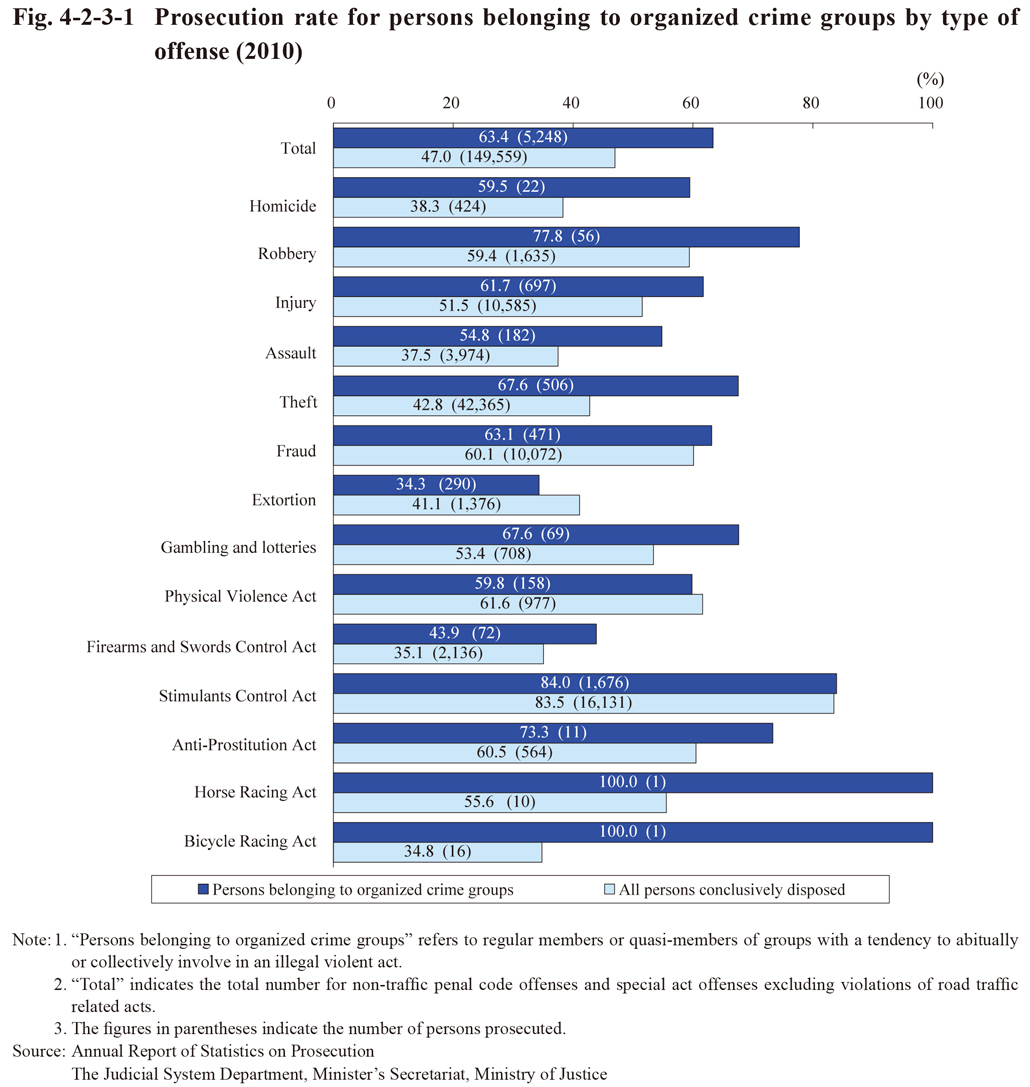
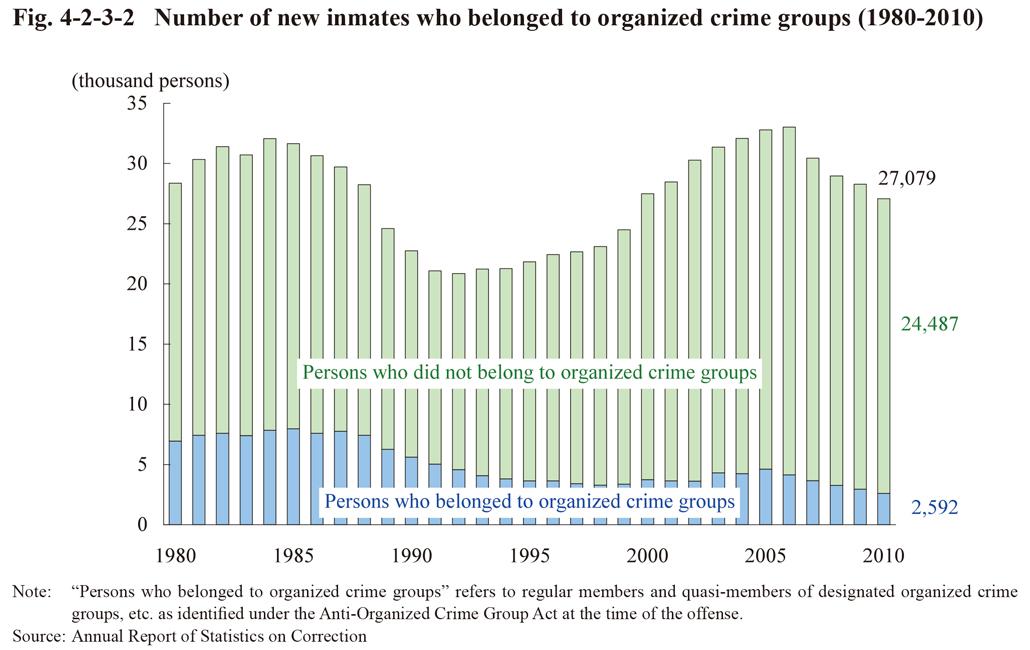 Fig. 4-2-3-2 Number of new inmates who belonged to organized crime groups (1980-2010)
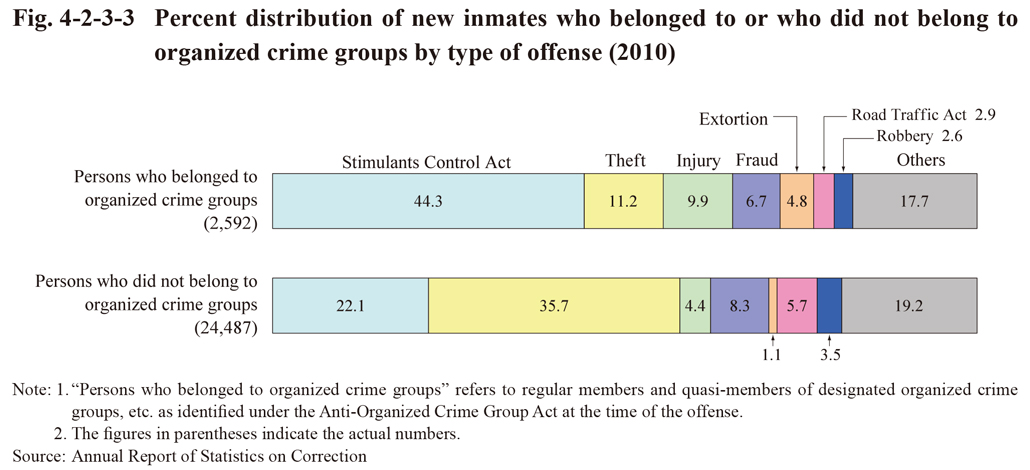
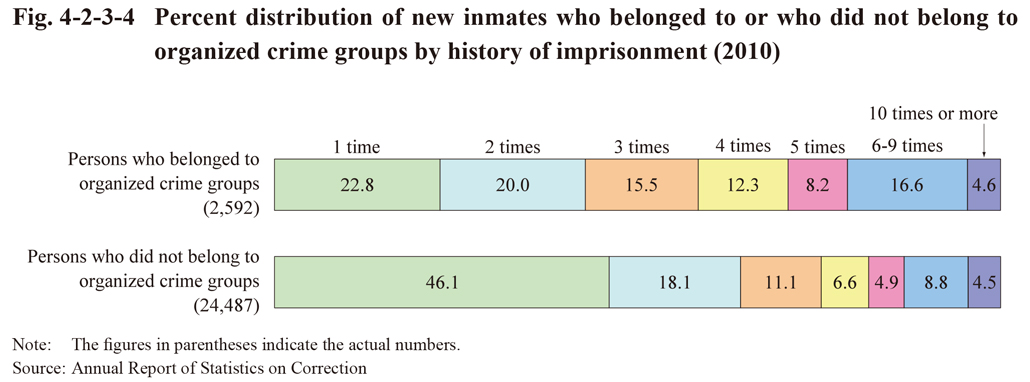
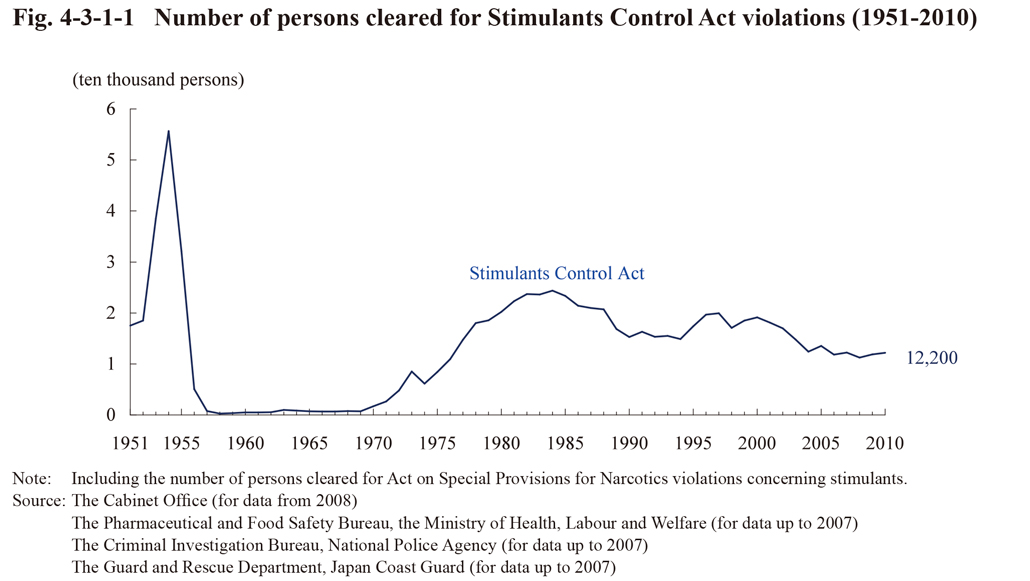 Fig. 4-3-1-1 Number of persons cleared for Stimulants Control Act violations (1951-2010)
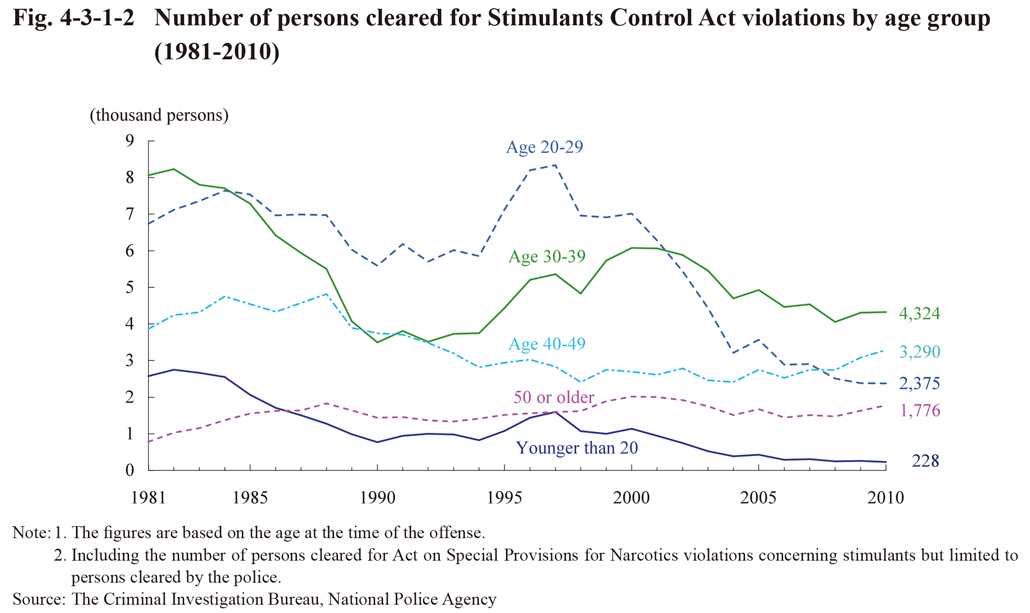
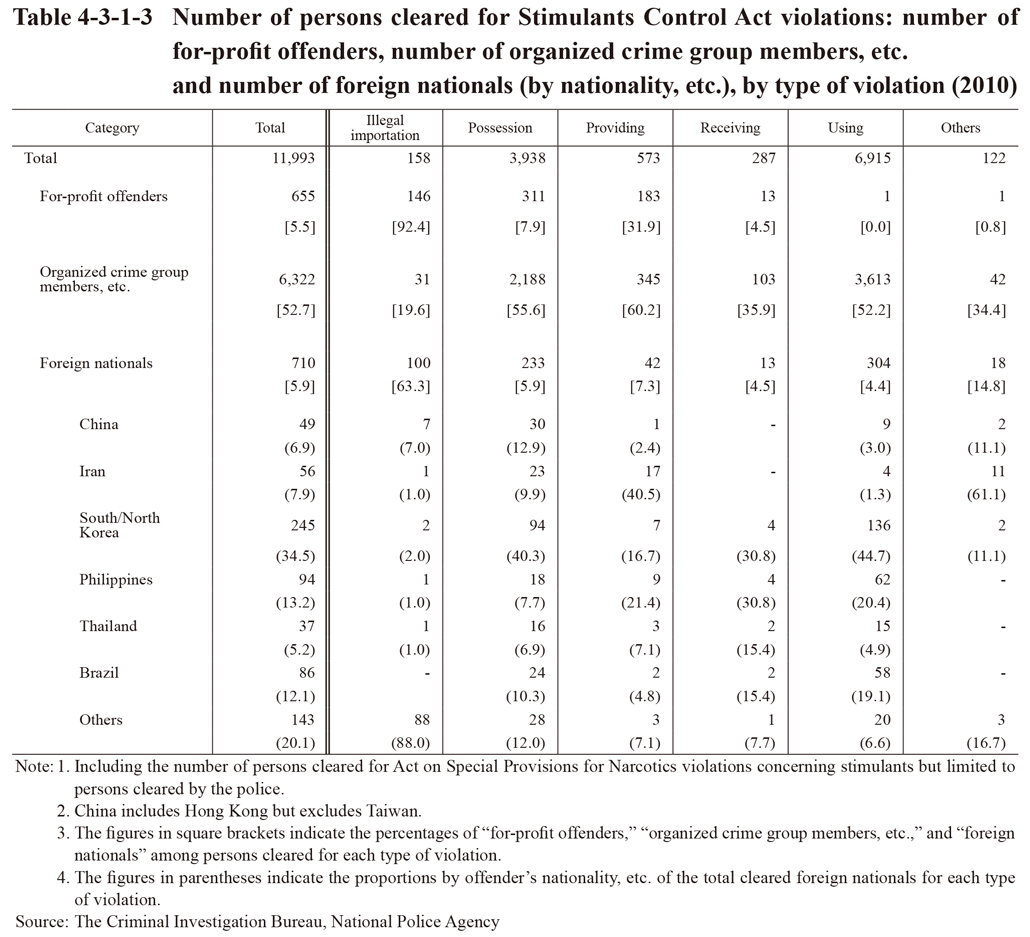
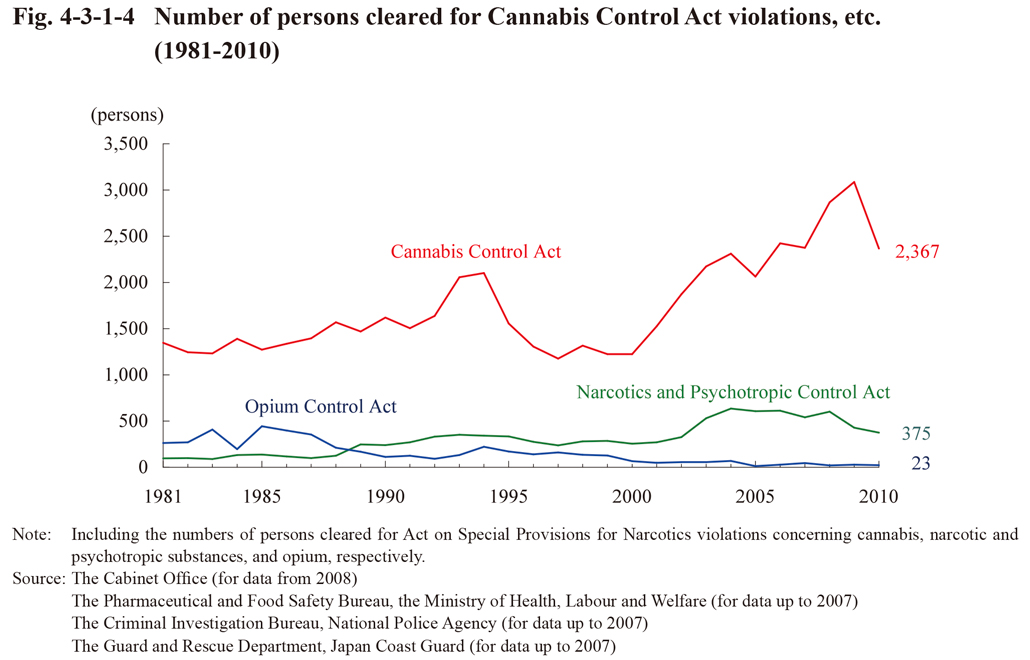 Fig. 4-3-1-4 Number of persons cleared for Cannabis Control Act violations, etc. (1981-2010)
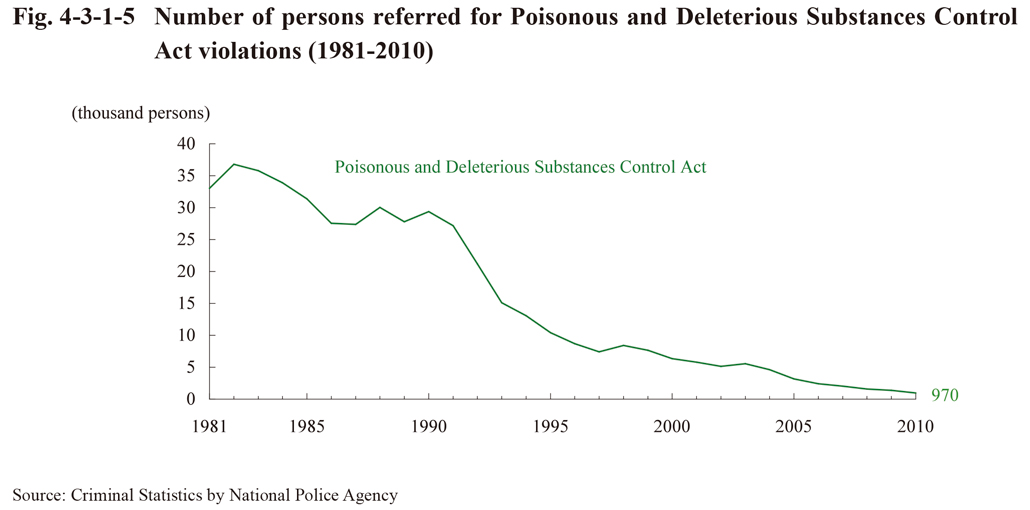
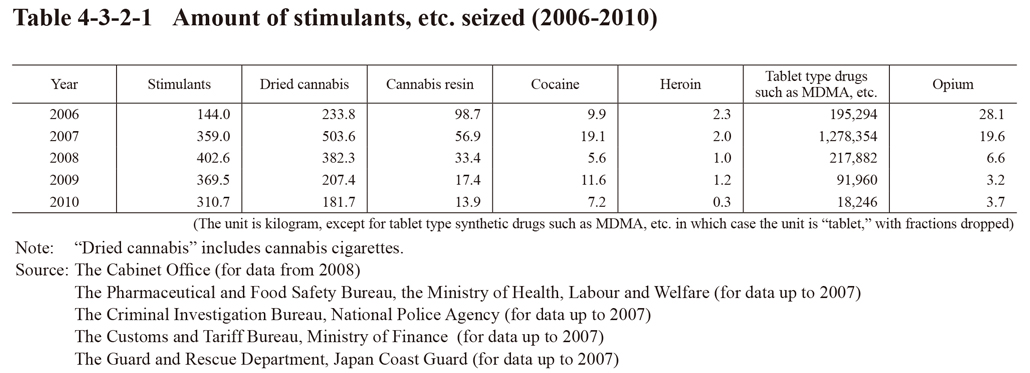 Table 4-3-2-1 Amount of stimulants, etc. seized (2006-2010)
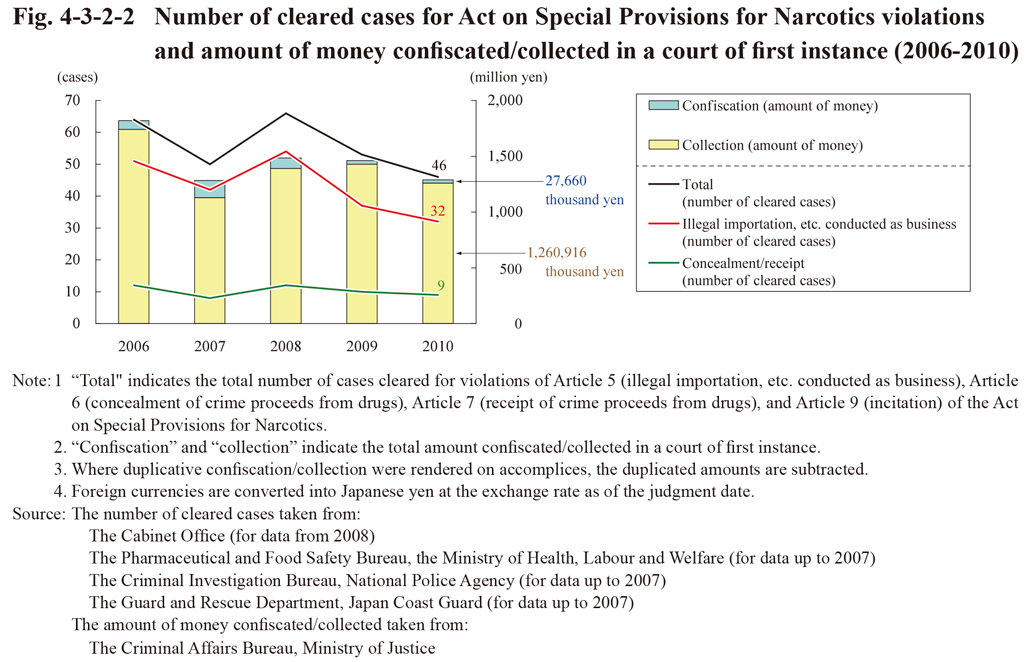
 Table 4-3-3-1 Prosecution rate for Stimulants Control Act violations, etc. (2010)
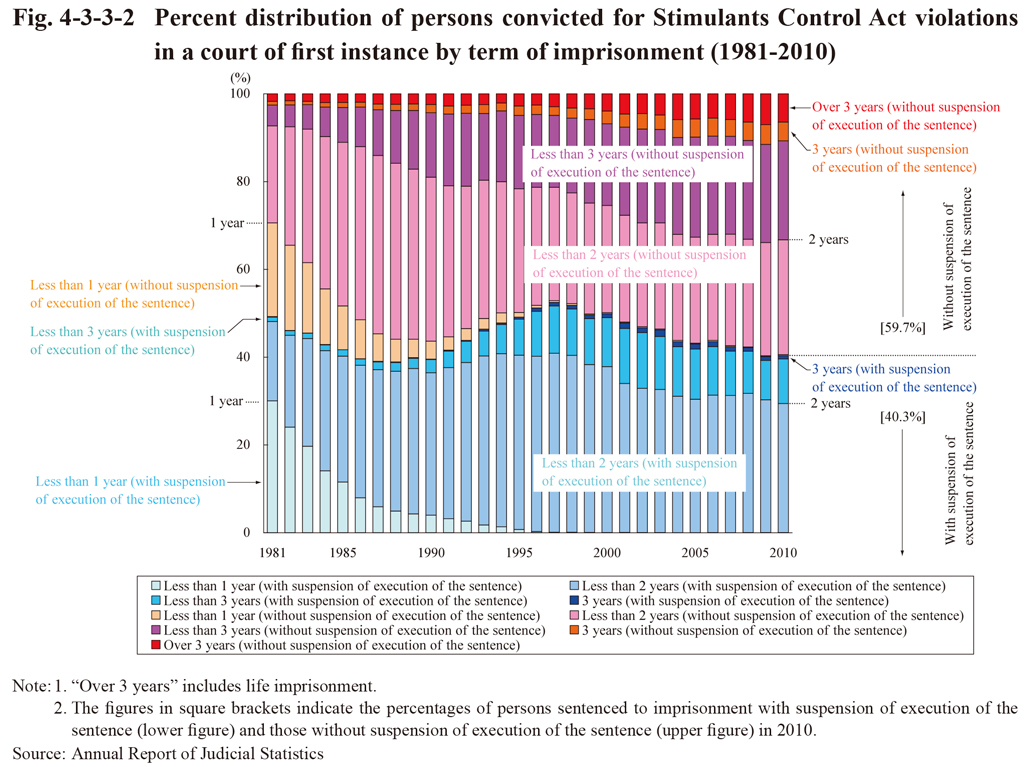
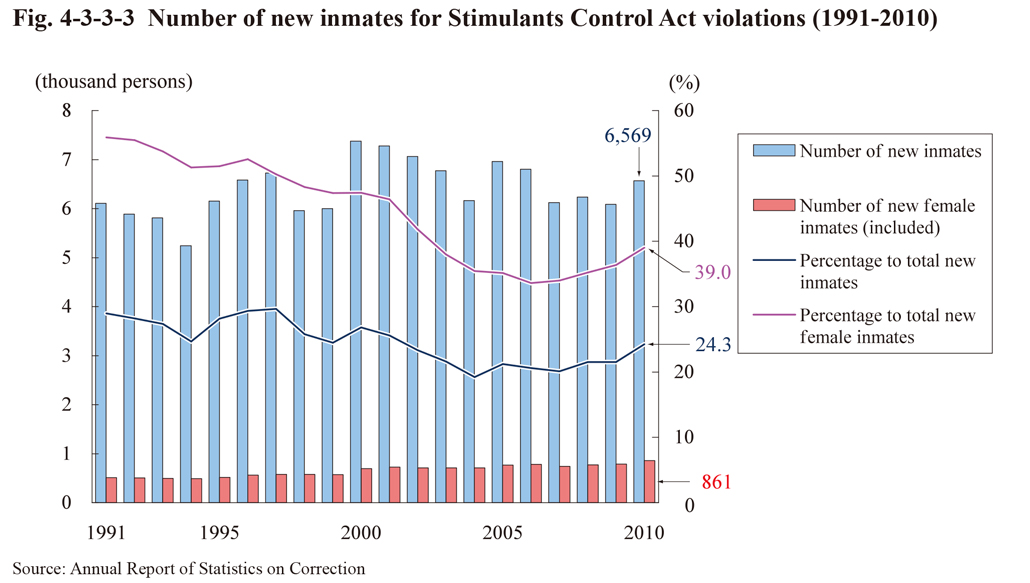 Fig. 4-3-3-3 Number of new inmates for Stimulants Control Act violations (1991-2010)
 Fig. 4-4-1-1 Number of persons cleared for non-traffic penal code offenses by age group (1991-2010)
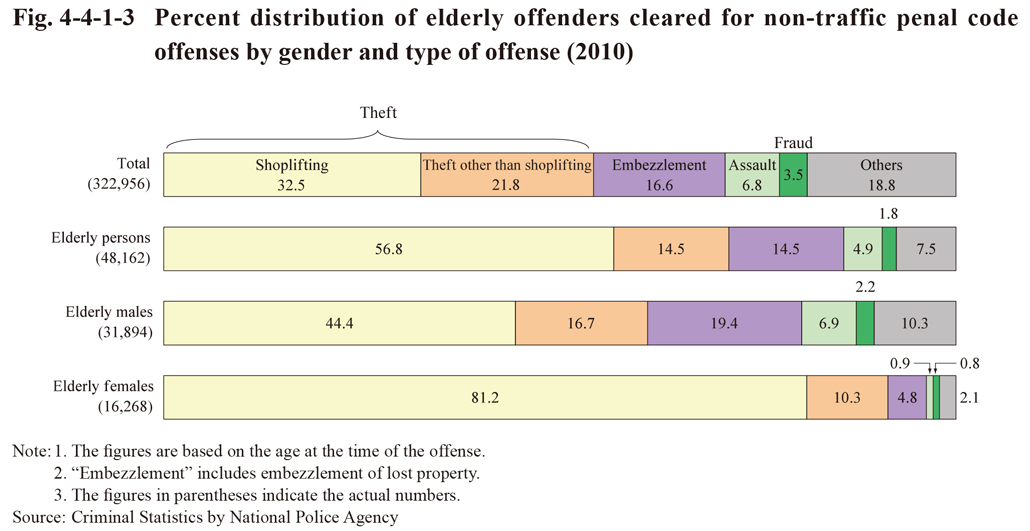
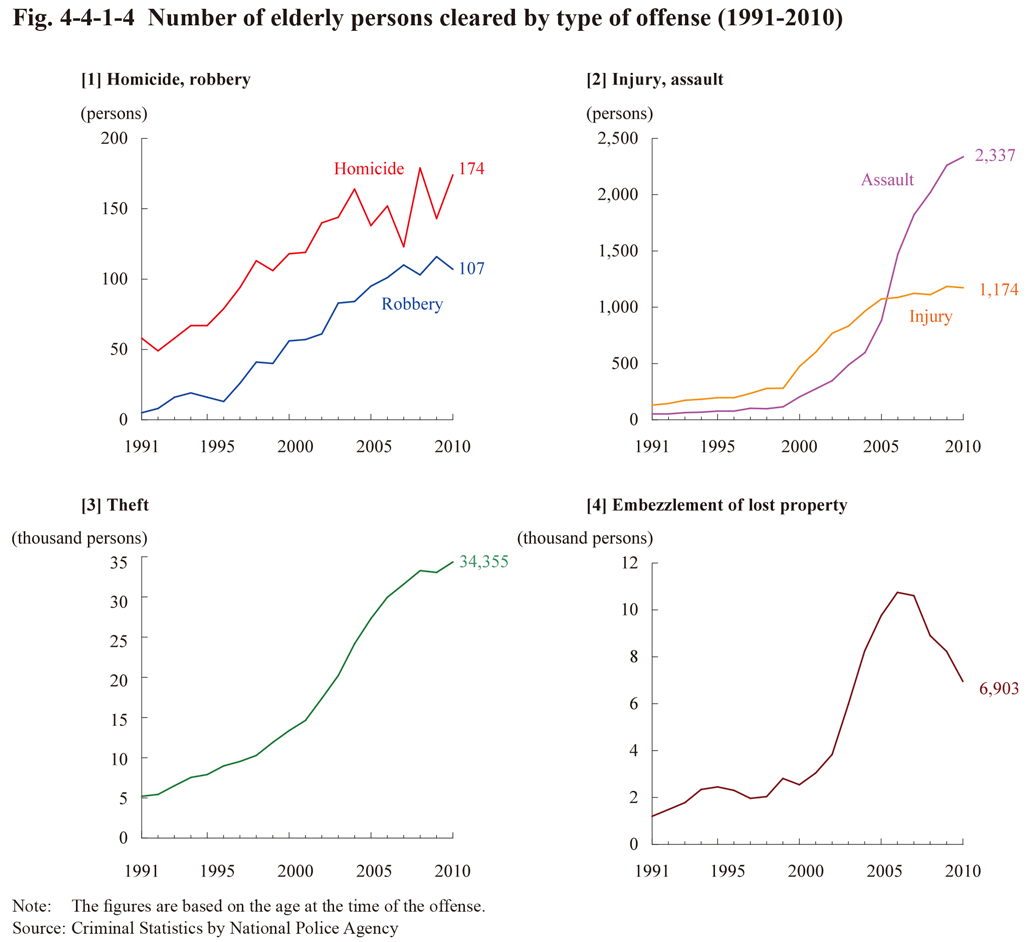 Fig. 4-4-1-4 Number of elderly persons cleared by type of offense (1991-2010)
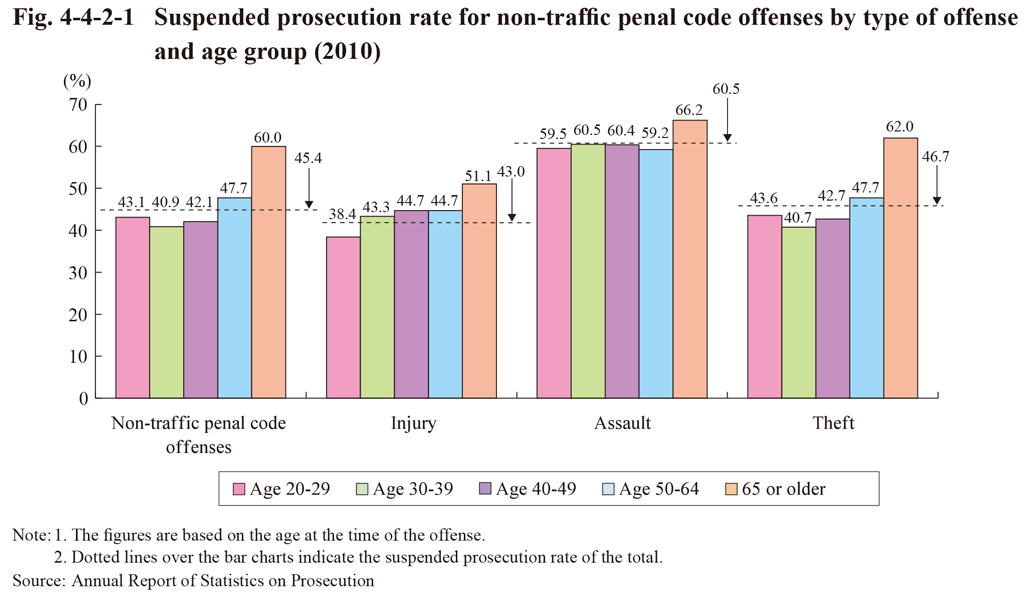
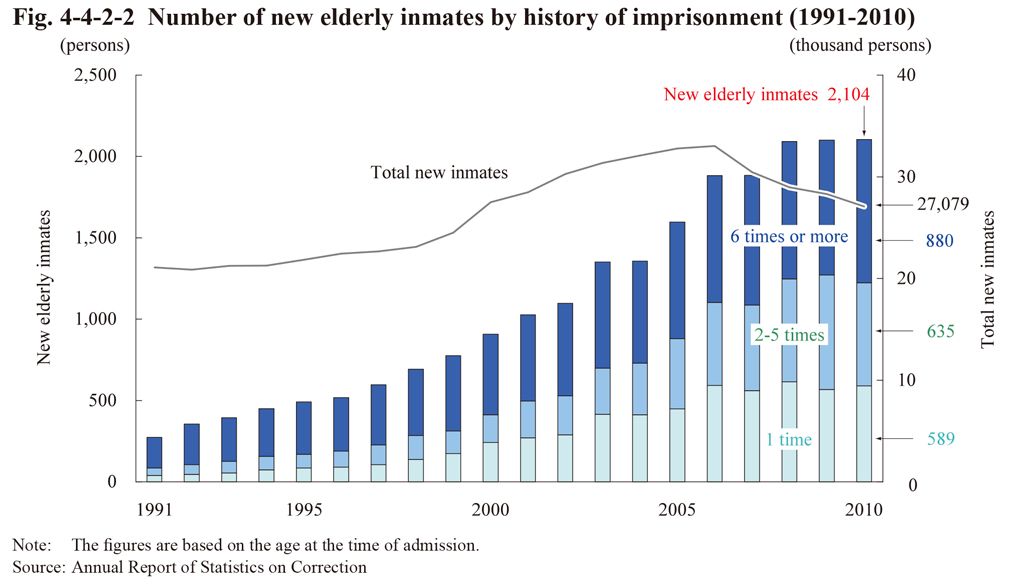 Fig. 4-4-2-2 Number of new elderly inmates by history of imprisonment (1991-2010)
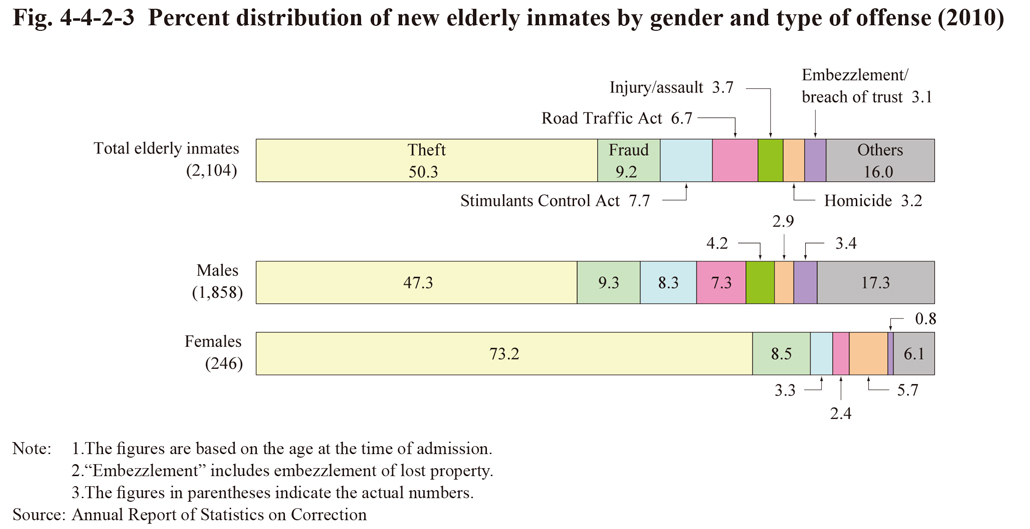 Fig. 4-4-2-3 Percent distribution of new elderly inmates by gender and type of offense (2010)
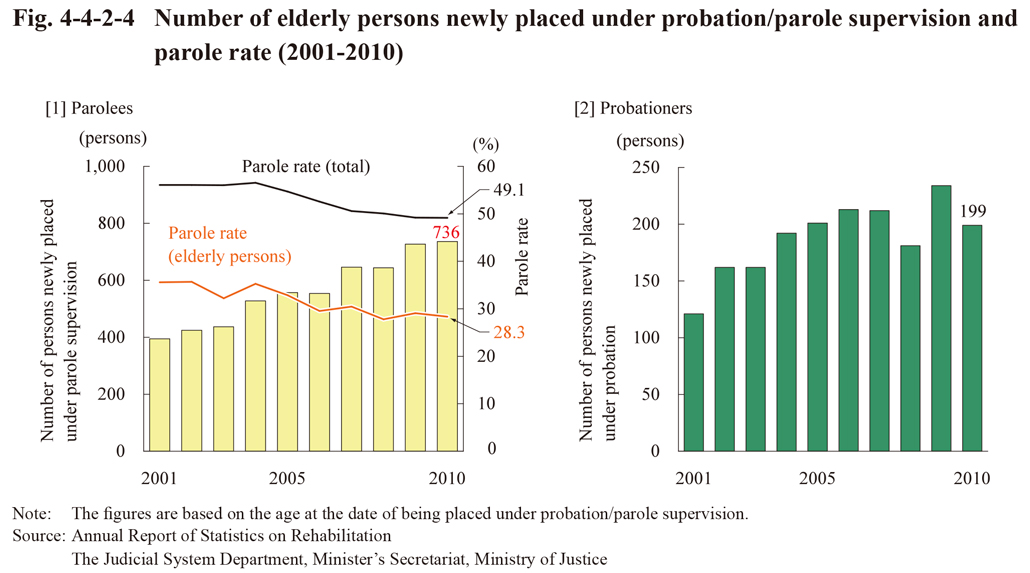
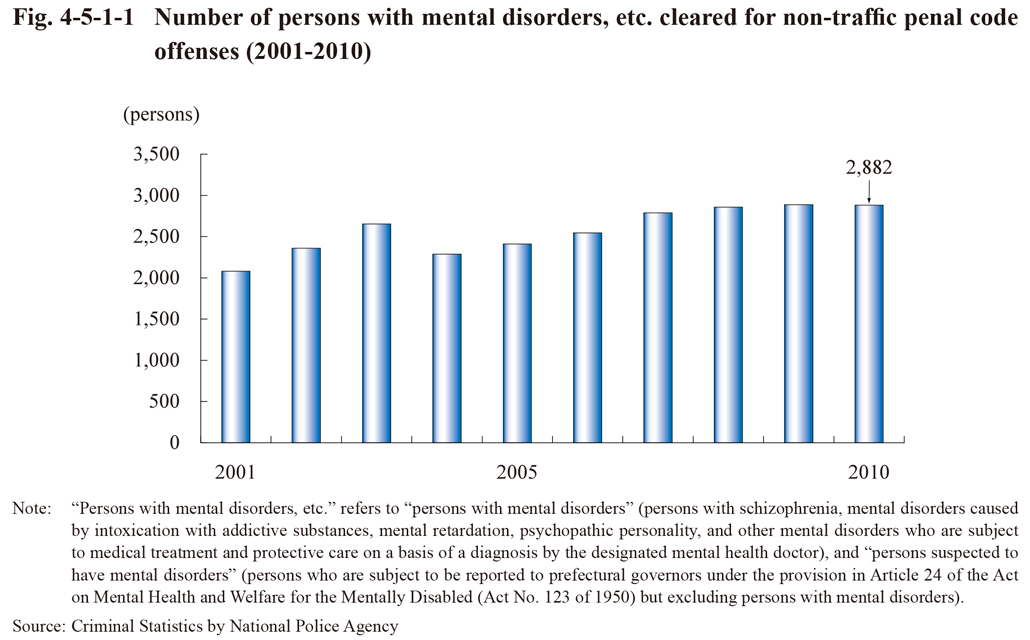
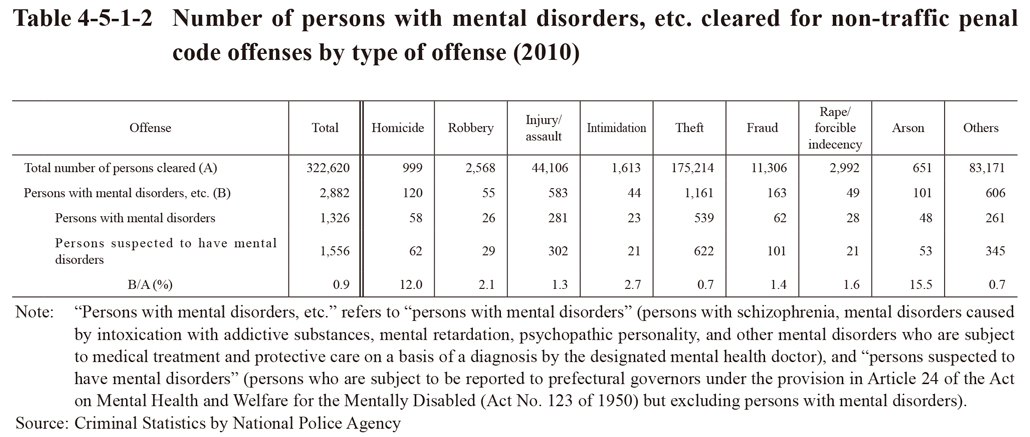
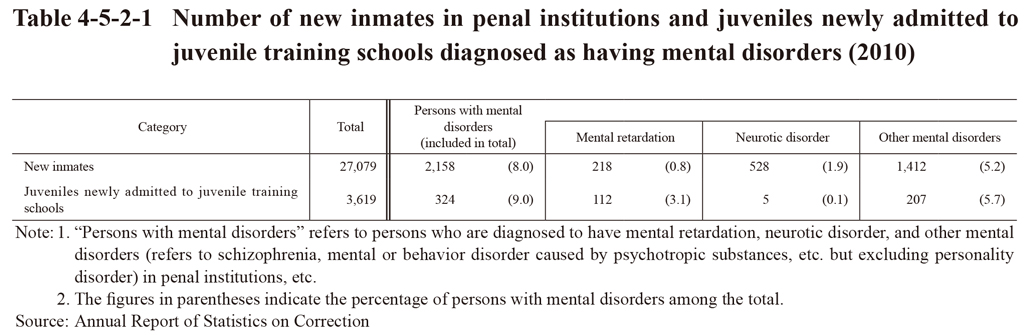
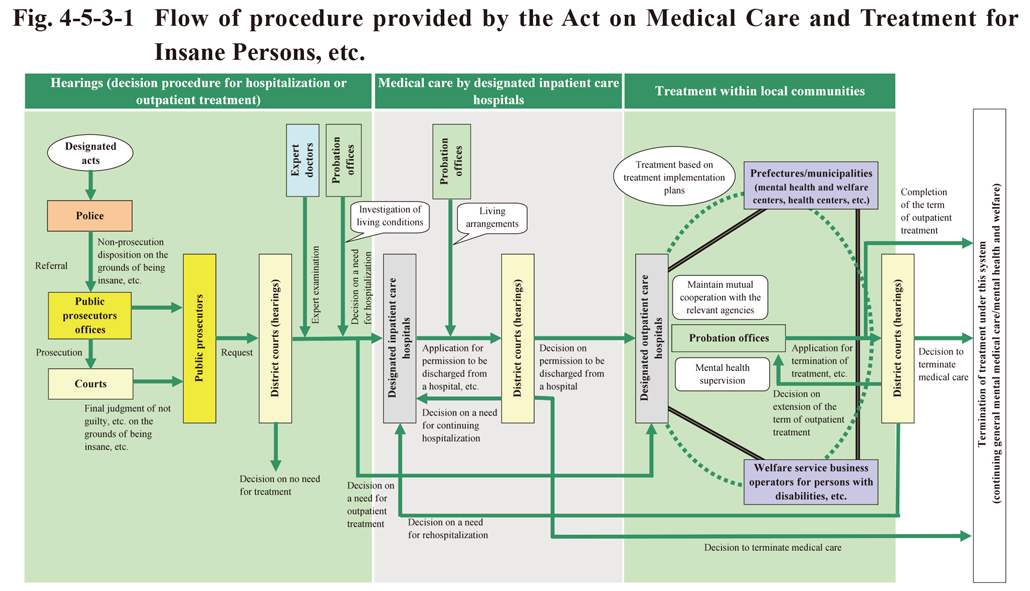
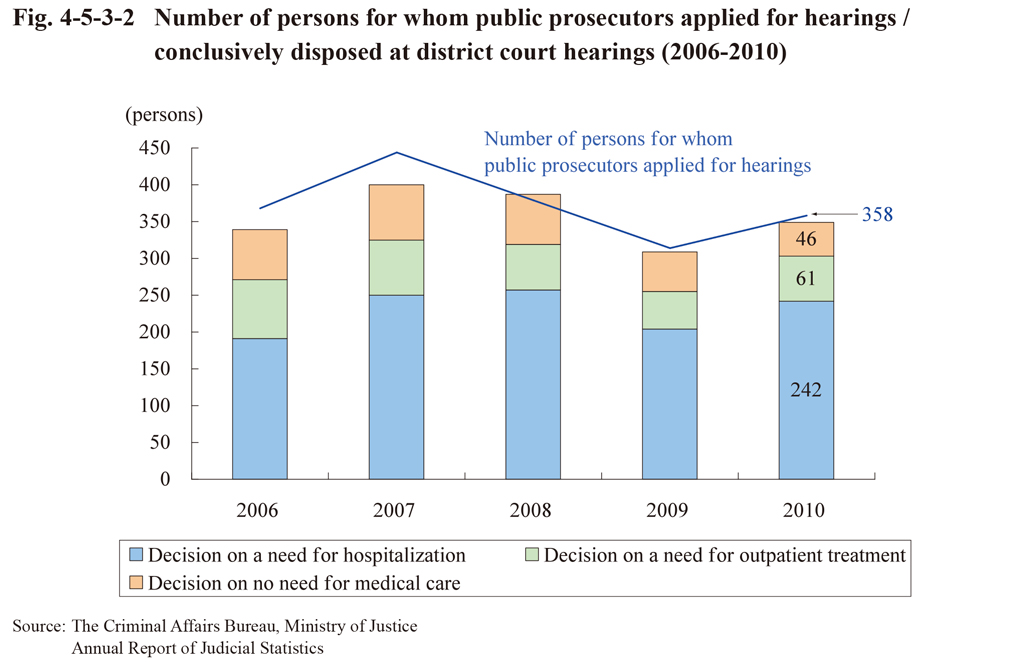
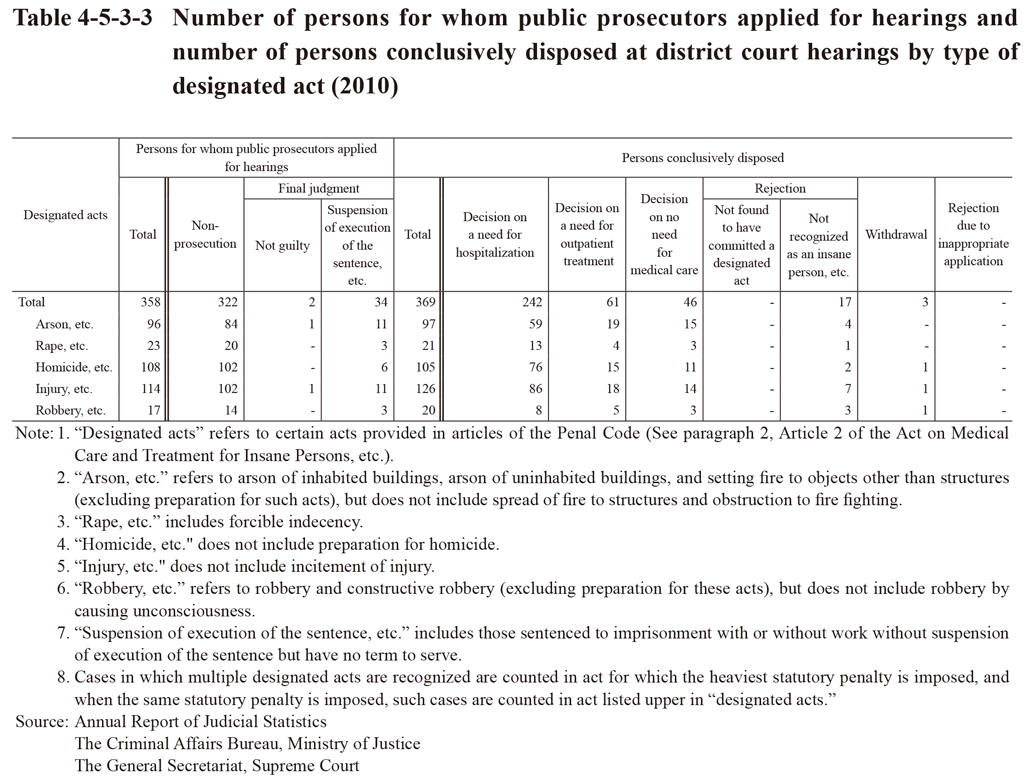
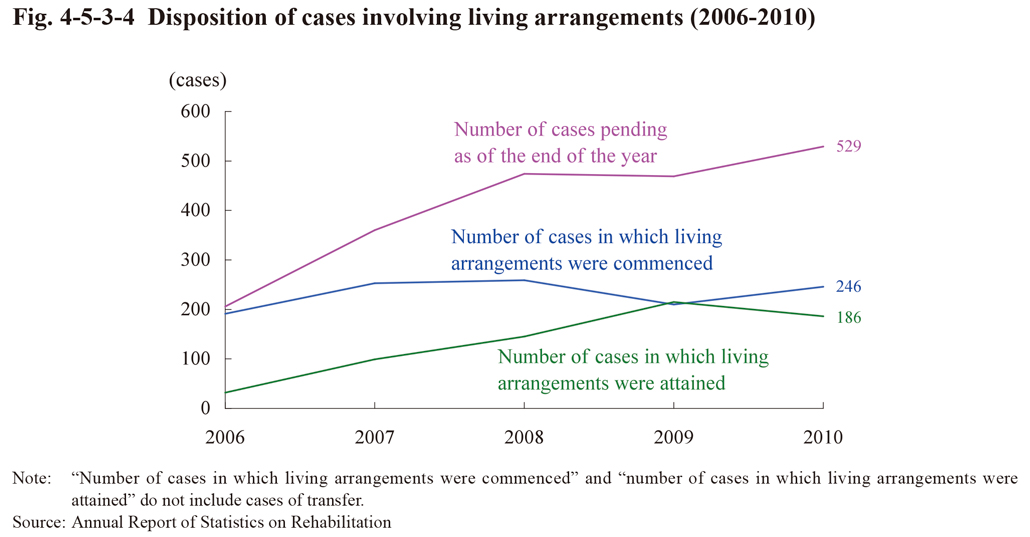 Fig. 4-5-3-4 Disposition of cases involving living arrangements (2006-2010)
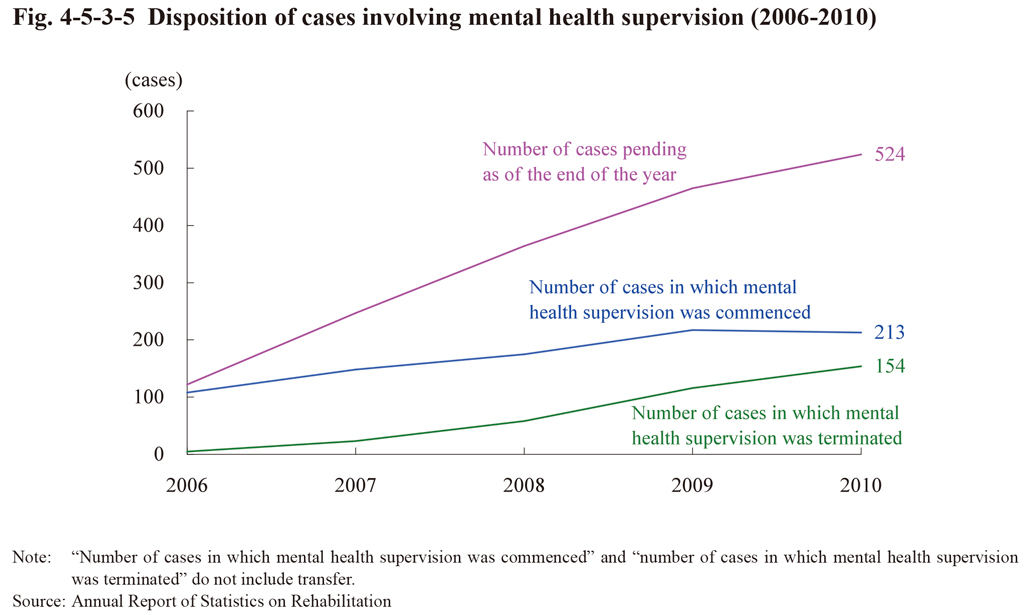 Fig. 4-5-3-5 Disposition of cases involving mental health supervision (2006-2010)
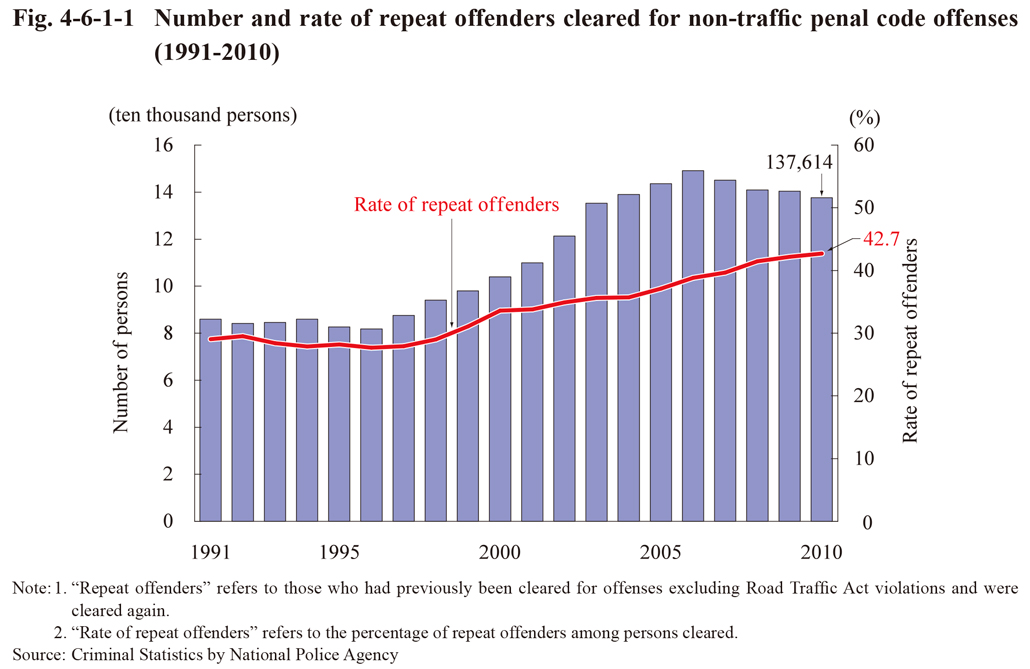
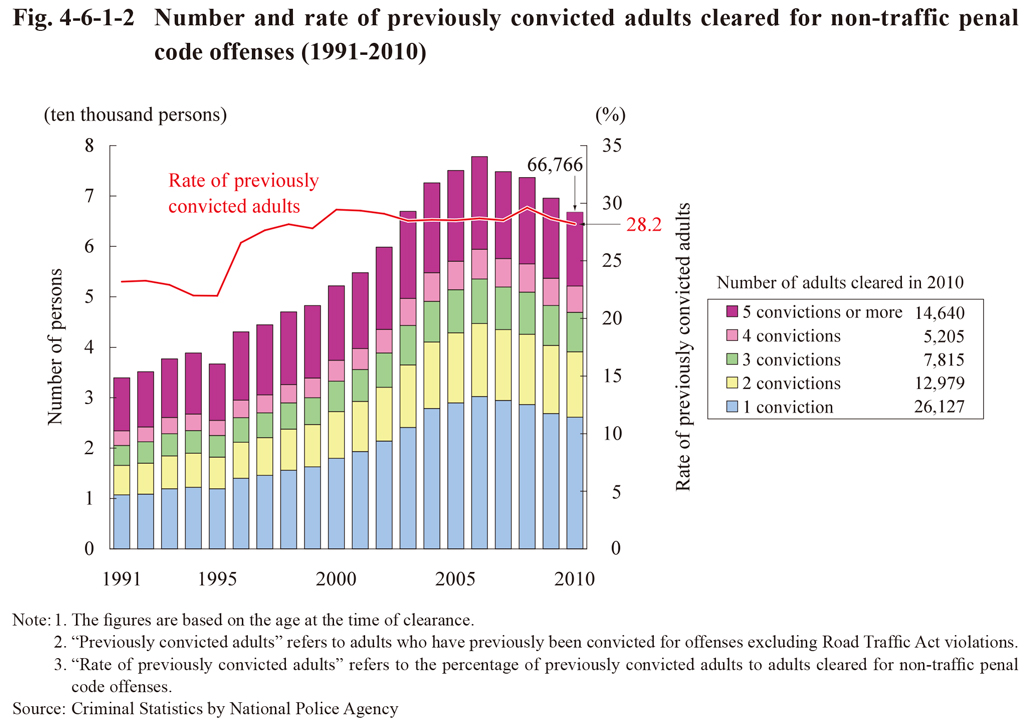
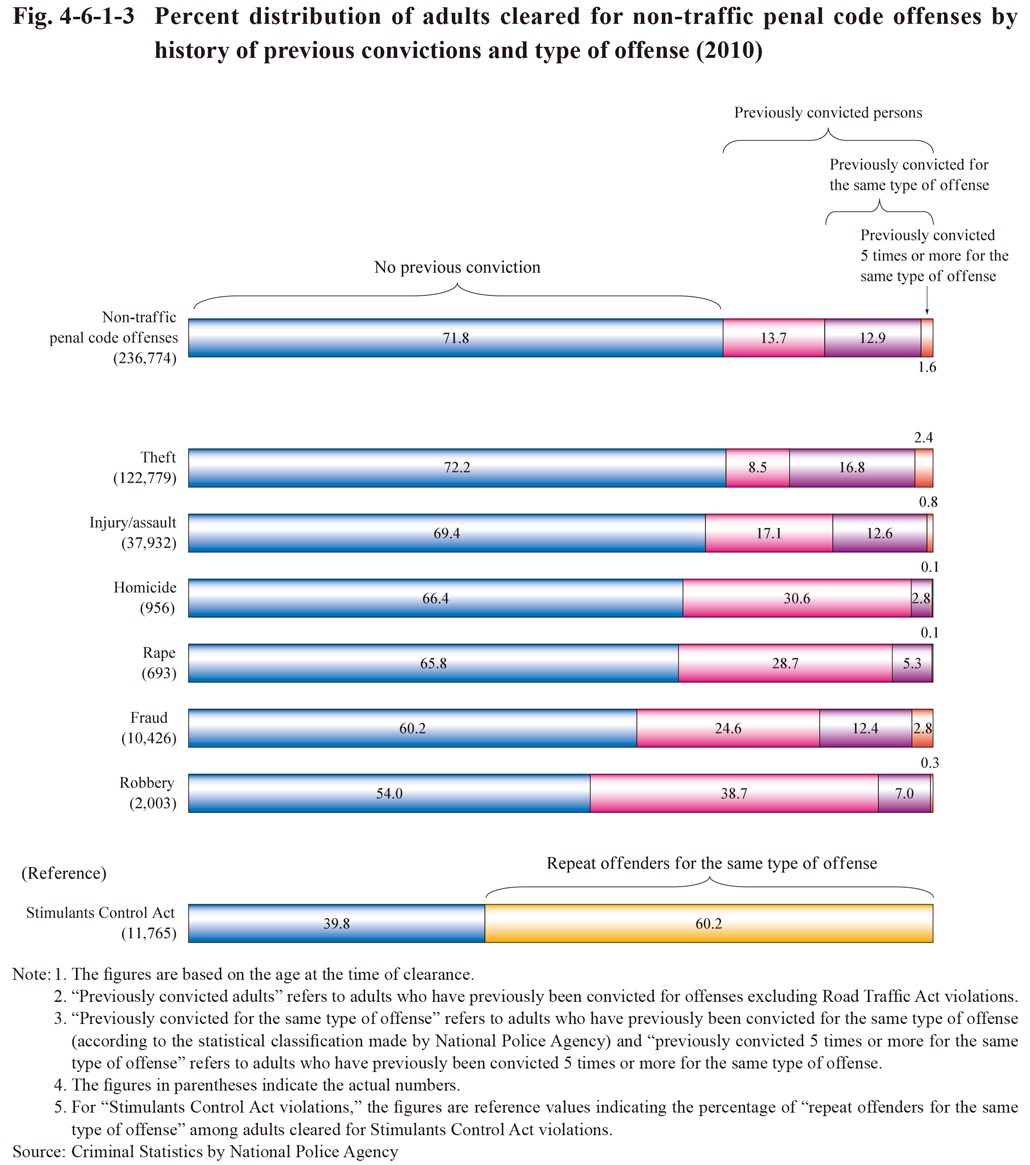
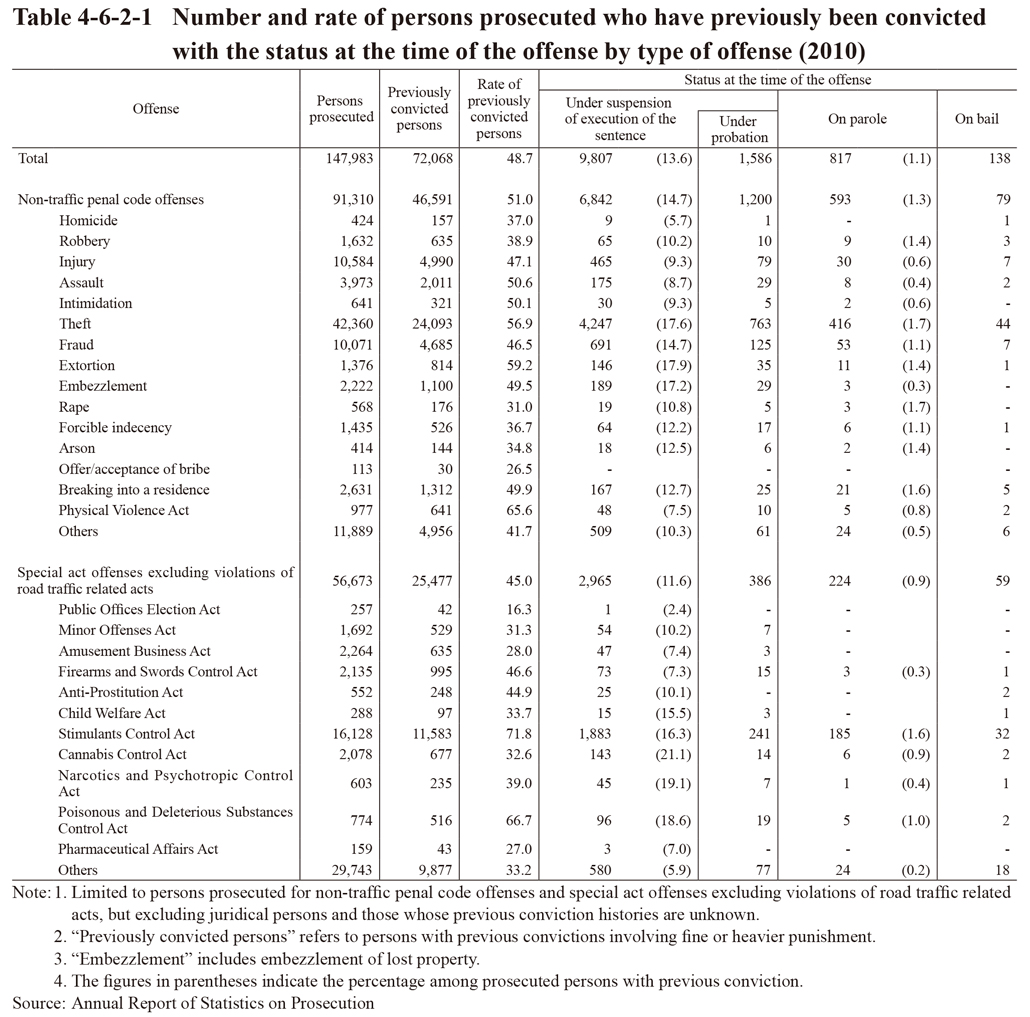
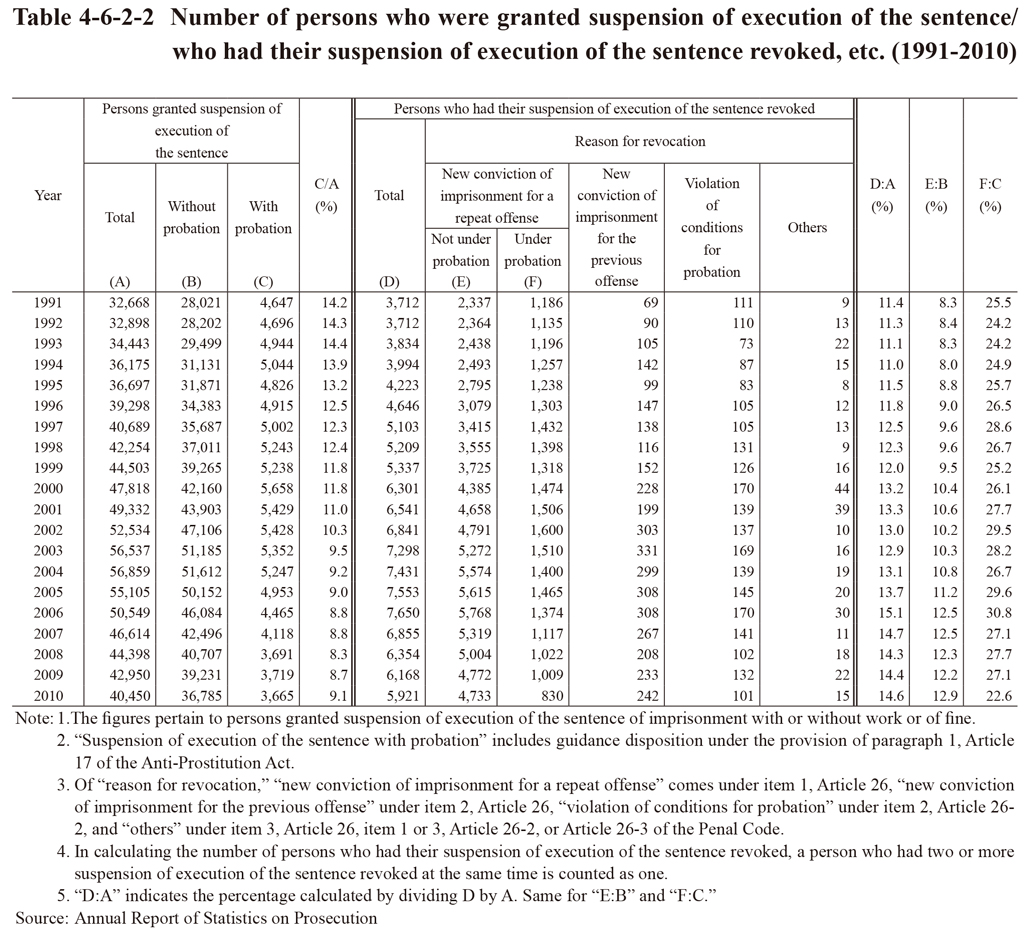
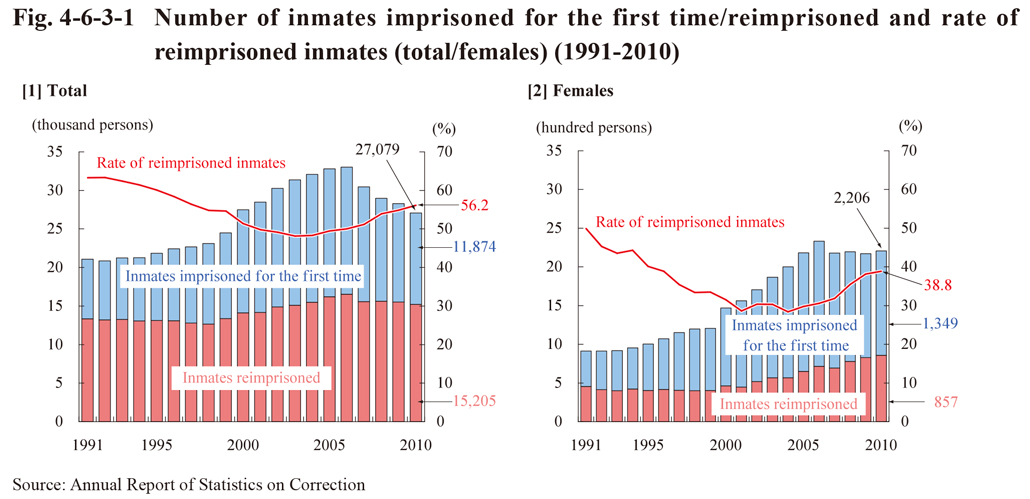
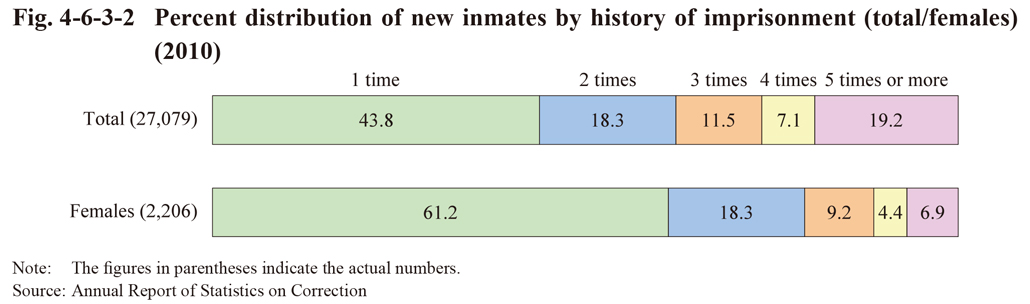 Fig. 4-6-3-2 Percent distribution of new inmates by history of imprisonment (total/females) (2010)
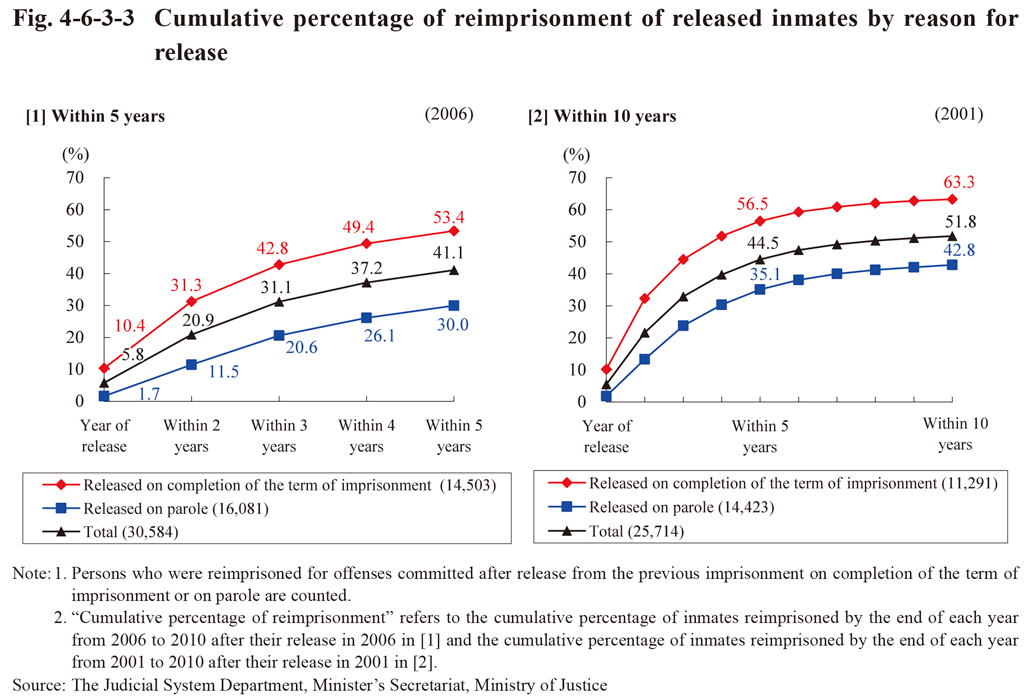 Fig. 4-6-3-3 Cumulative percentage of reimprisonment of released inmates by reason for release
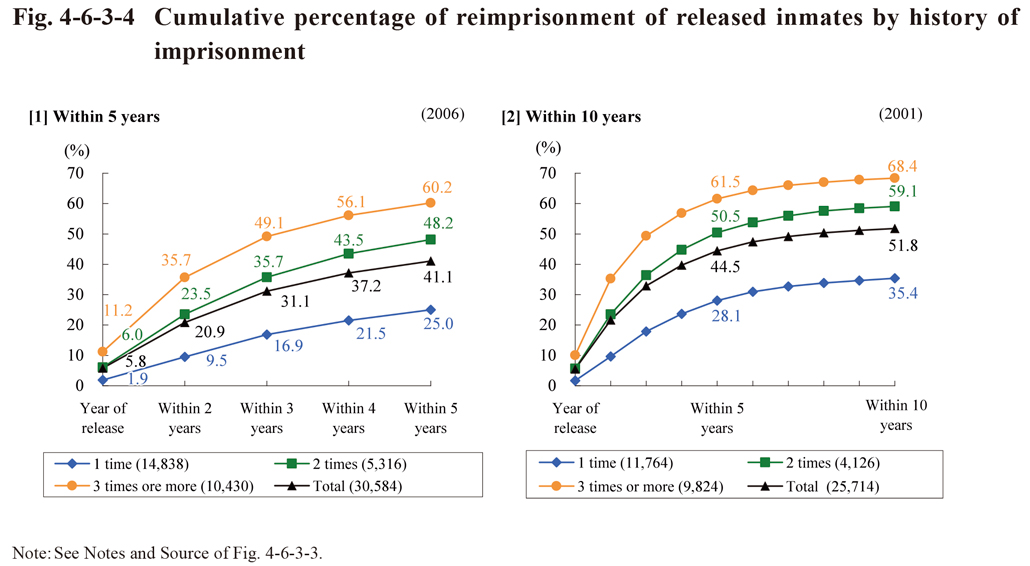 Fig. 4-6-3-4 Cumulative percentage of reimprisonment of released inmates by history of imprisonment
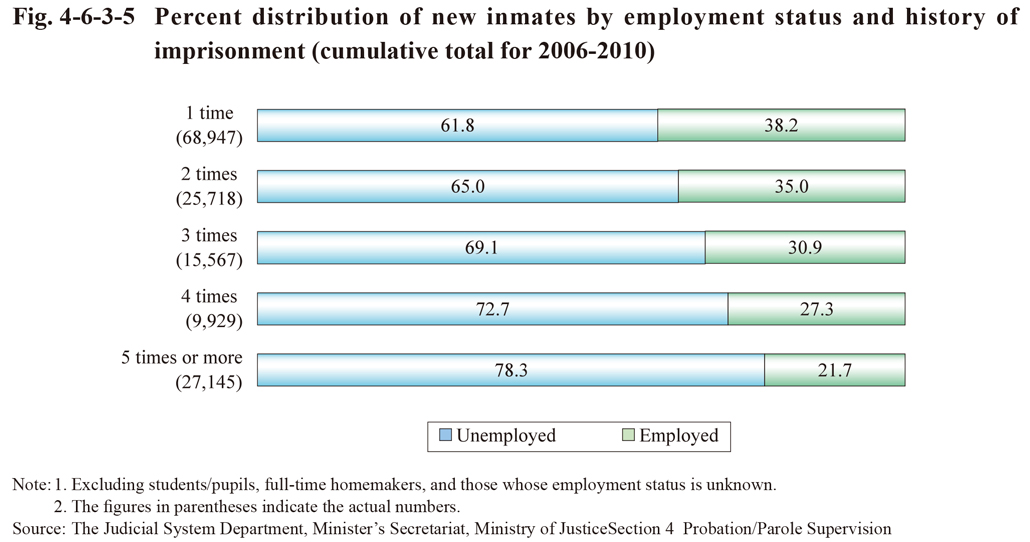
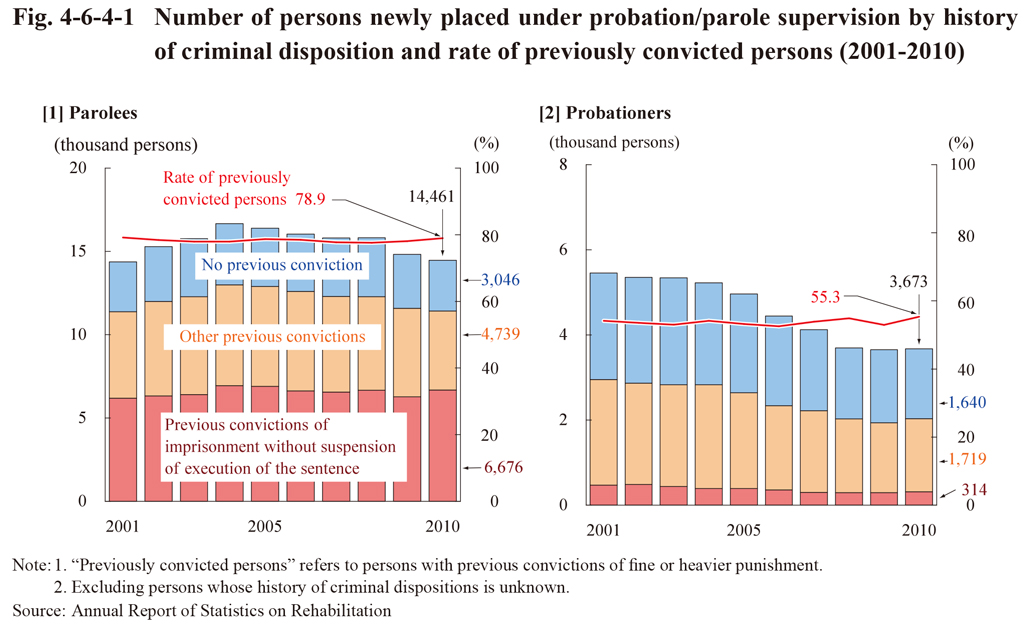
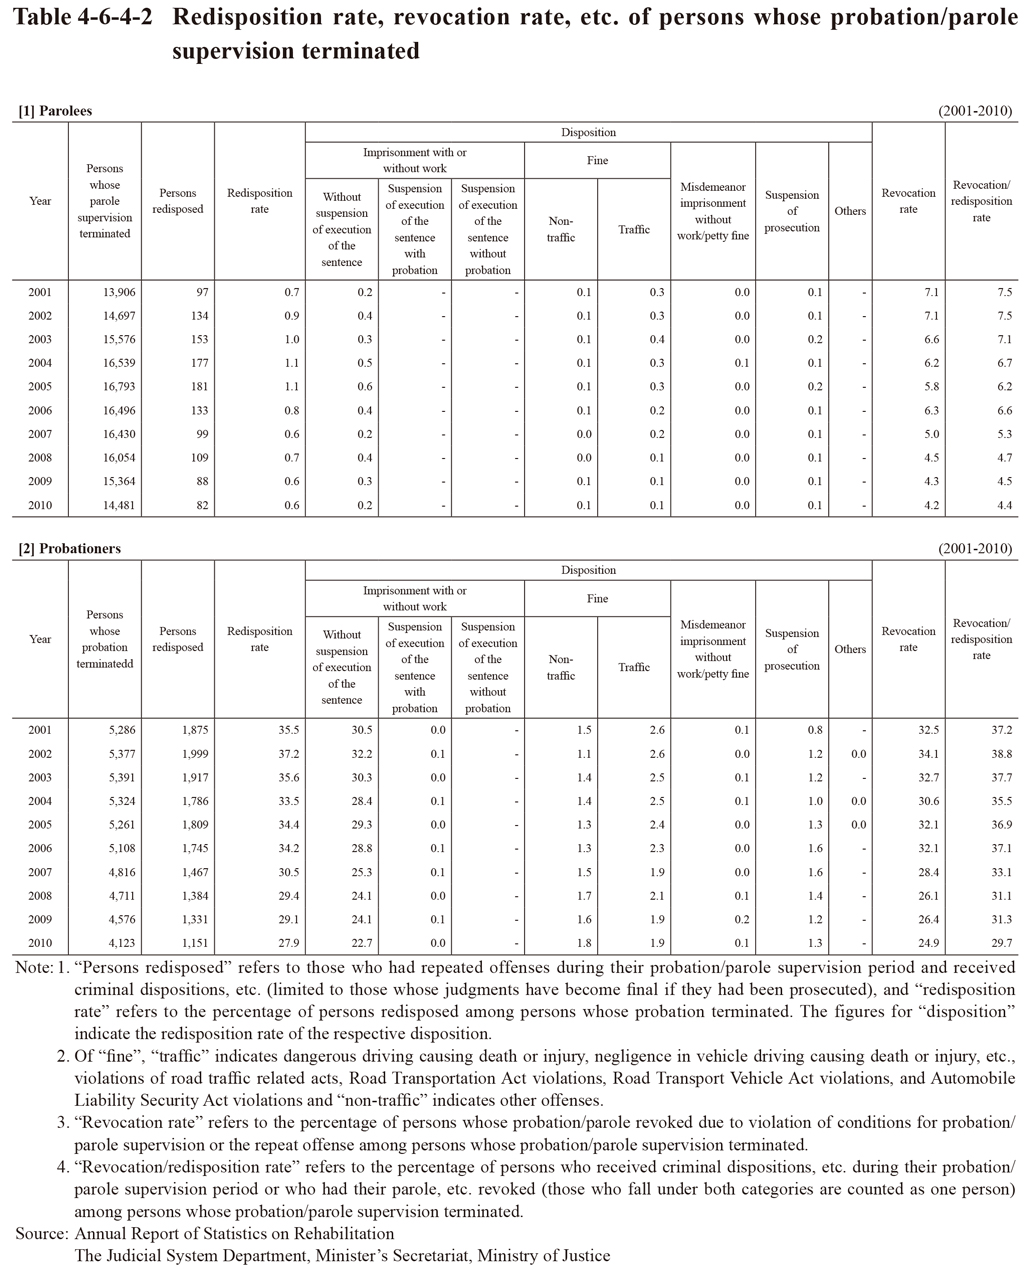
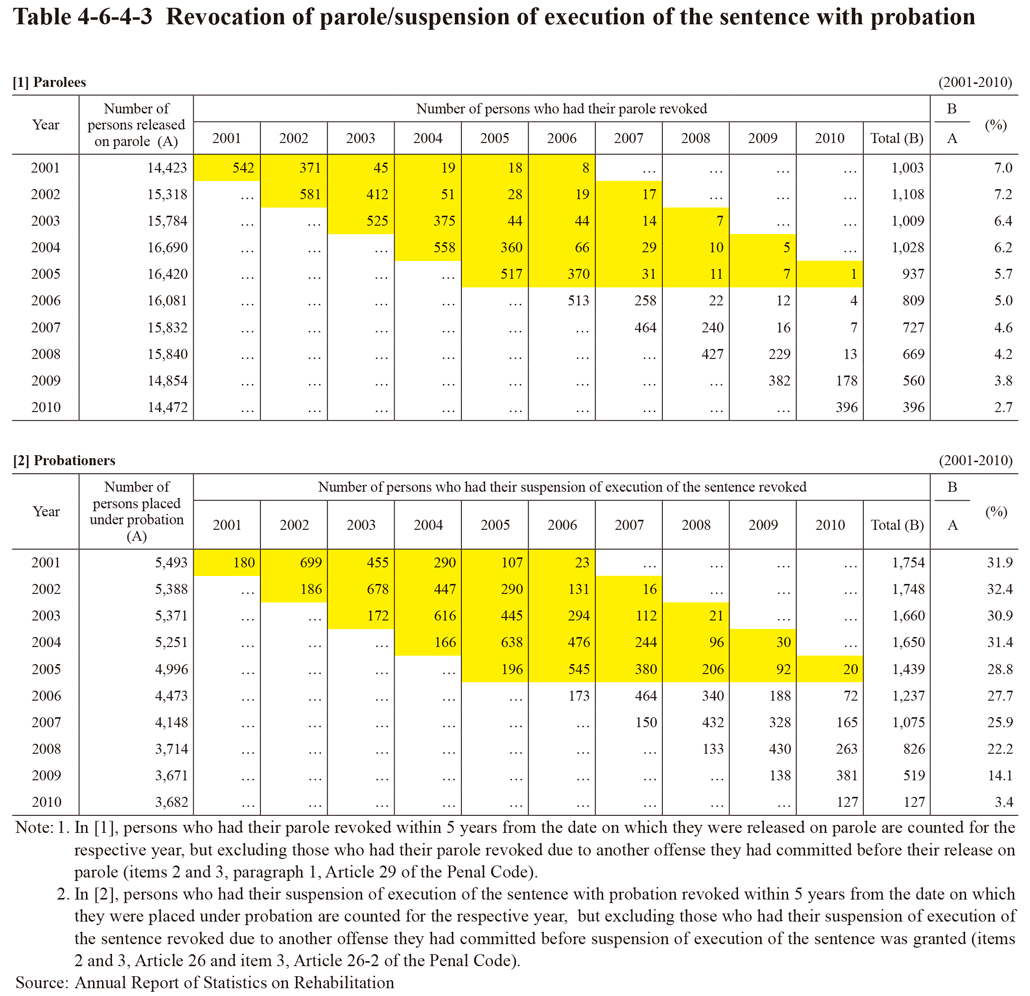 Table 4-6-4-3 Revocation of parole/suspension of execution of the sentence with probation
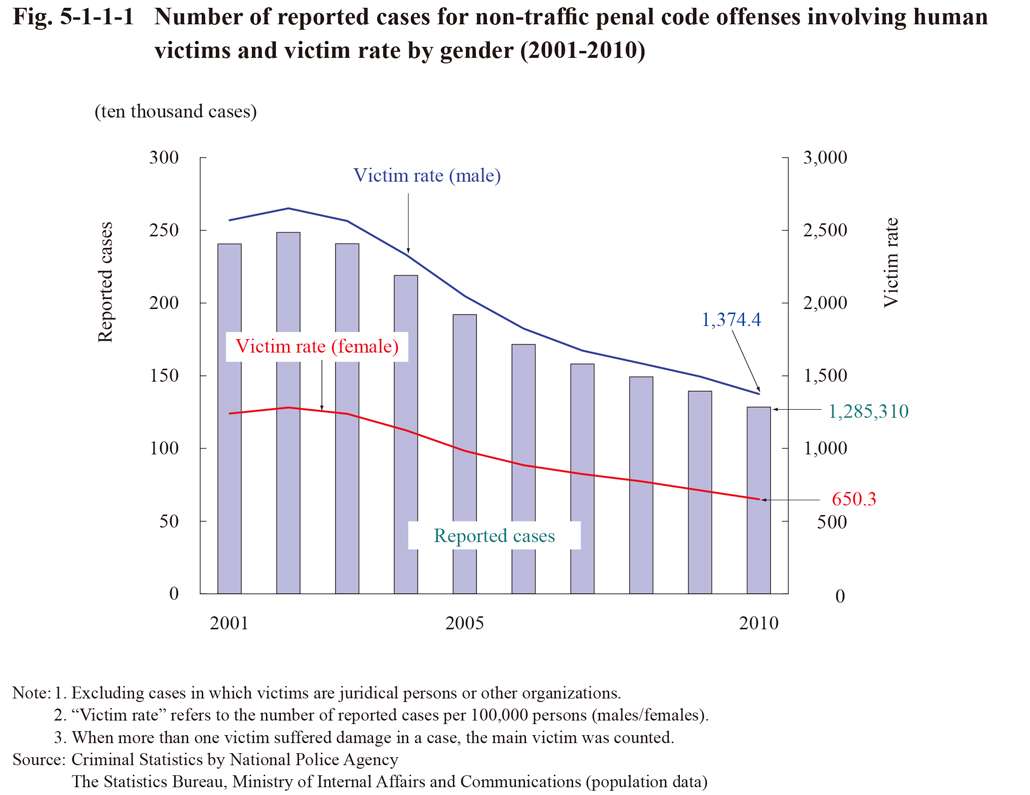
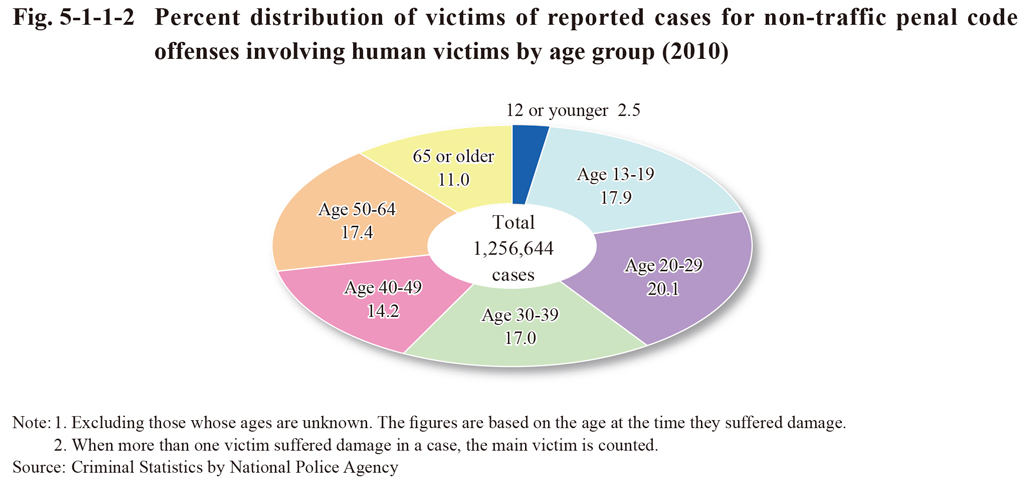
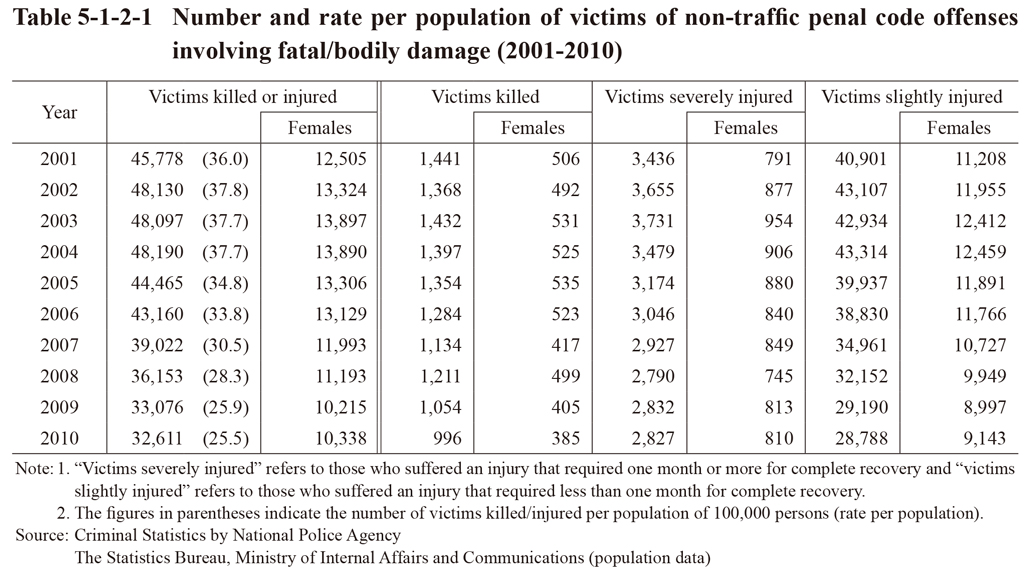
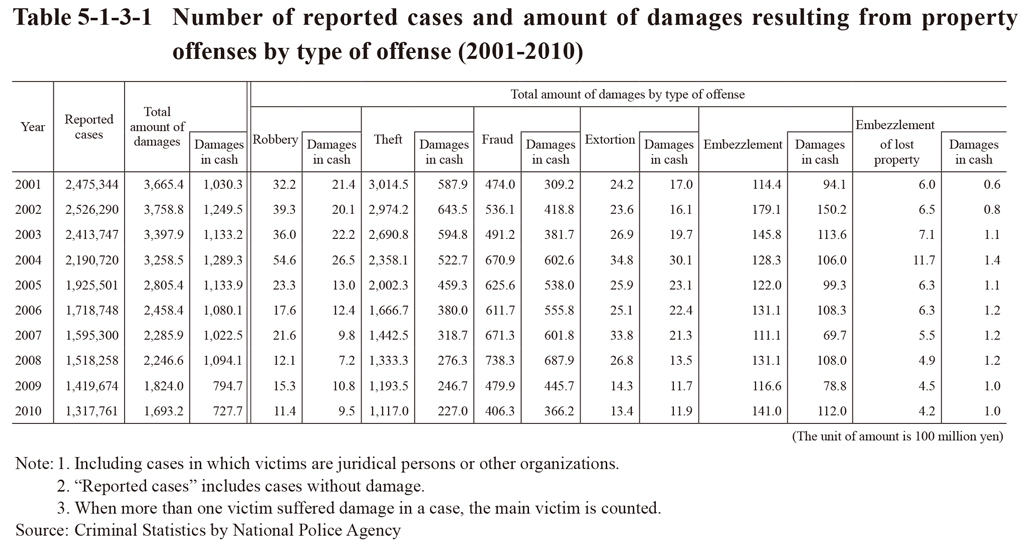
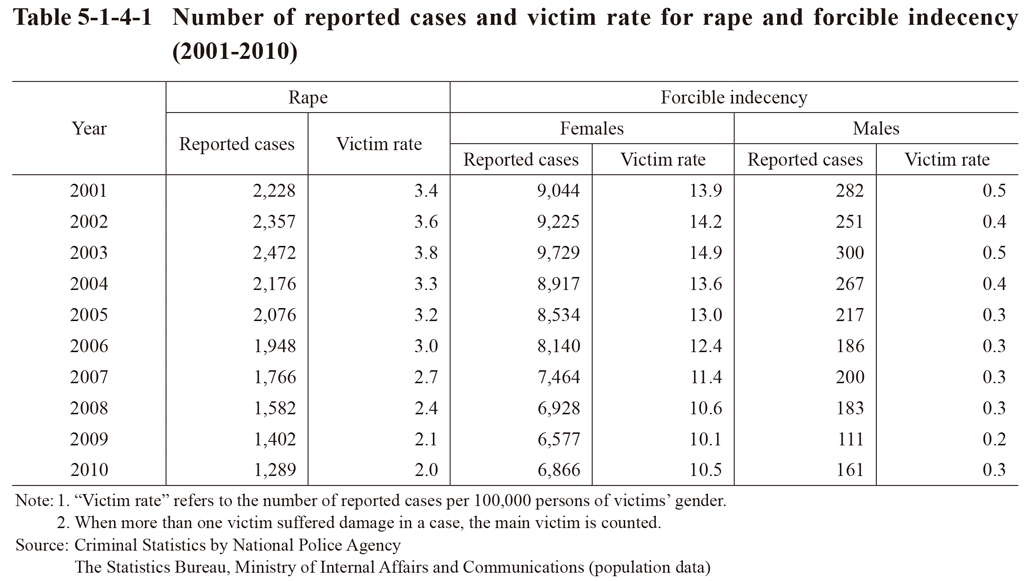 Table 5-1-4-1 Number of reported cases and victim rate for rape and forcible indecency (2001-2010)
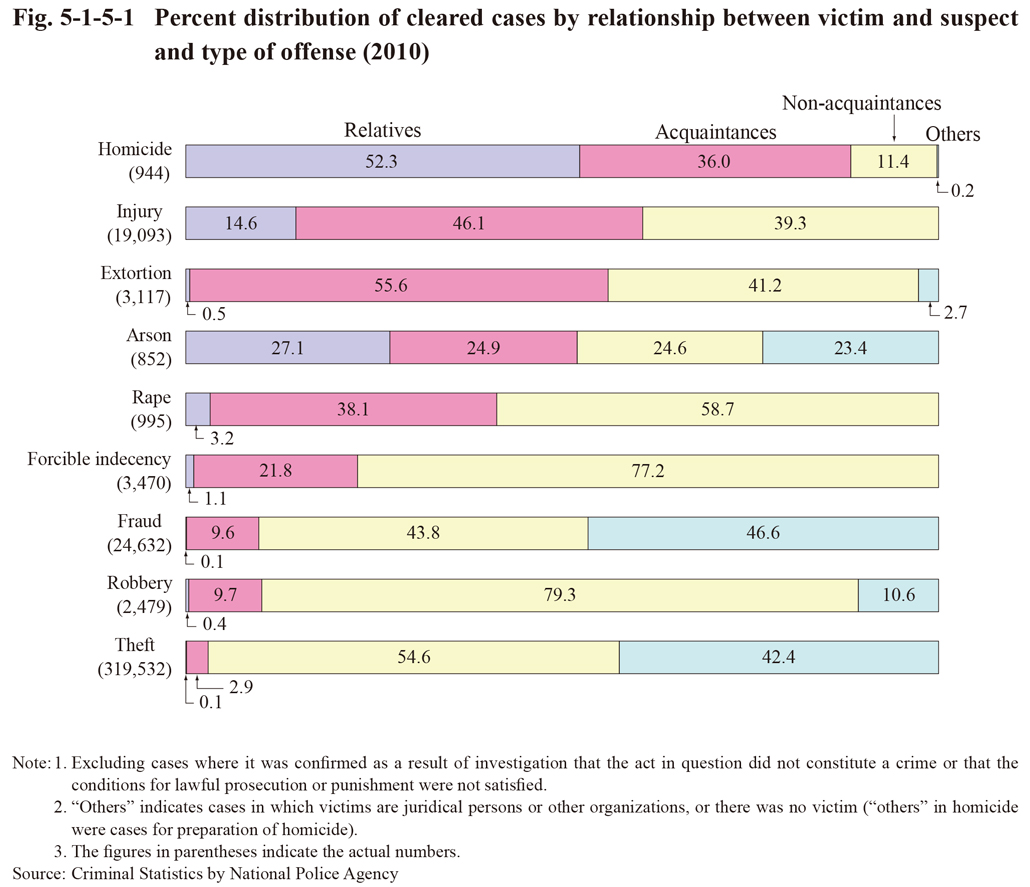
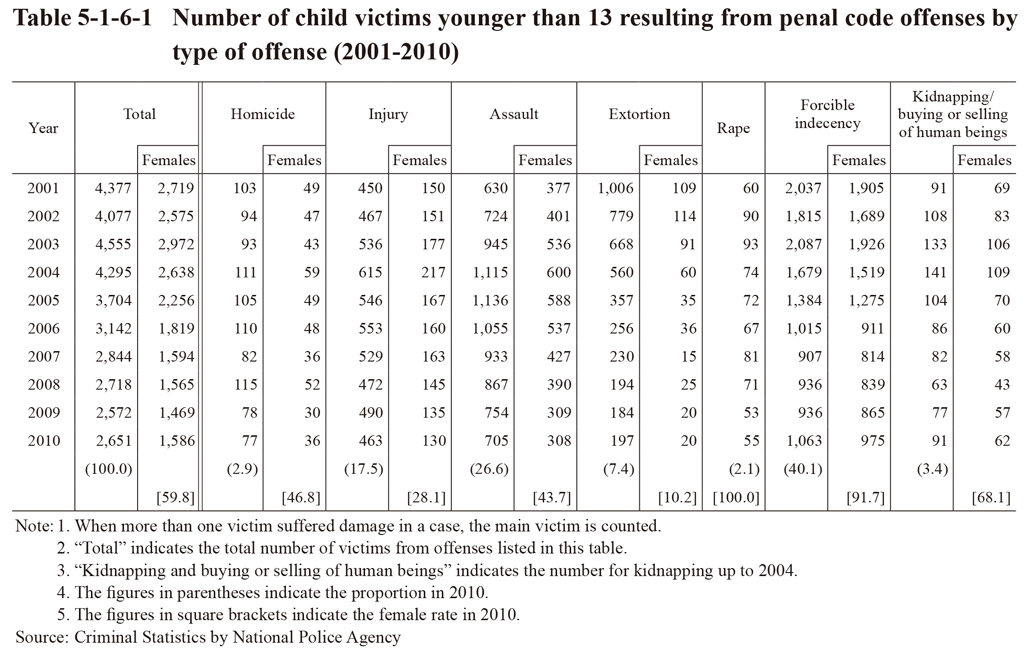
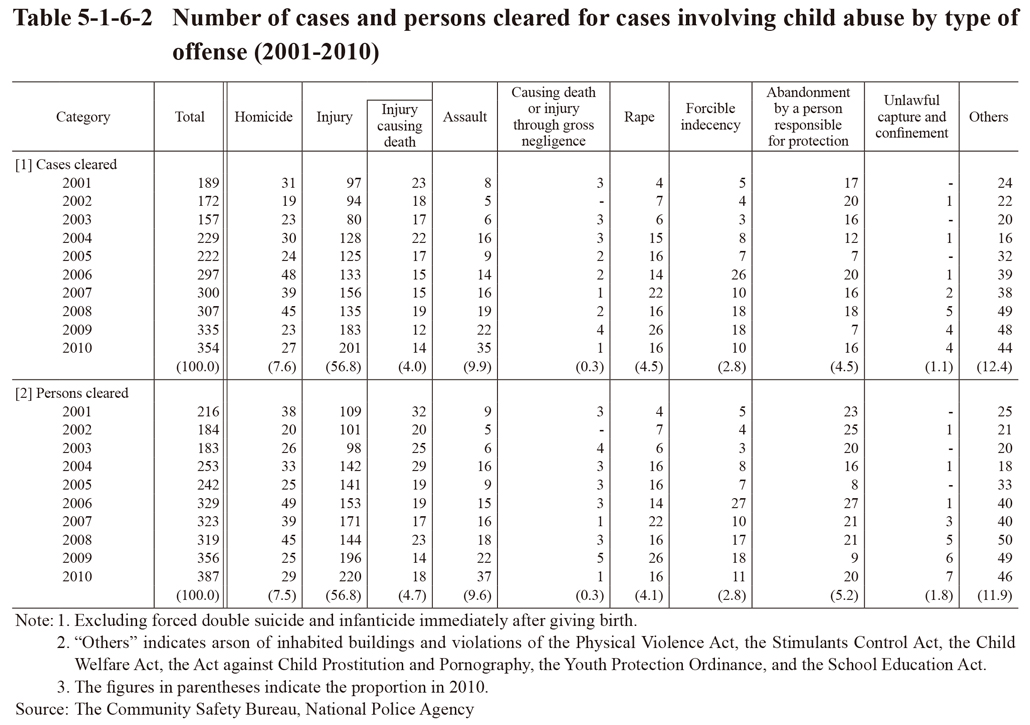
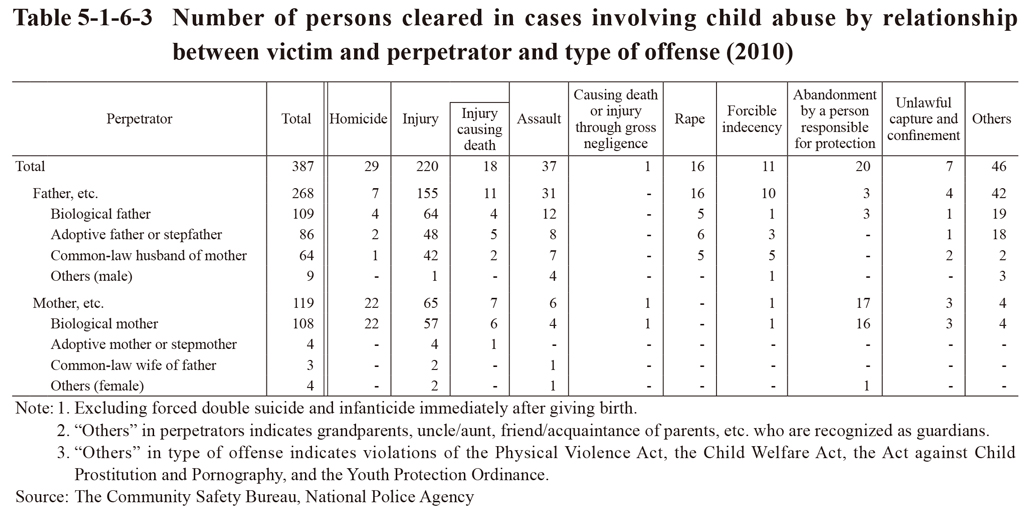
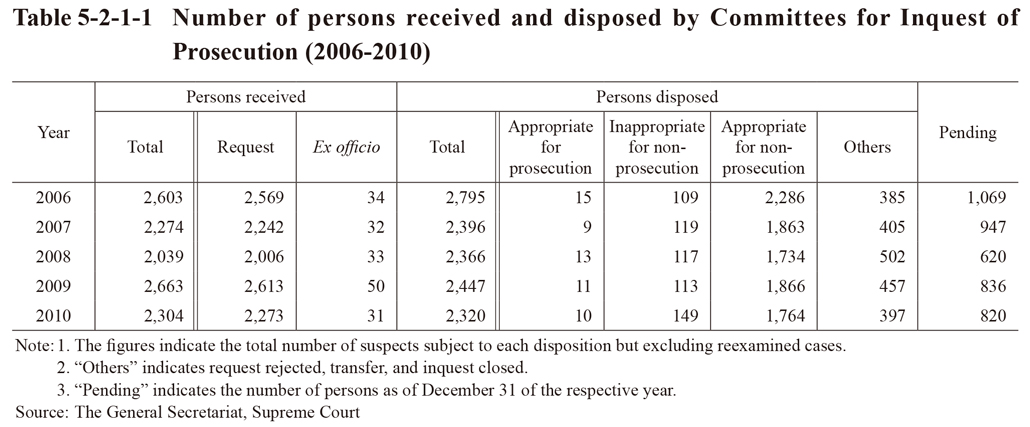
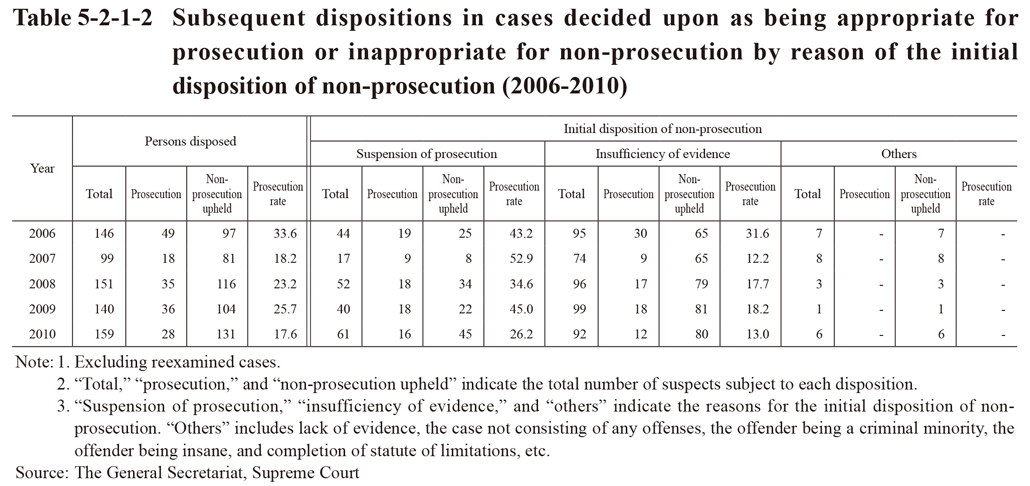
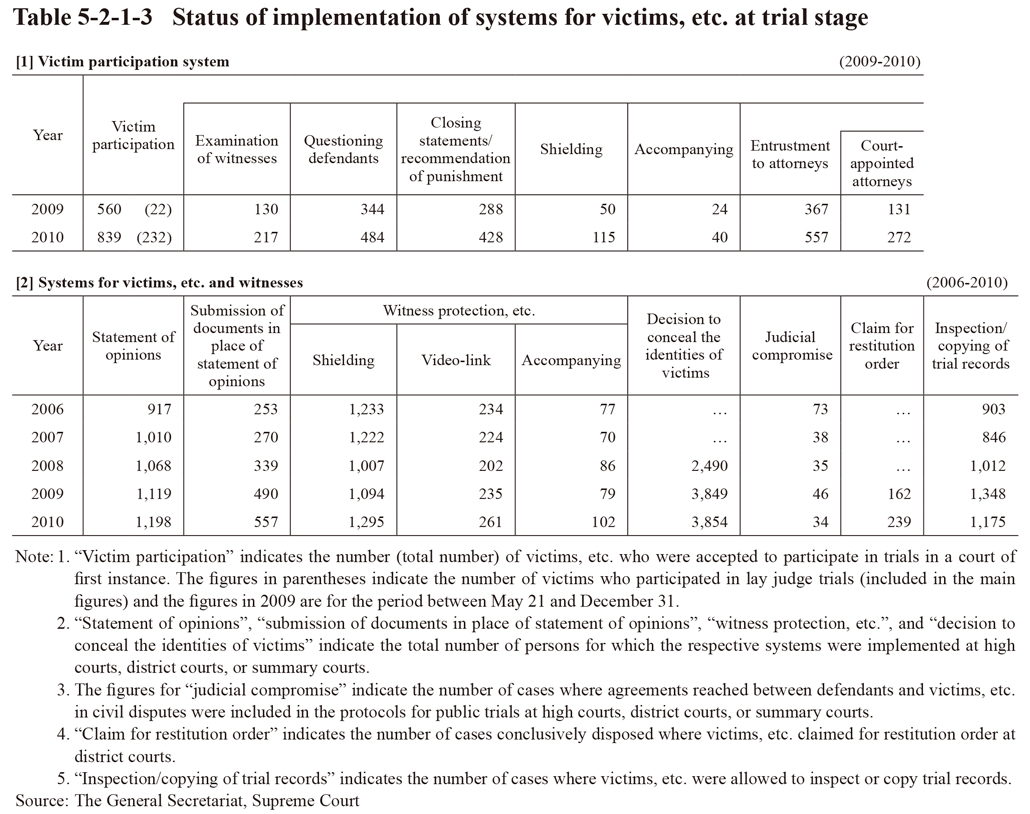 Table 5-2-1-3 Status of implementation of systems for victims, etc. at trial stage
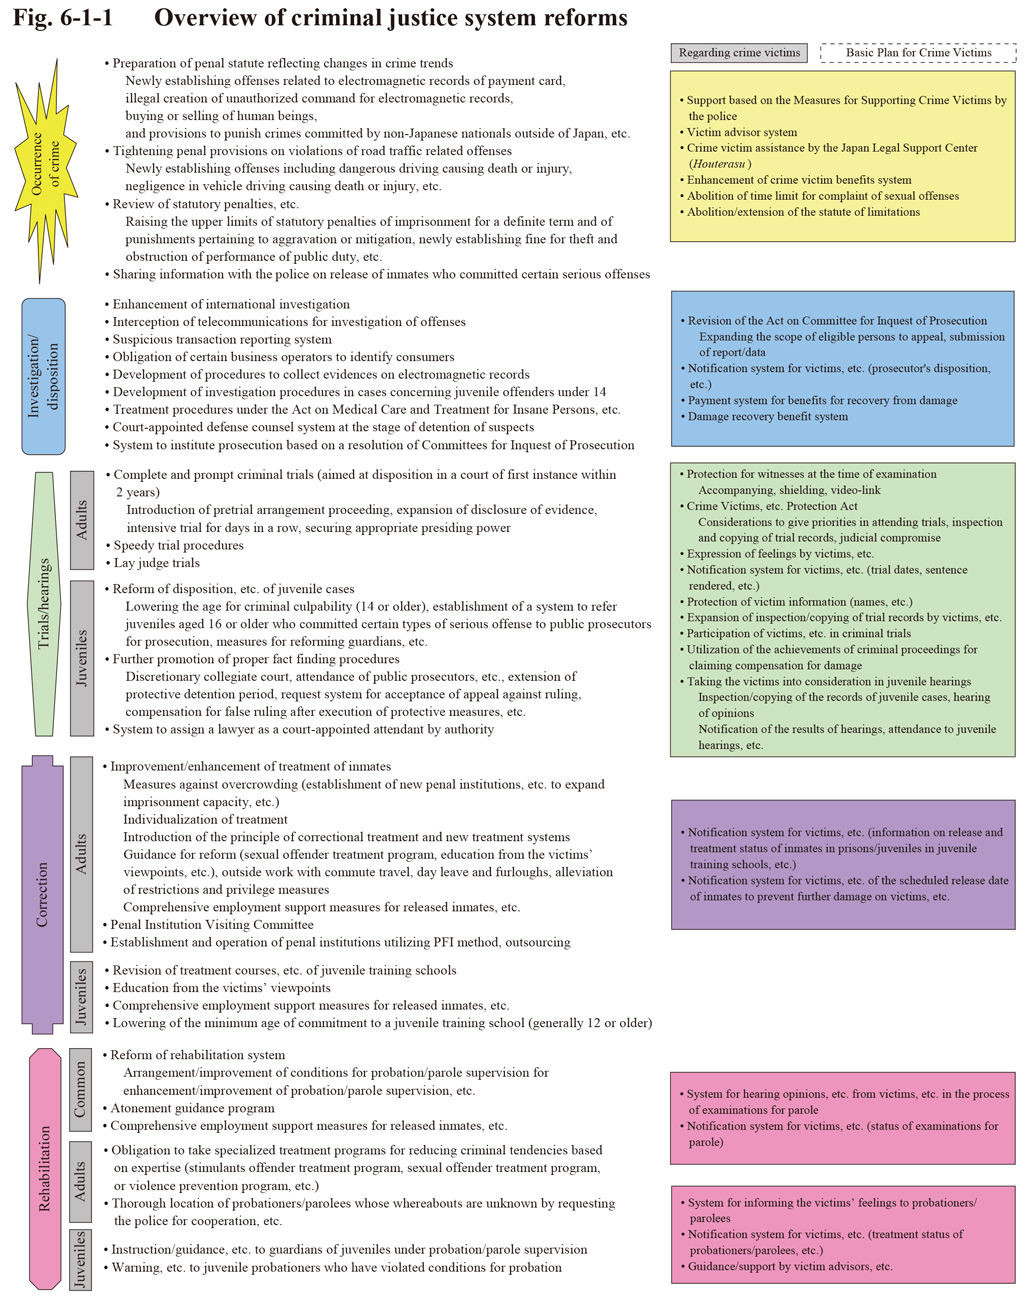 Fig. 6-1-1 Overview of criminal justice system reforms
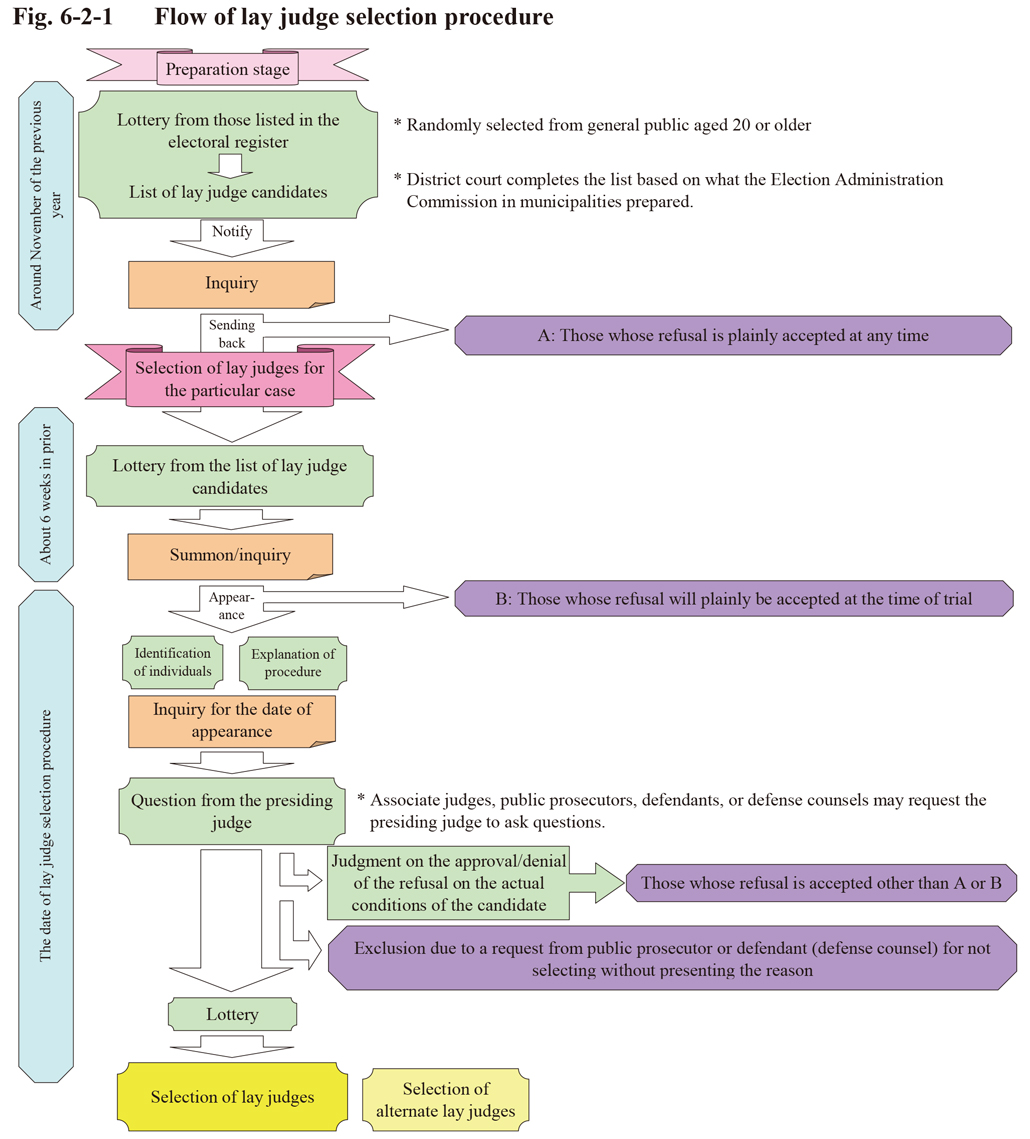 Fig. 6-2-1 Flow of lay judge selection procedure
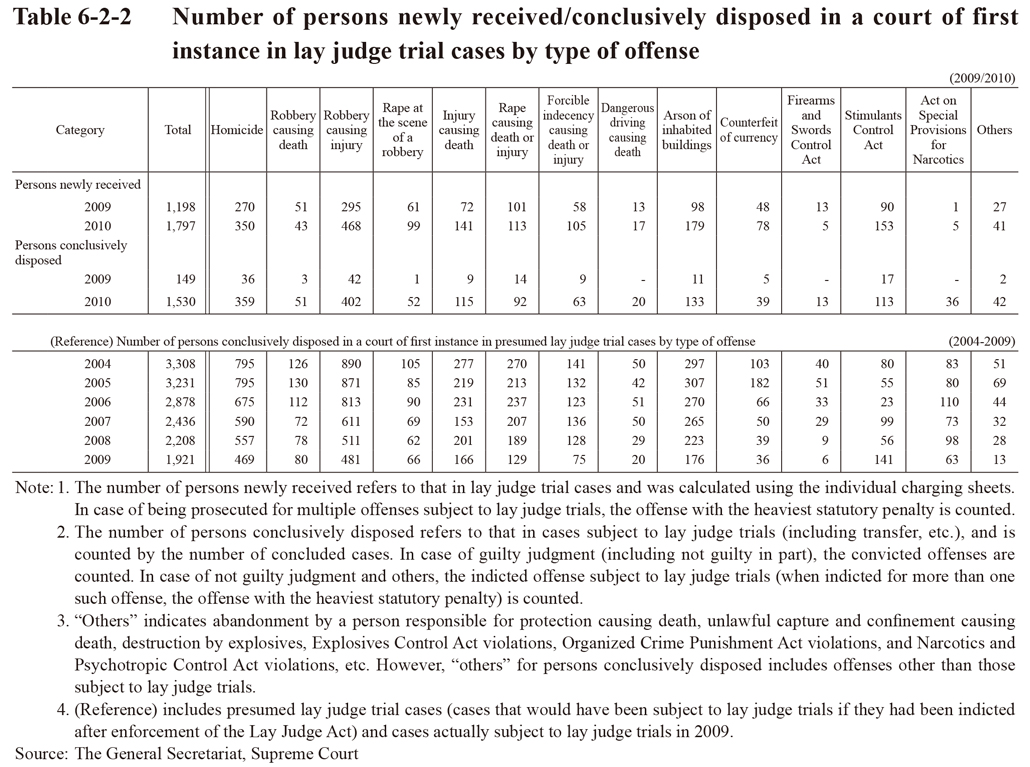
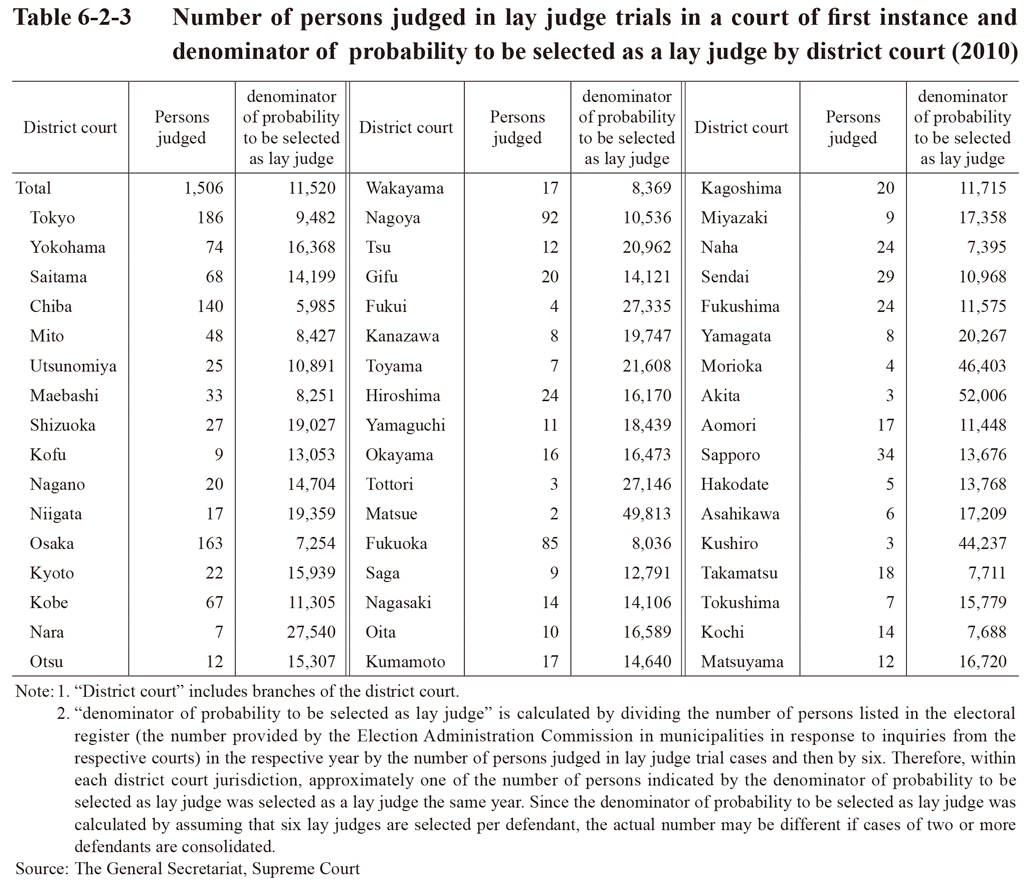
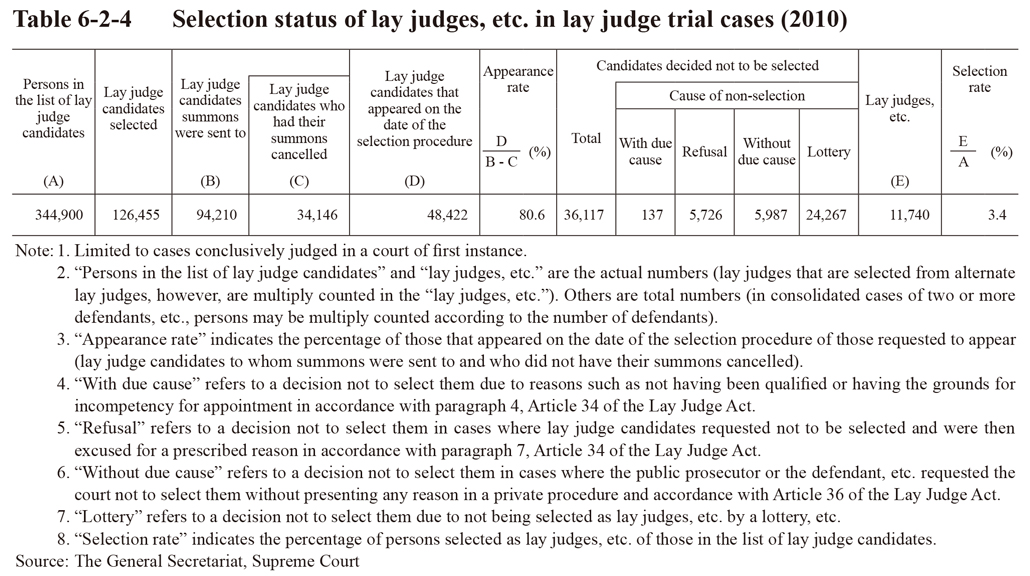 Table 6-2-4 Selection status of lay judges, etc. in lay judge trial cases (2010)
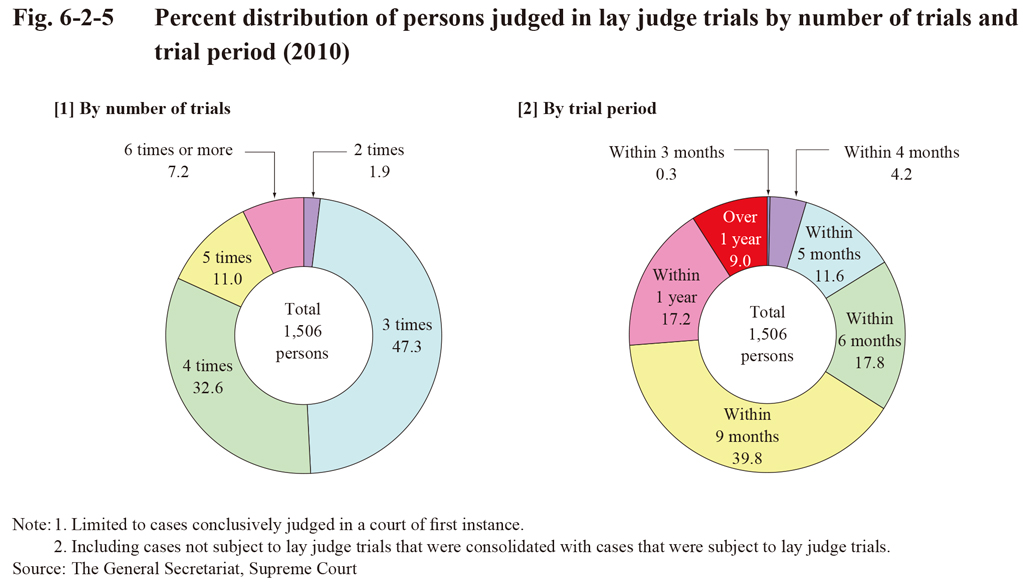
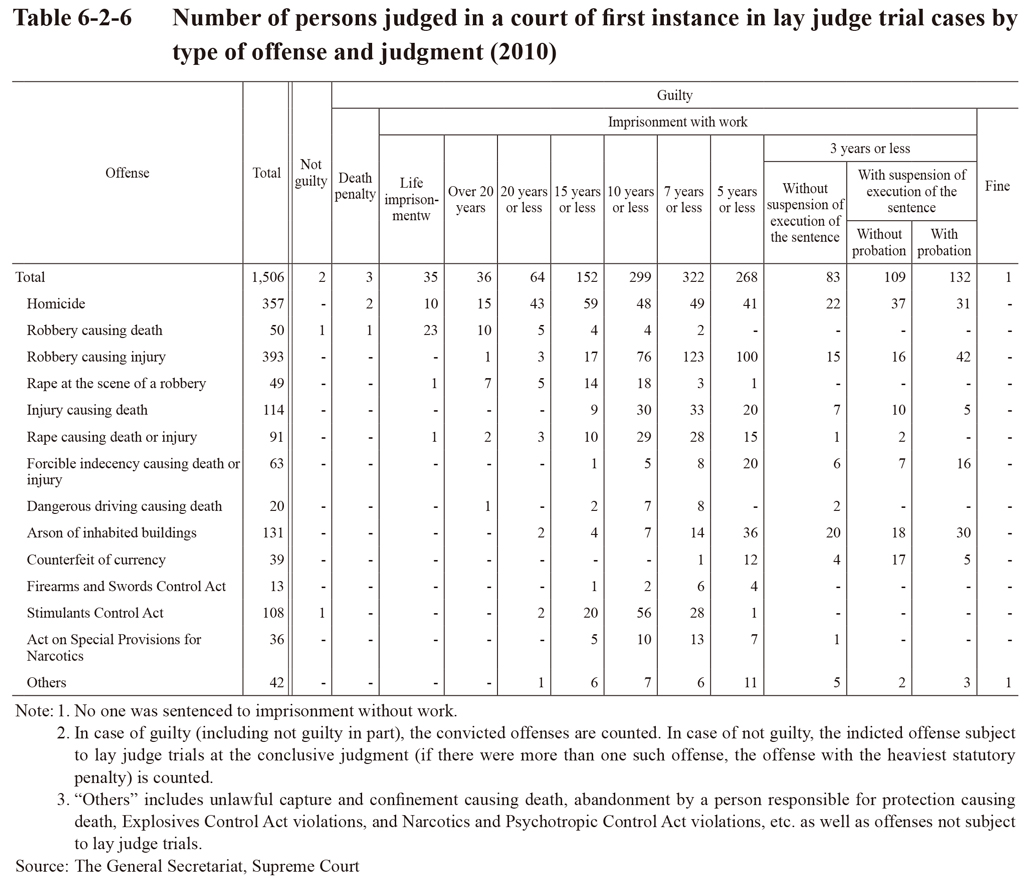
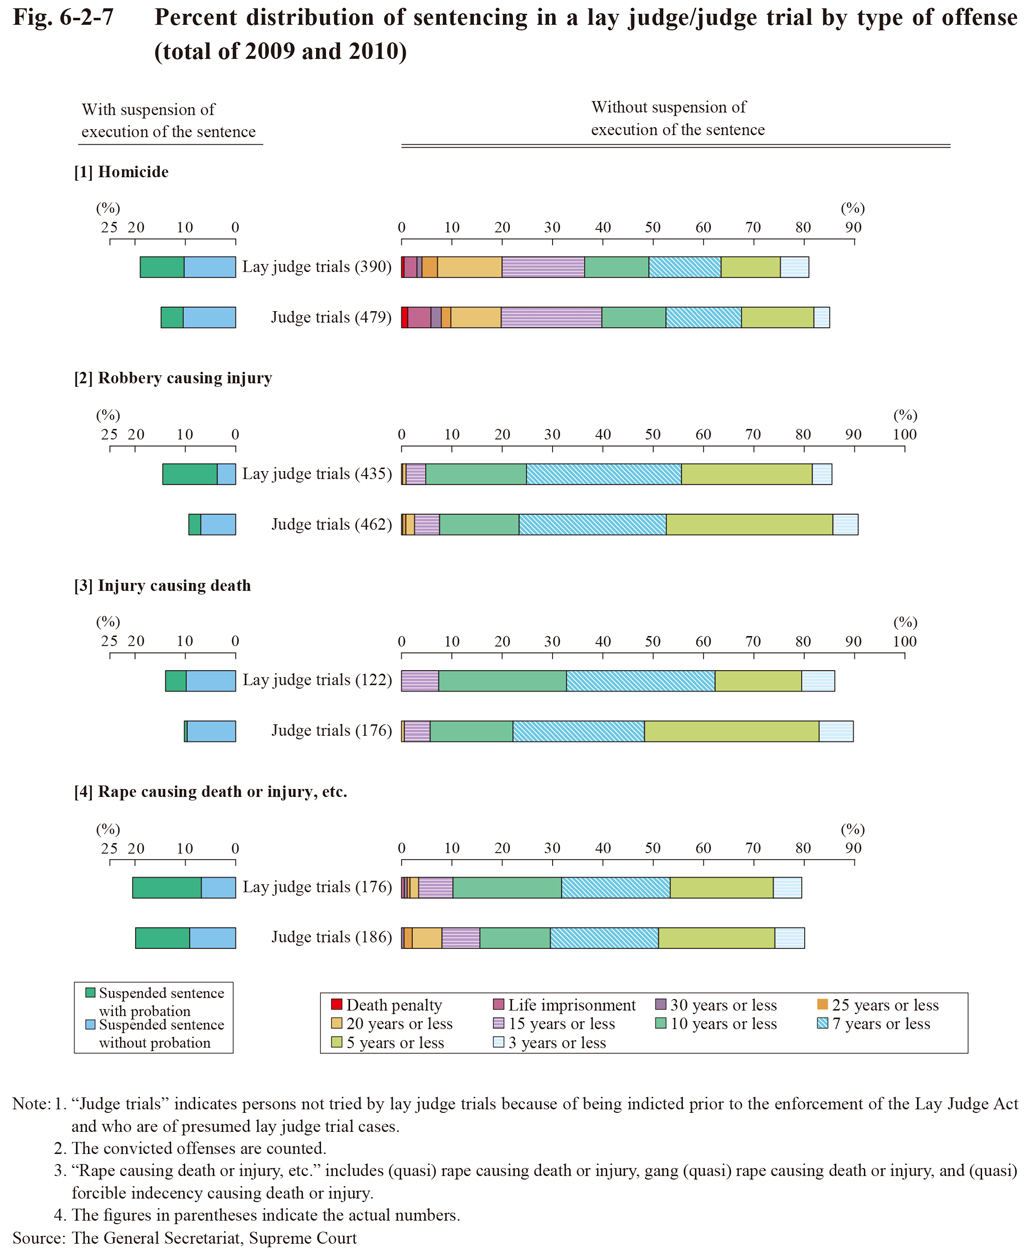
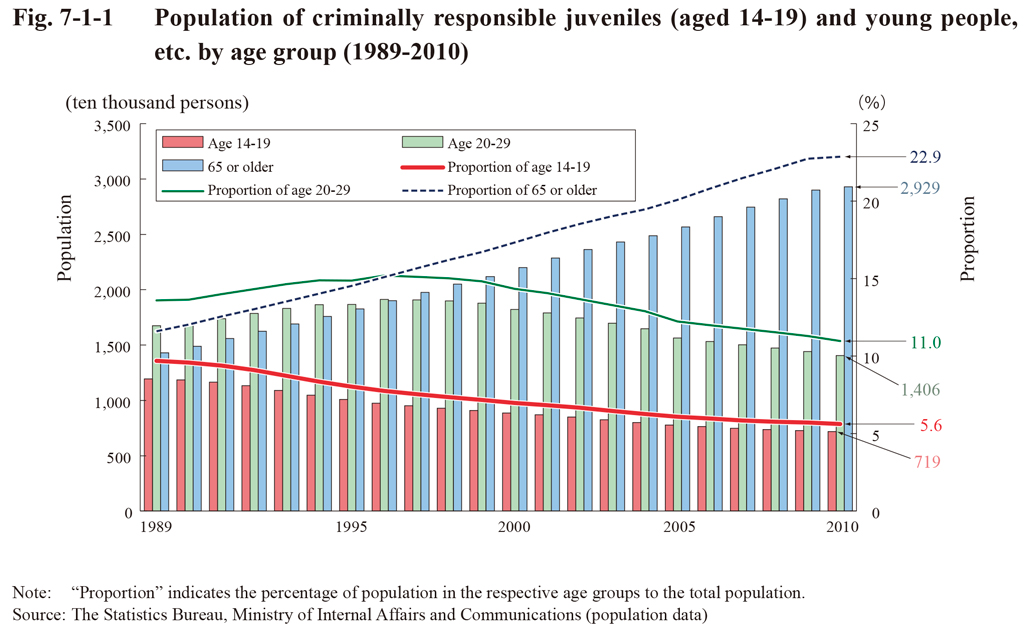
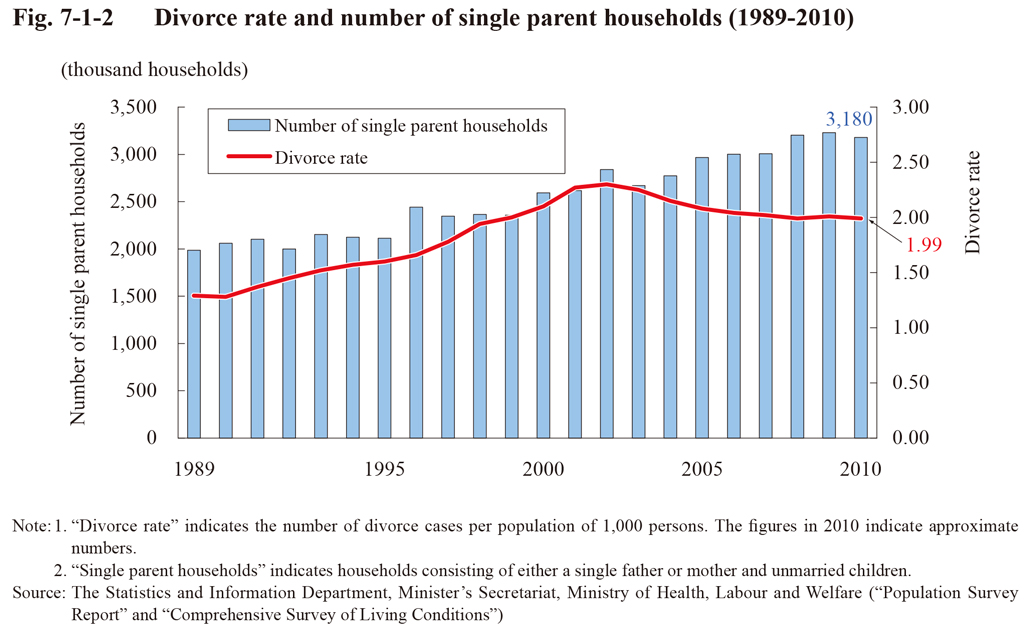 Fig. 7-1-2 Divorce rate and number of single parent households (1989-2010)
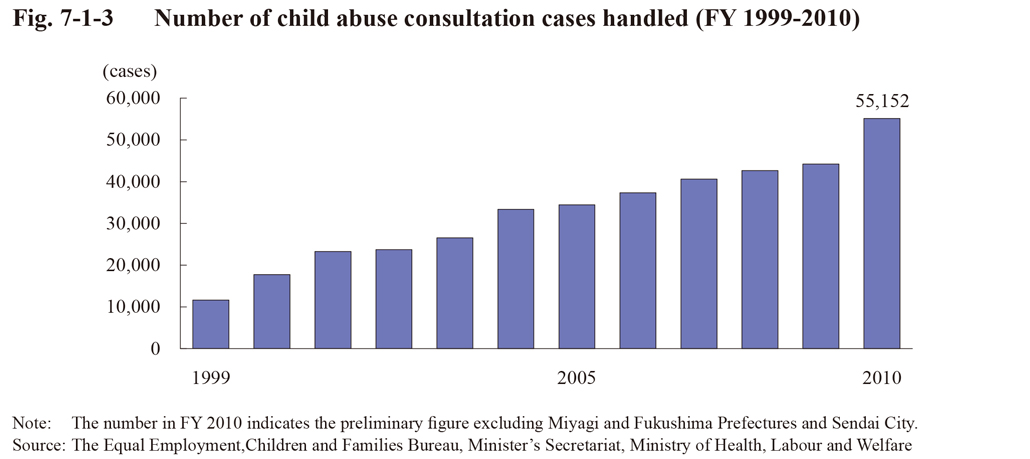 Fig. 7-1-3 Number of child abuse consultation cases handled (FY 1999-2010)
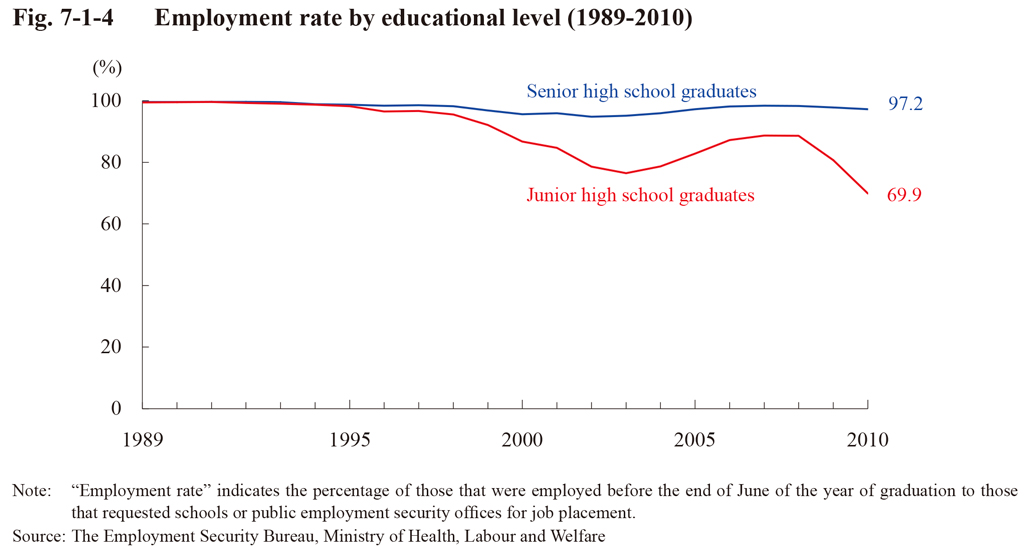 Fig. 7-1-4 Employment rate by educational level (1989-2010)
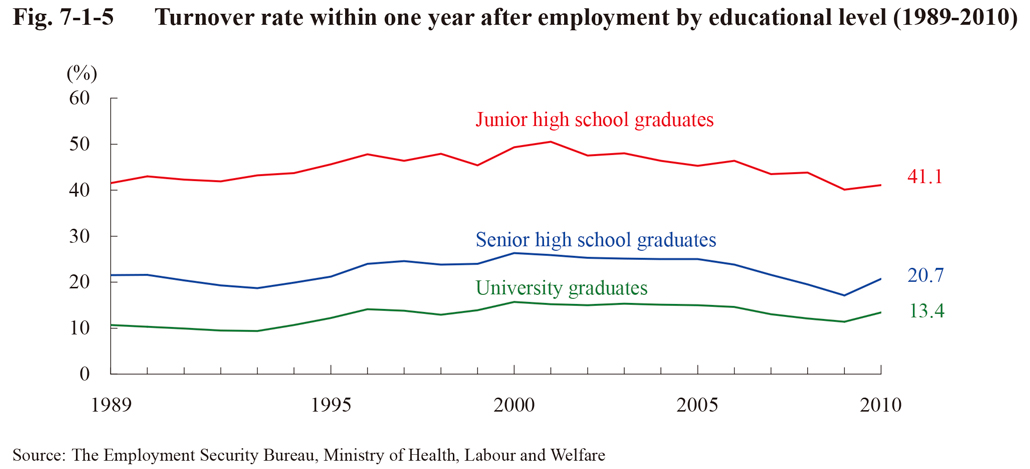 Fig. 7-1-5 Turnover rate within one year after employment by educational level (1989-2010)
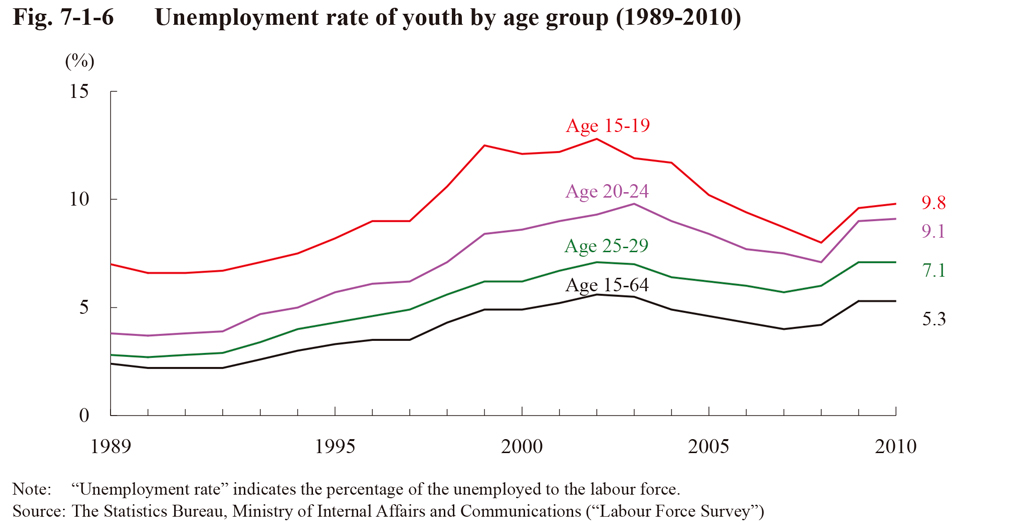 Fig. 7-1-6 Unemployment rate of youth by age group (1989-2010)
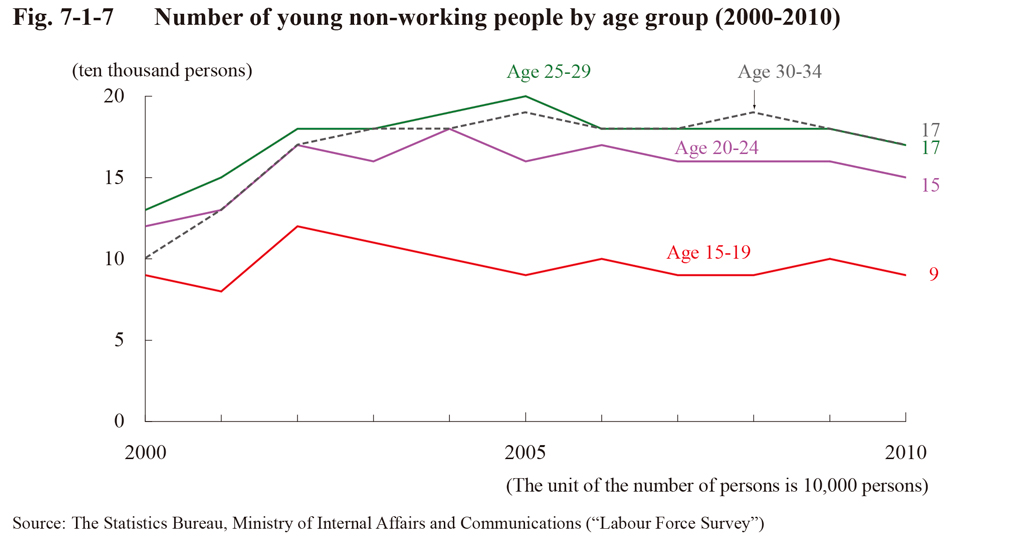 Fig. 7-1-7 Number of young non-working people by age group (2000-2010)
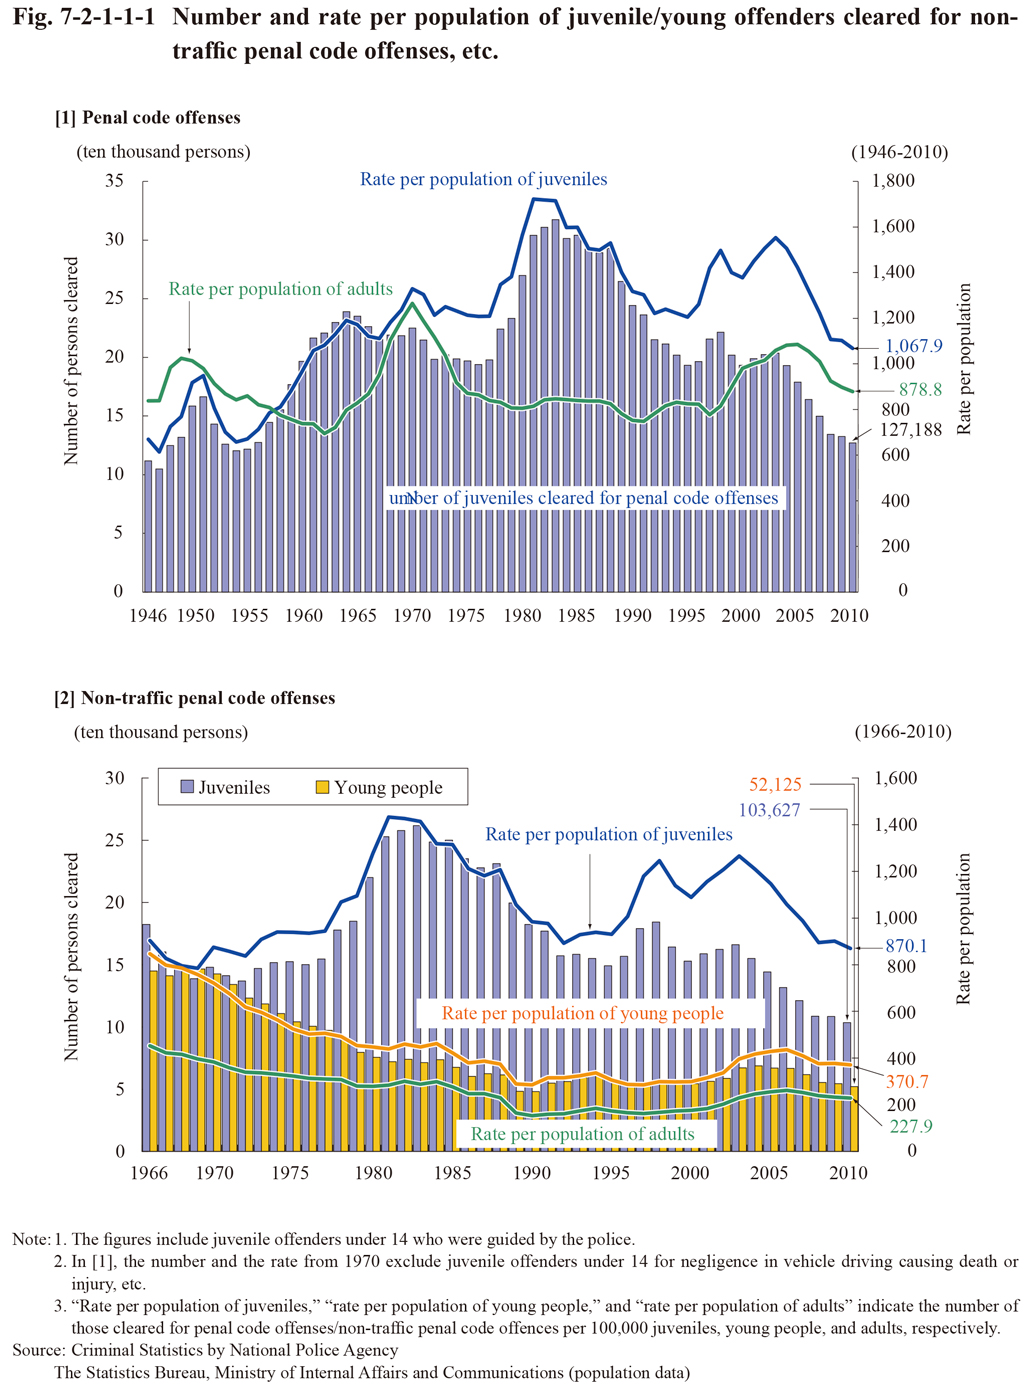
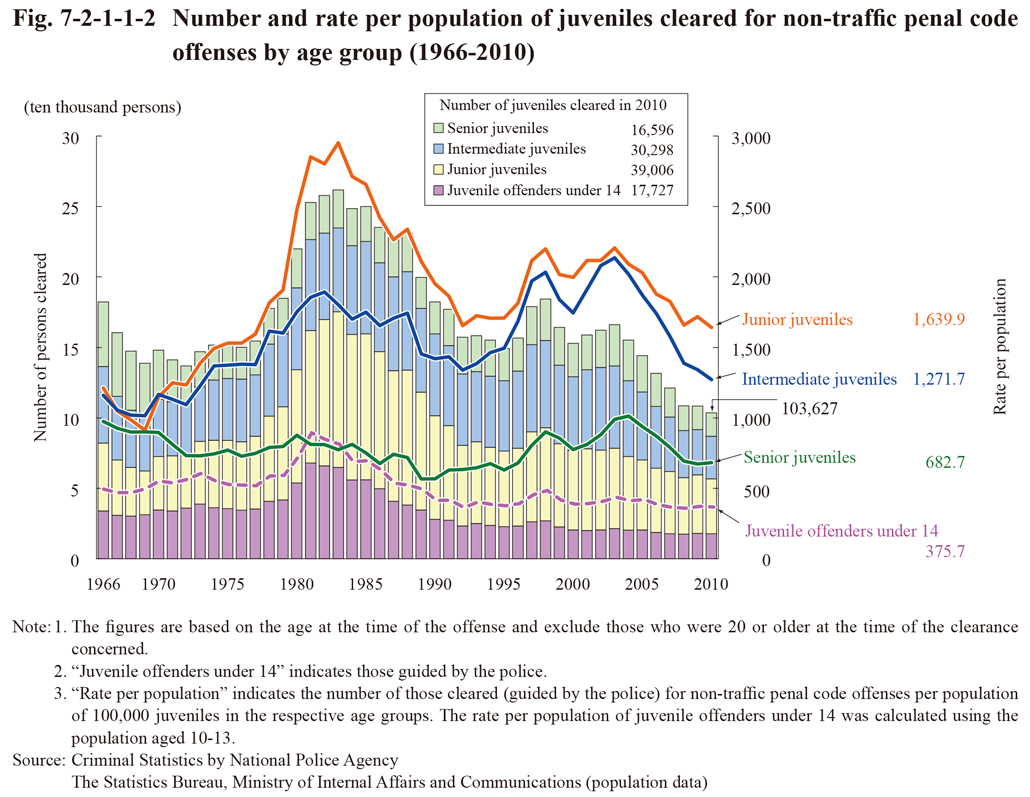
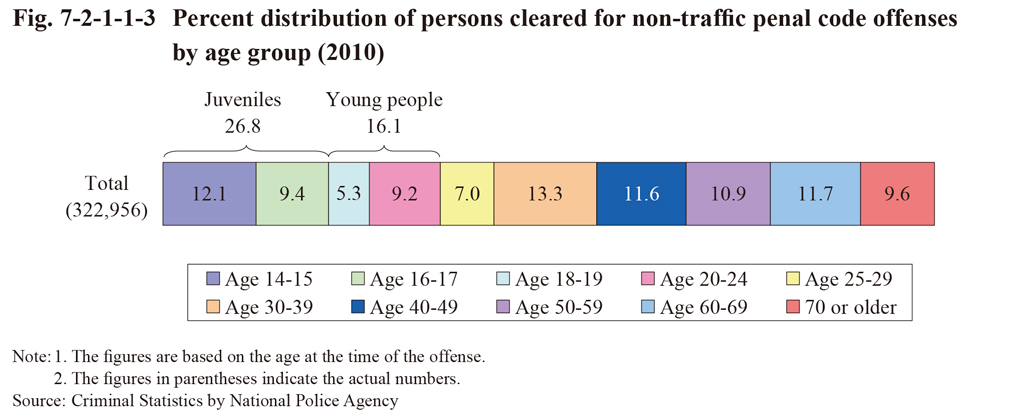
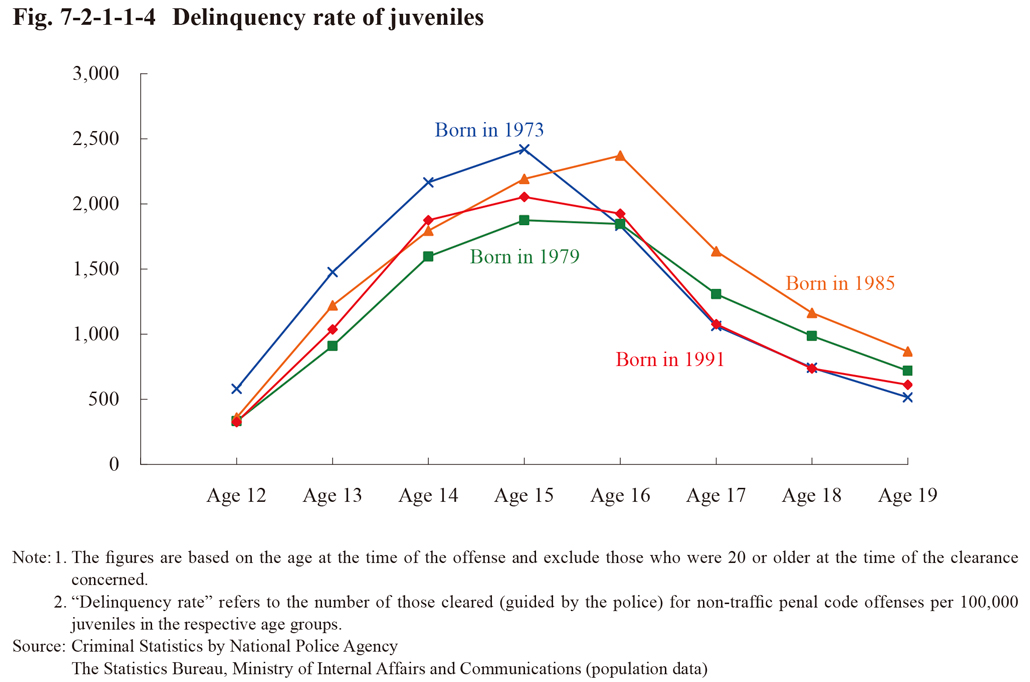 Fig. 7-2-1-1-4 Delinquency rate of juveniles
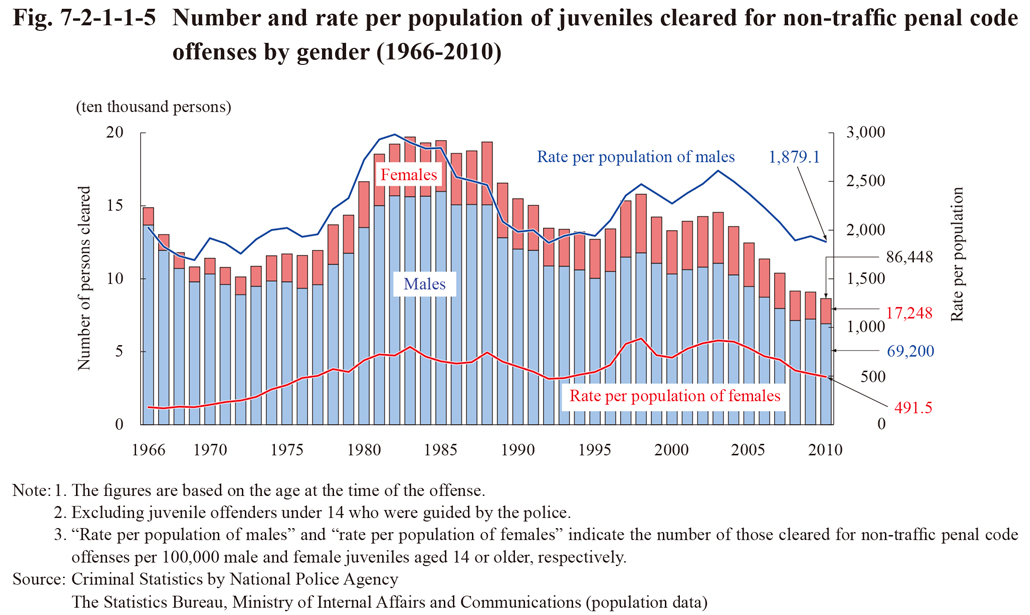
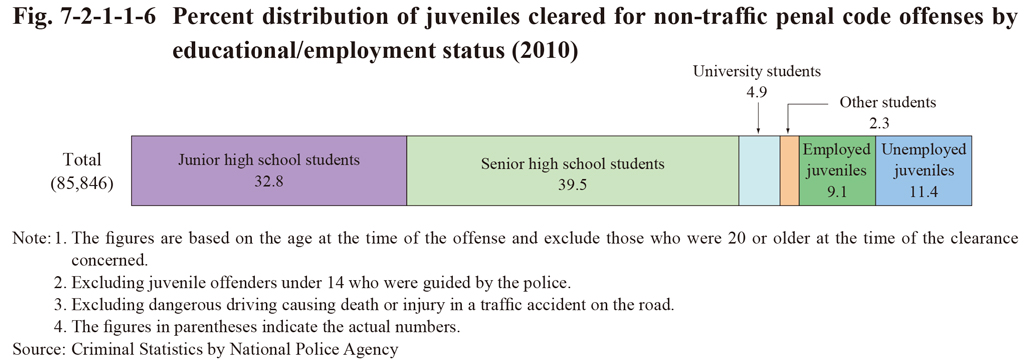
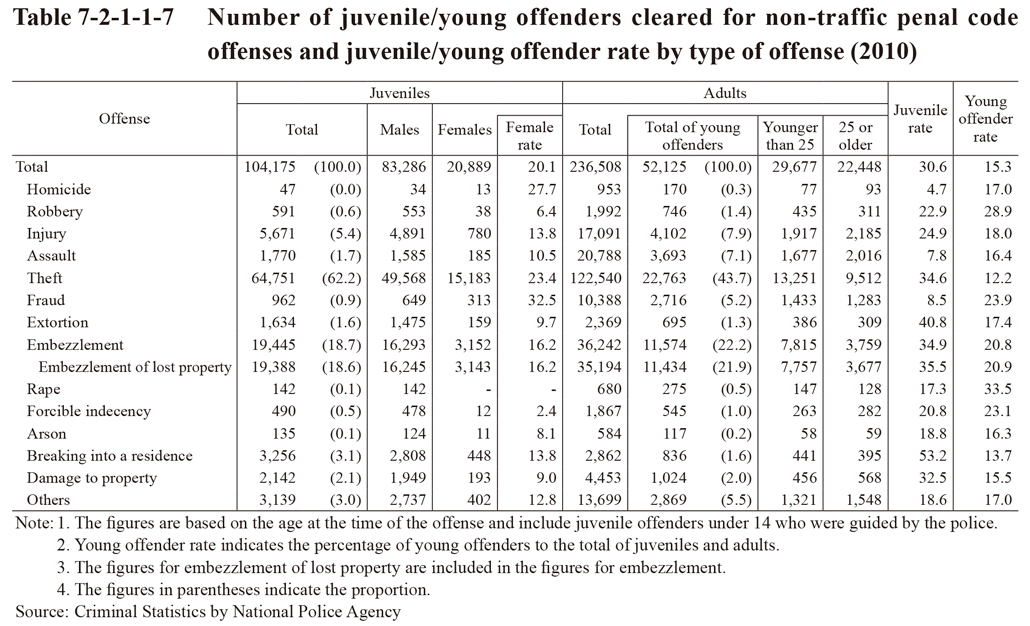
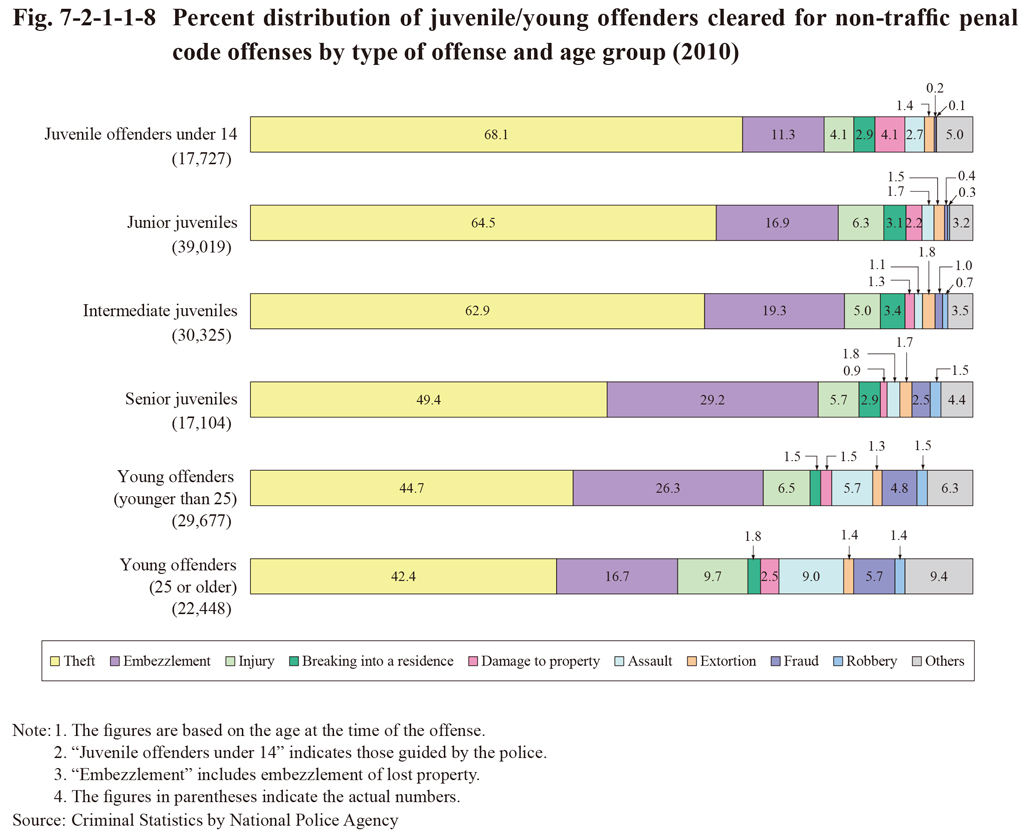
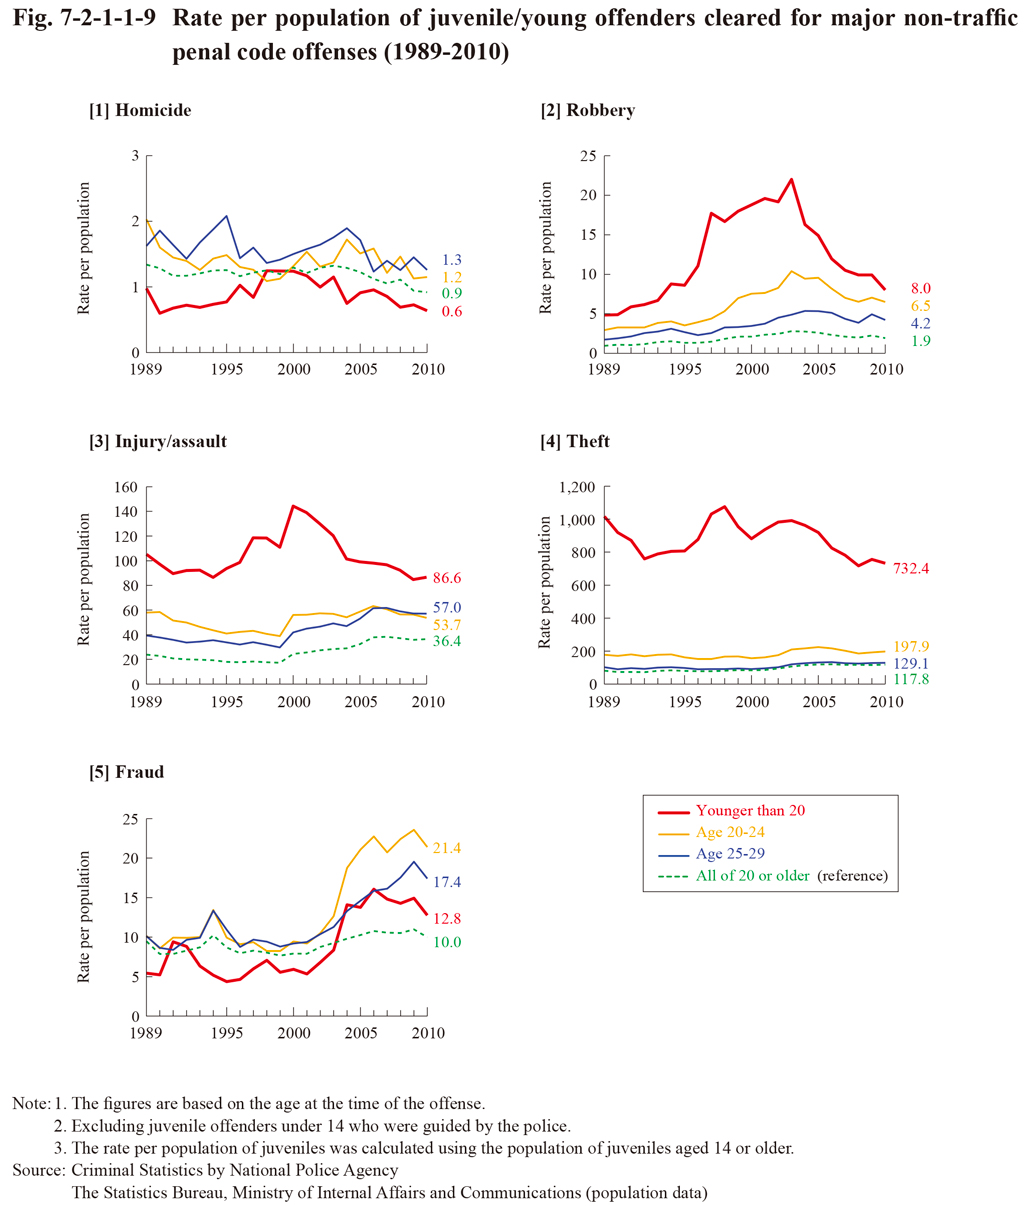
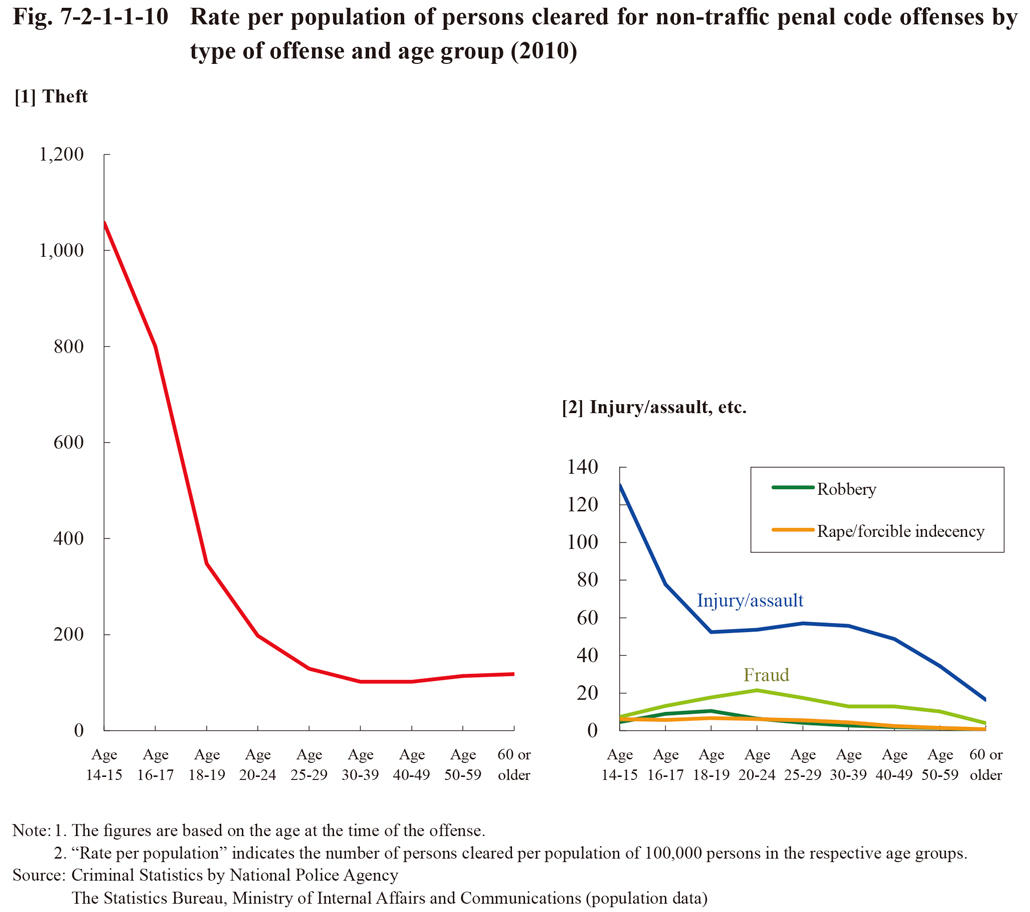
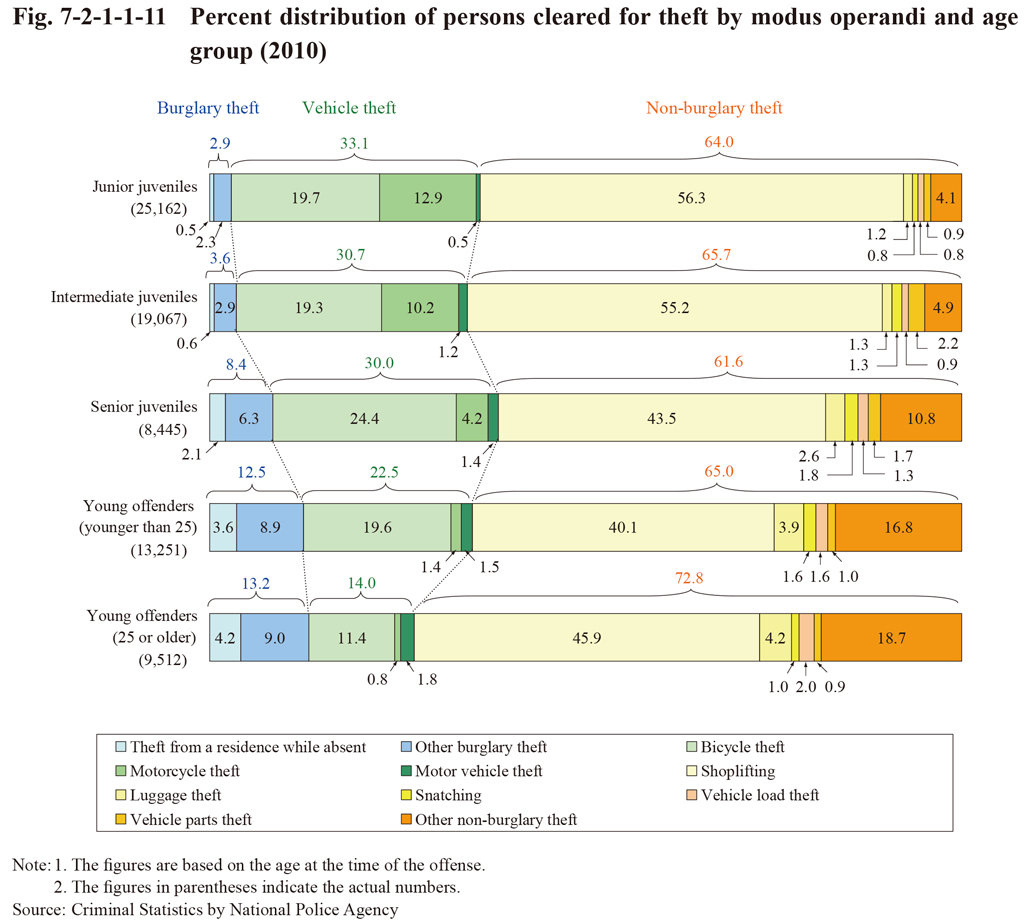
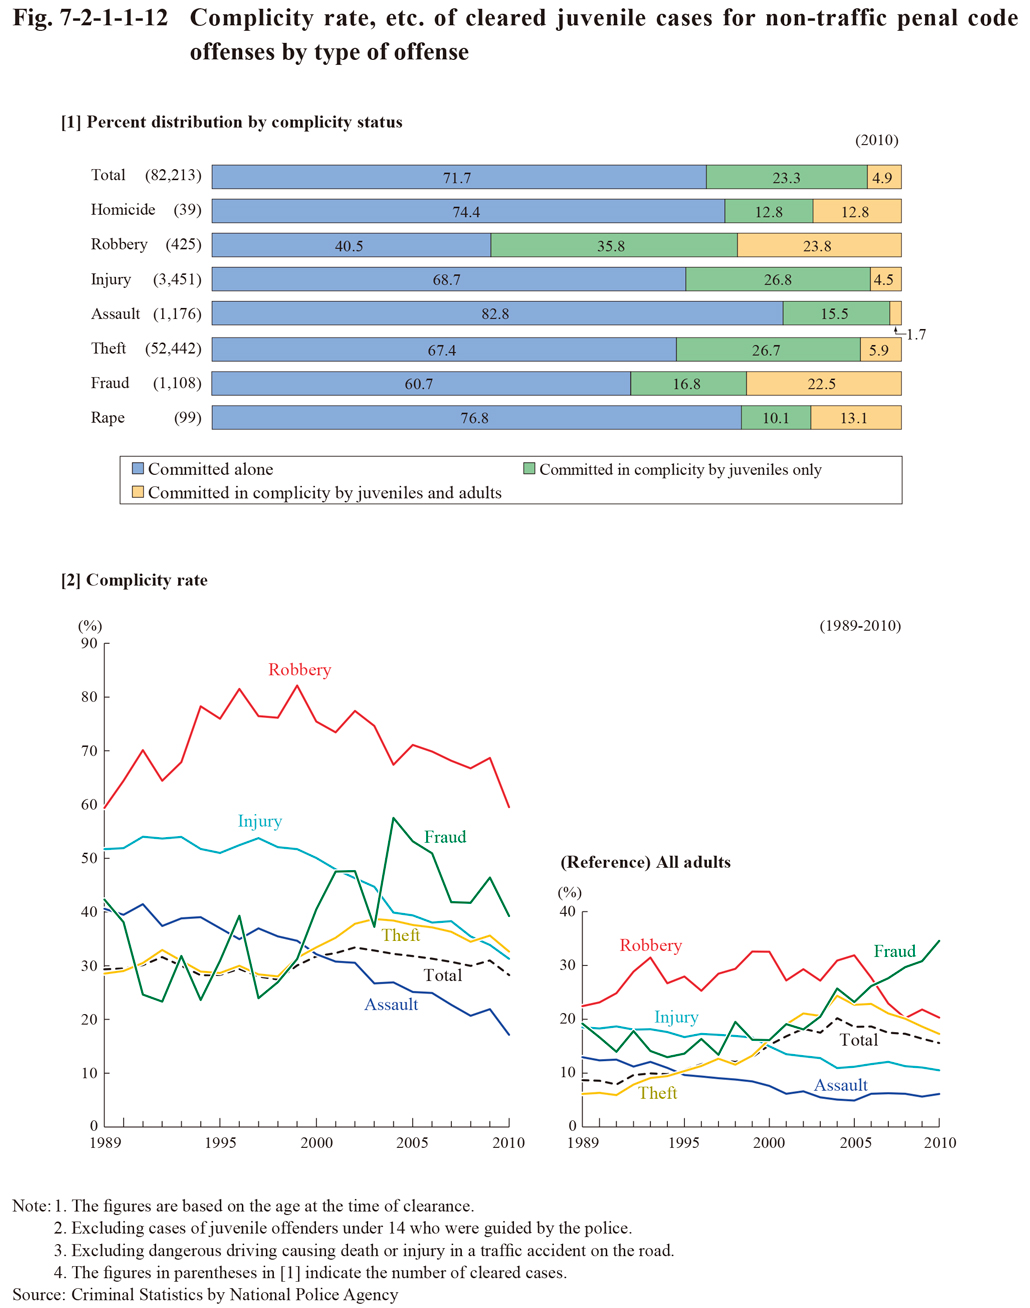
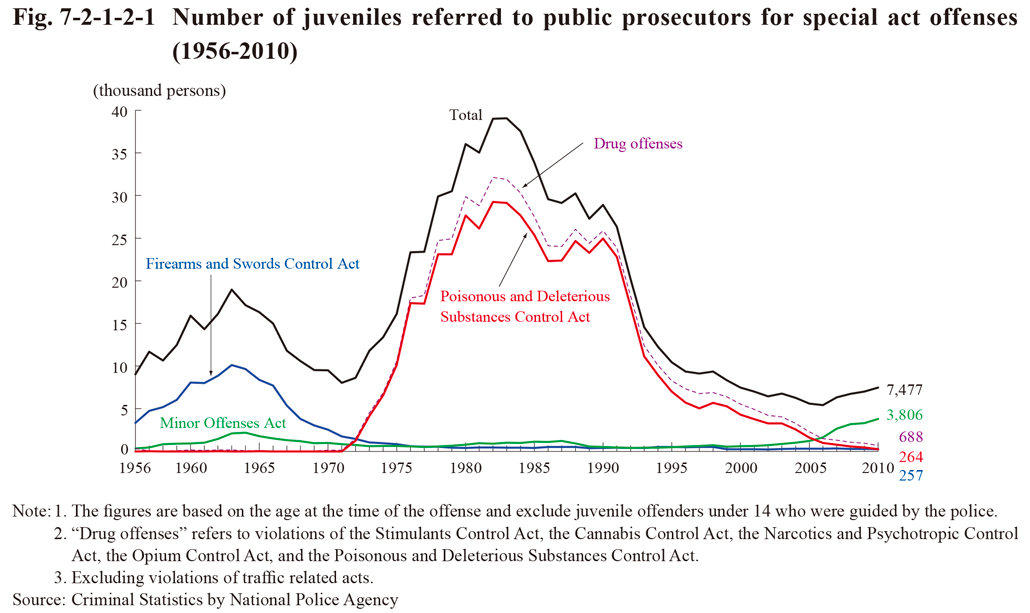
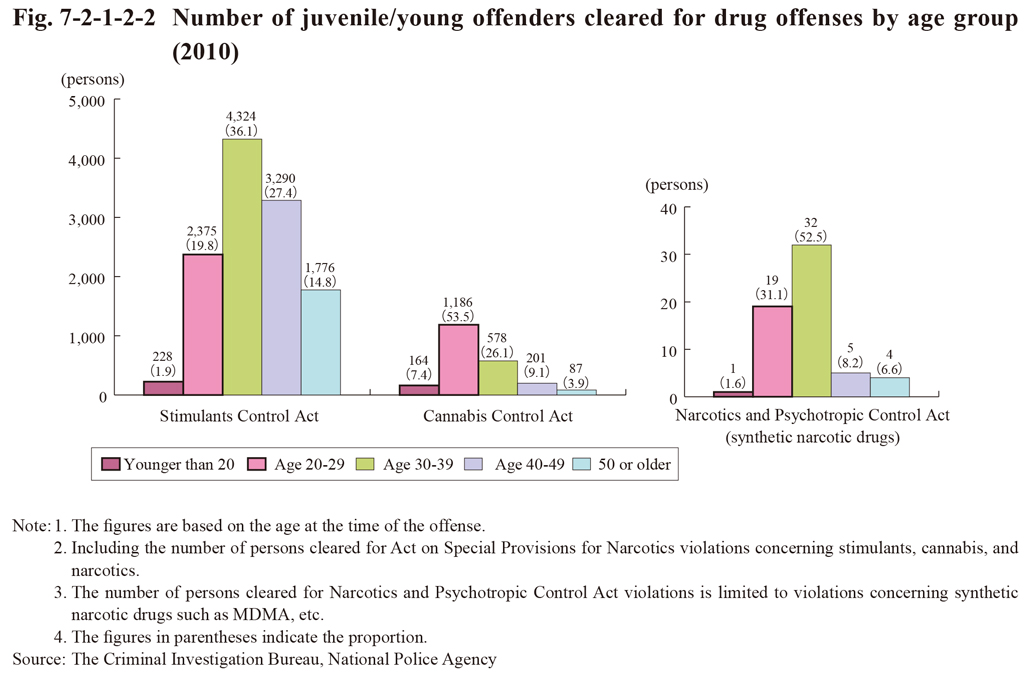 Fig. 7-2-1-2-2 Number of juvenile/young offenders cleared for drug offenses by age group (2010)
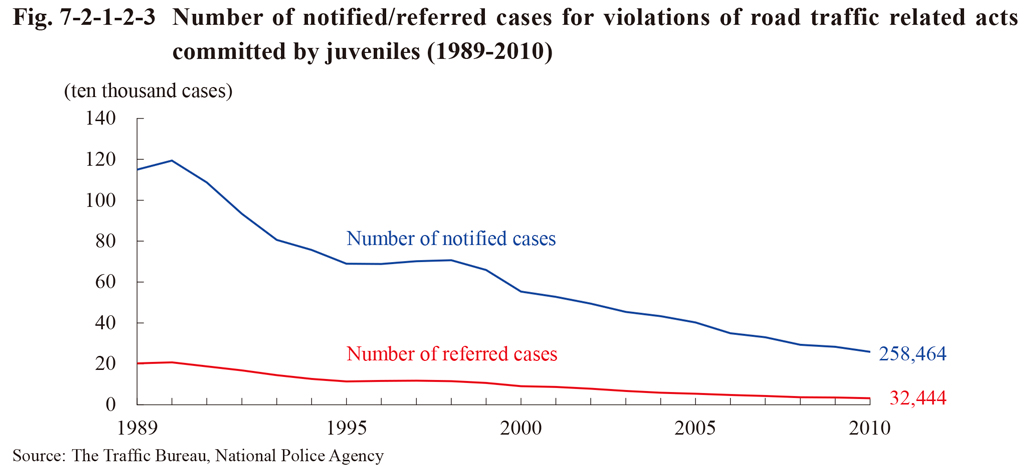
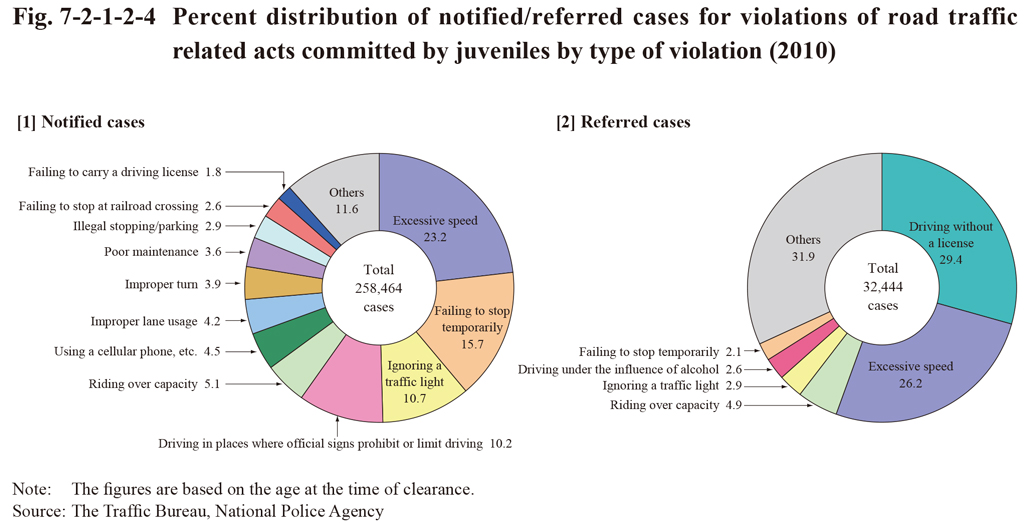
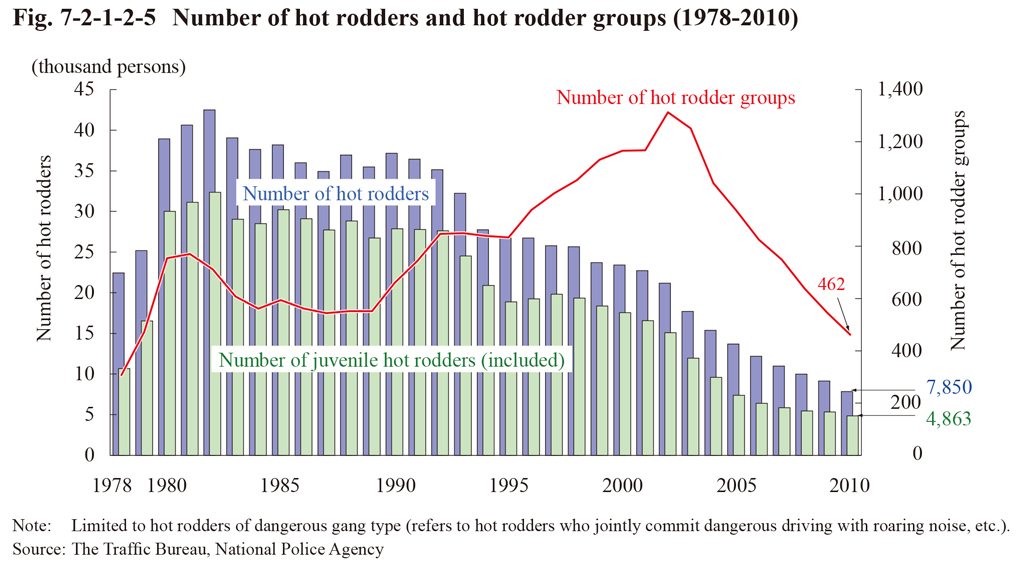 Fig. 7-2-1-2-5 Number of hot rodders and hot rodder groups (1978-2010)
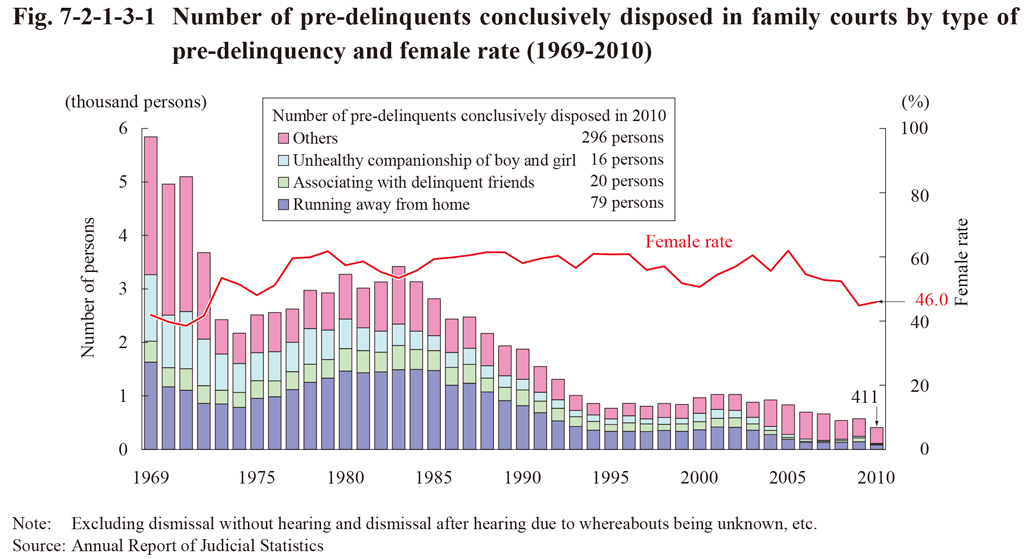
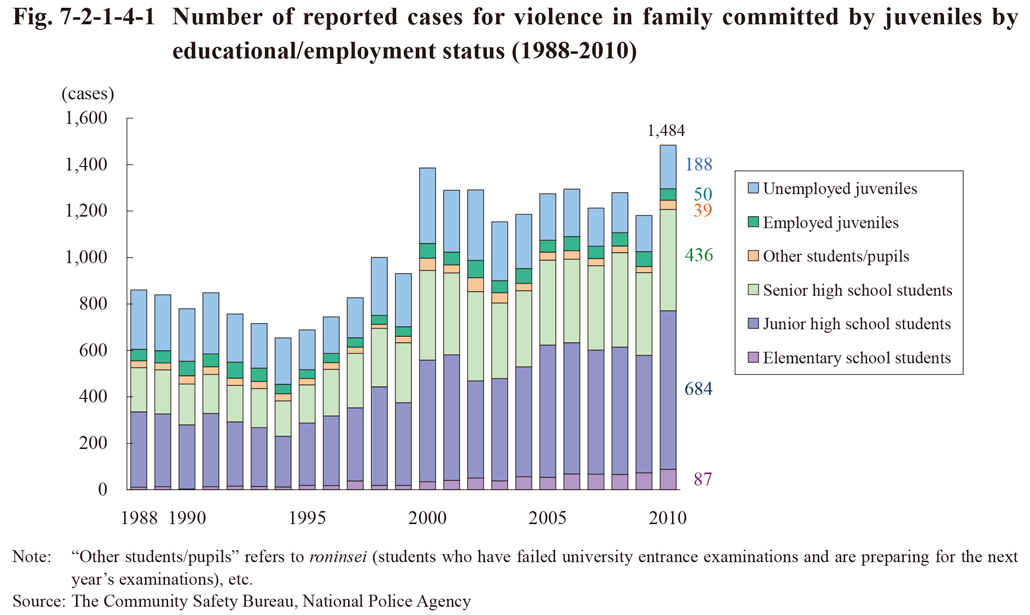
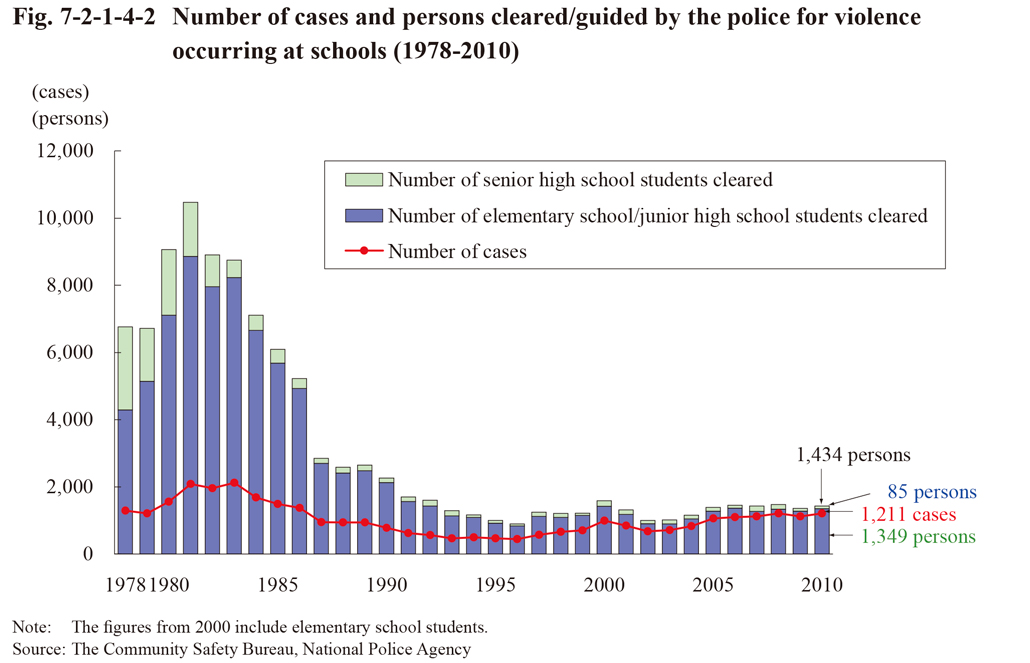

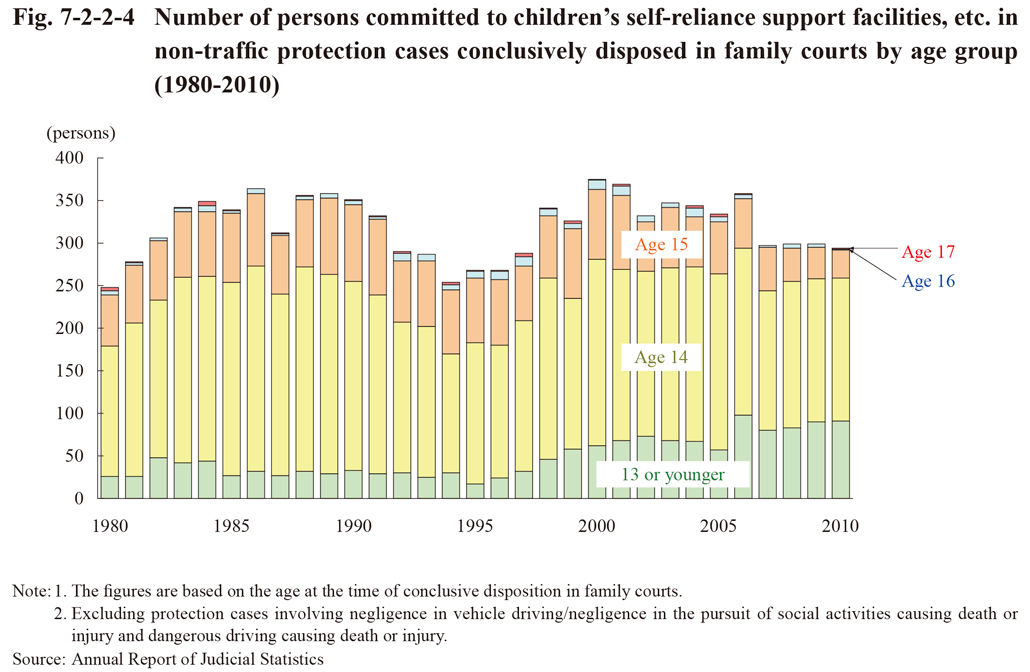
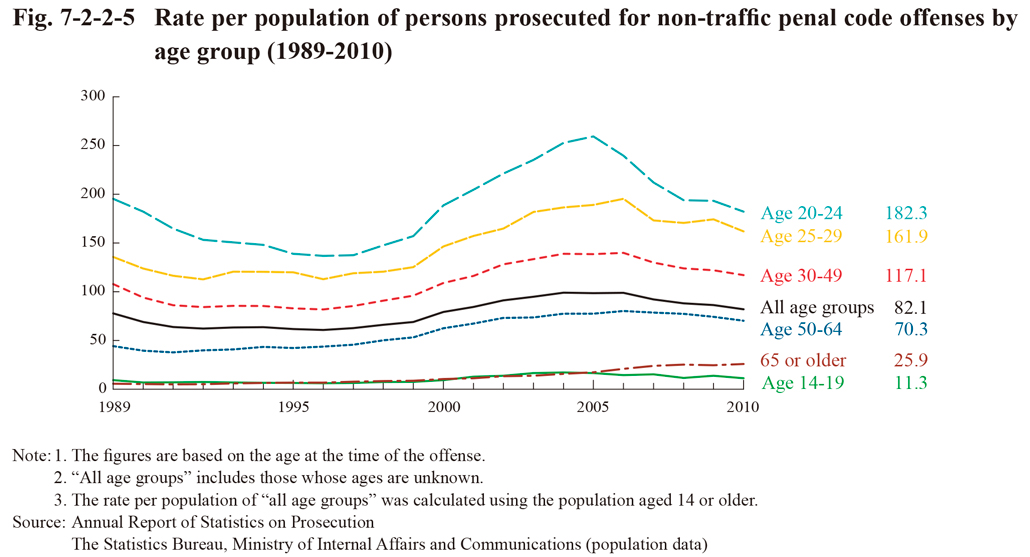
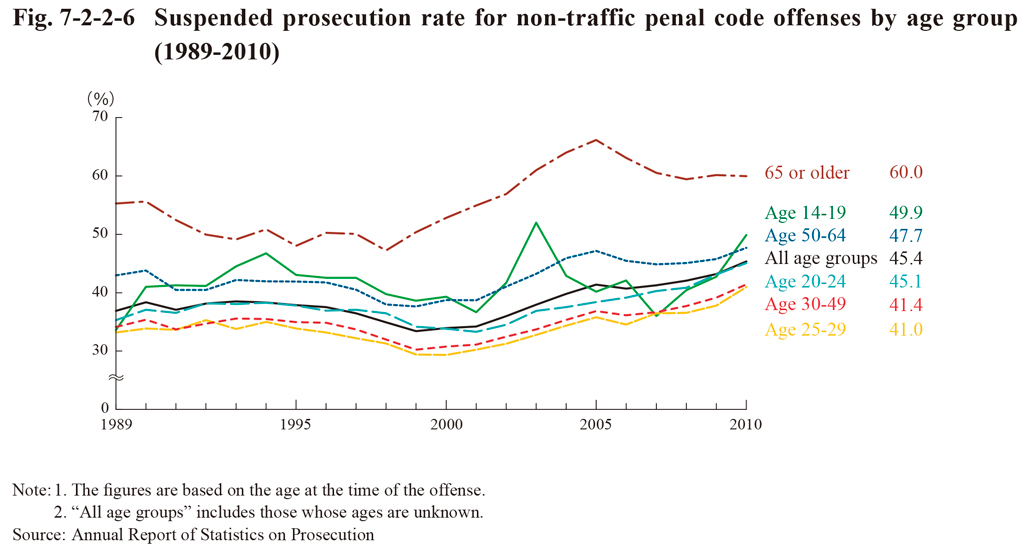 Fig. 7-2-2-6 Suspended prosecution rate for non-traffic penal code offenses by age group (1989-2010)
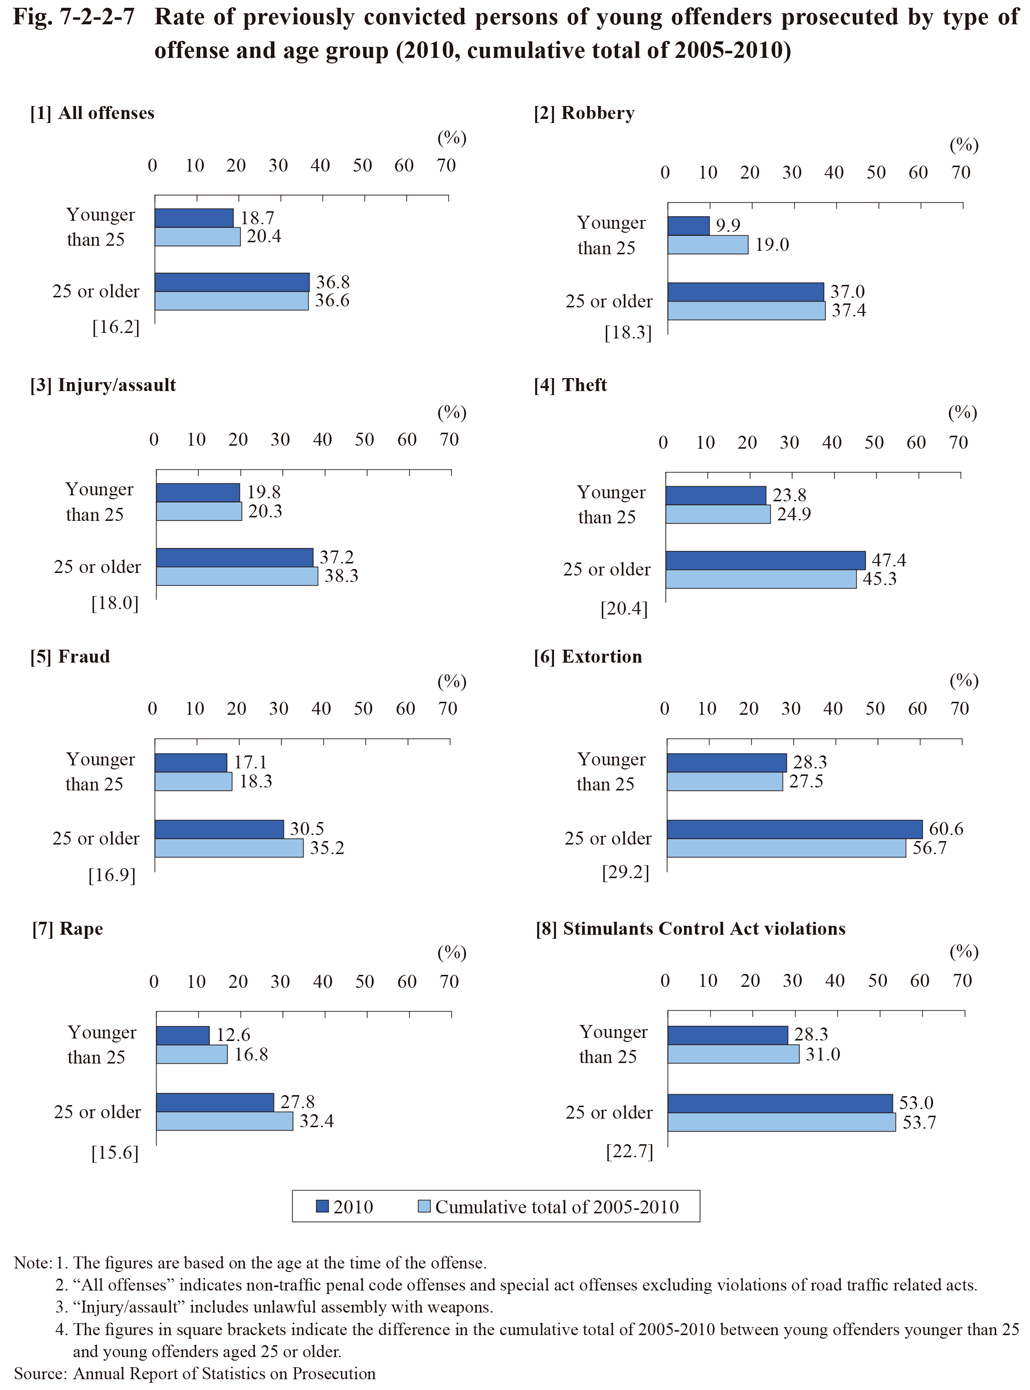
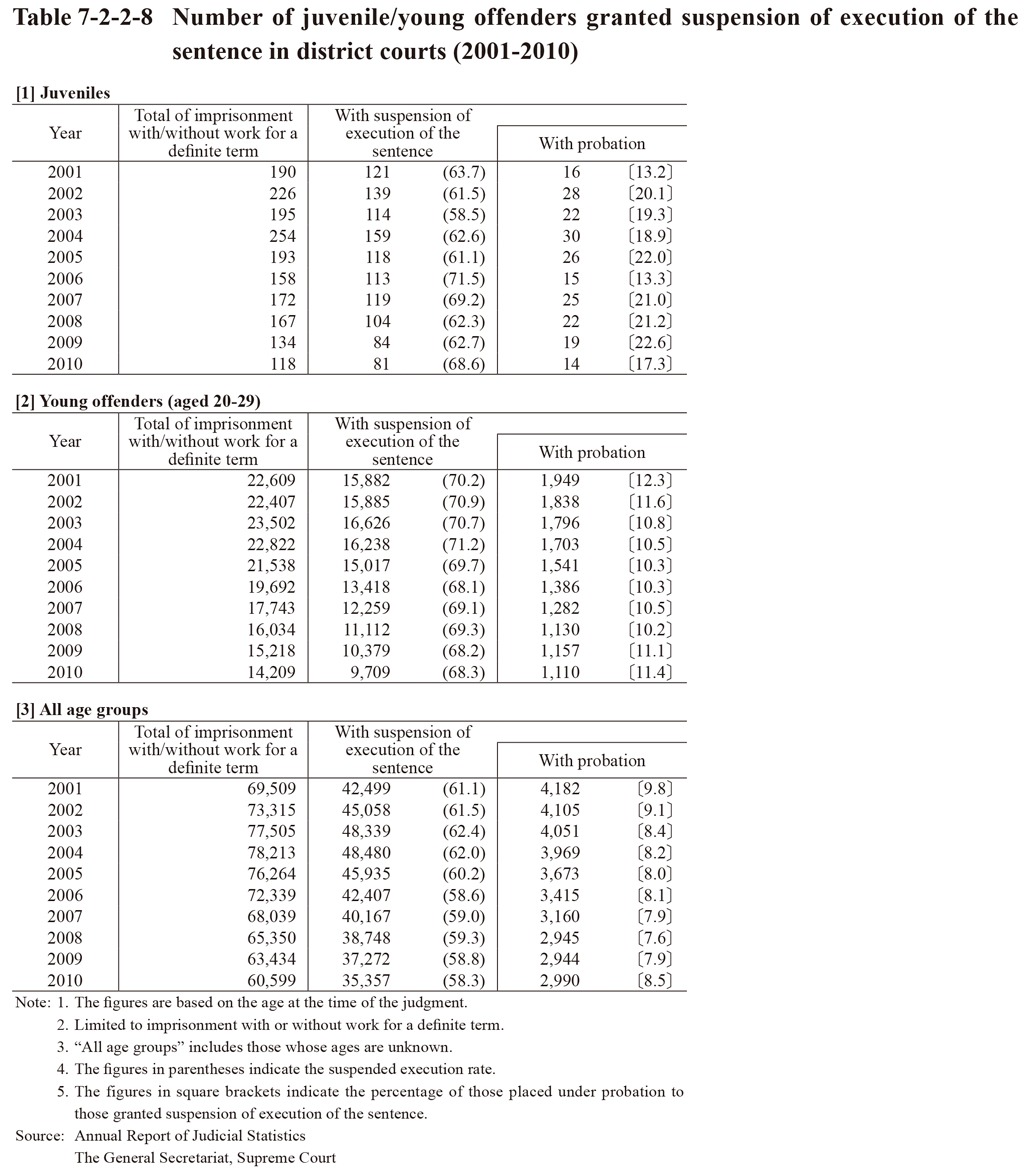
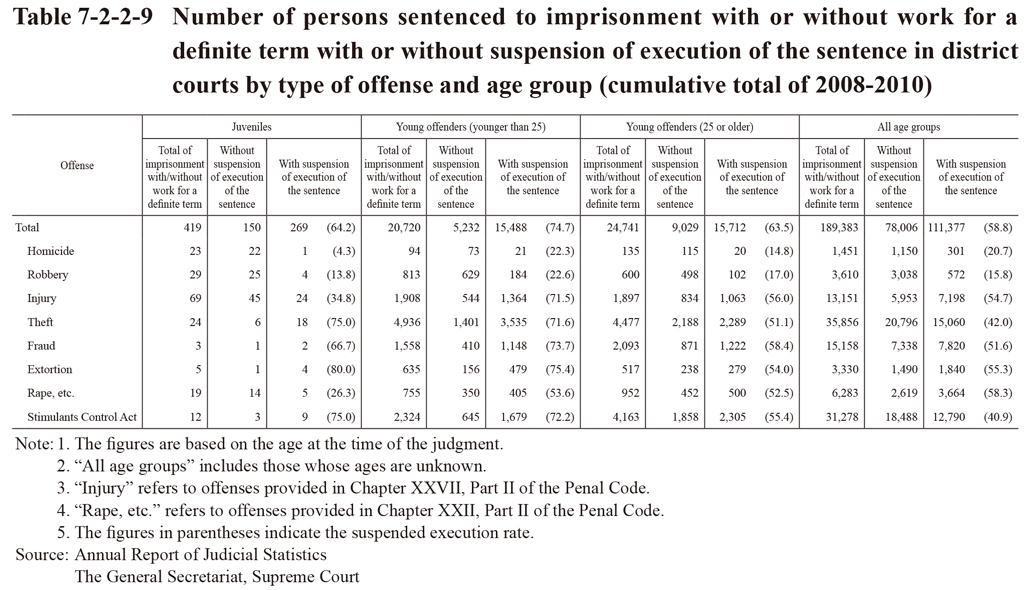
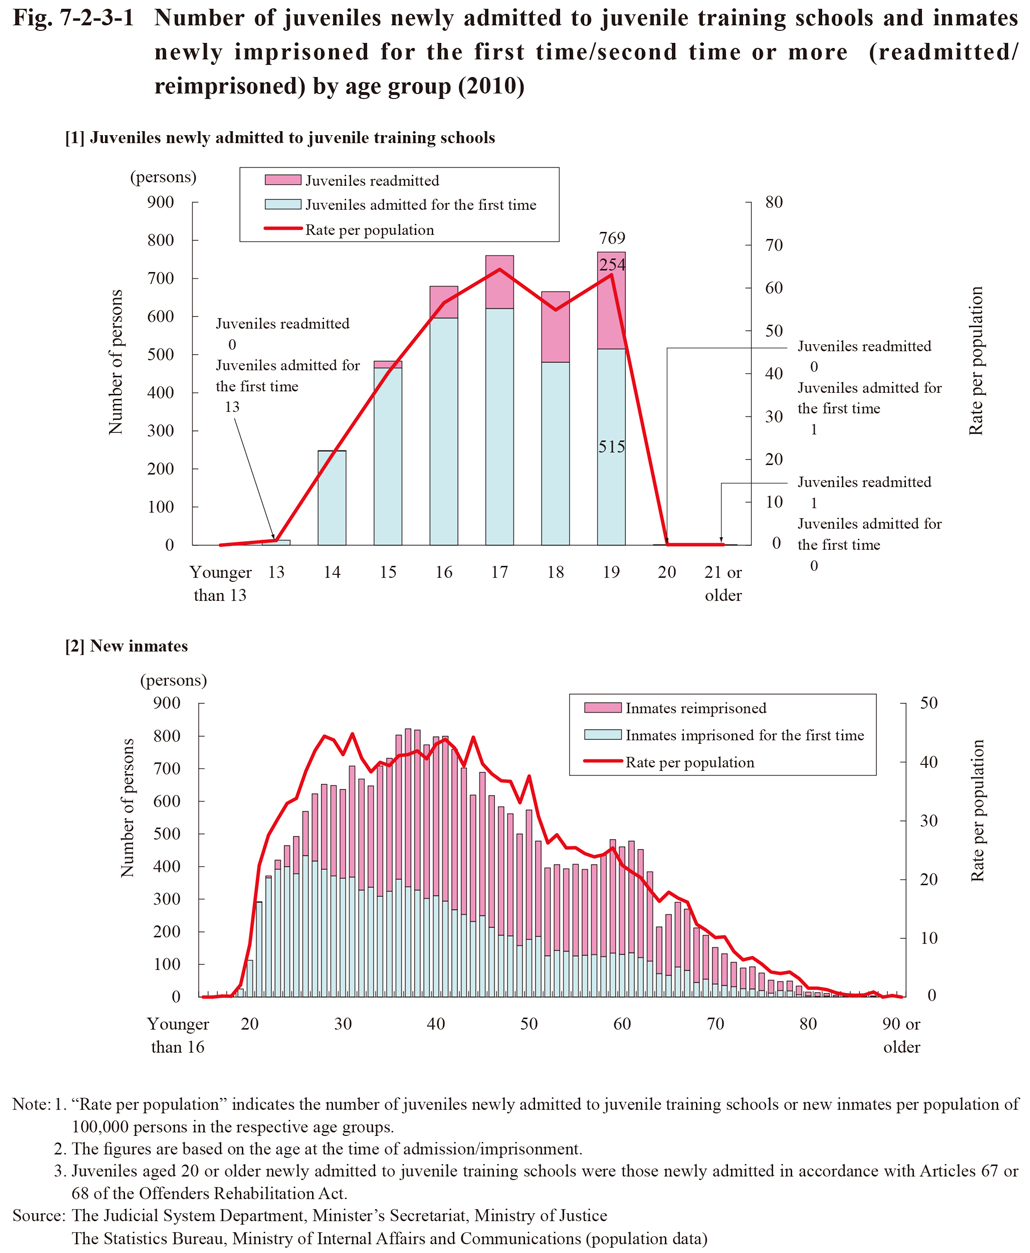
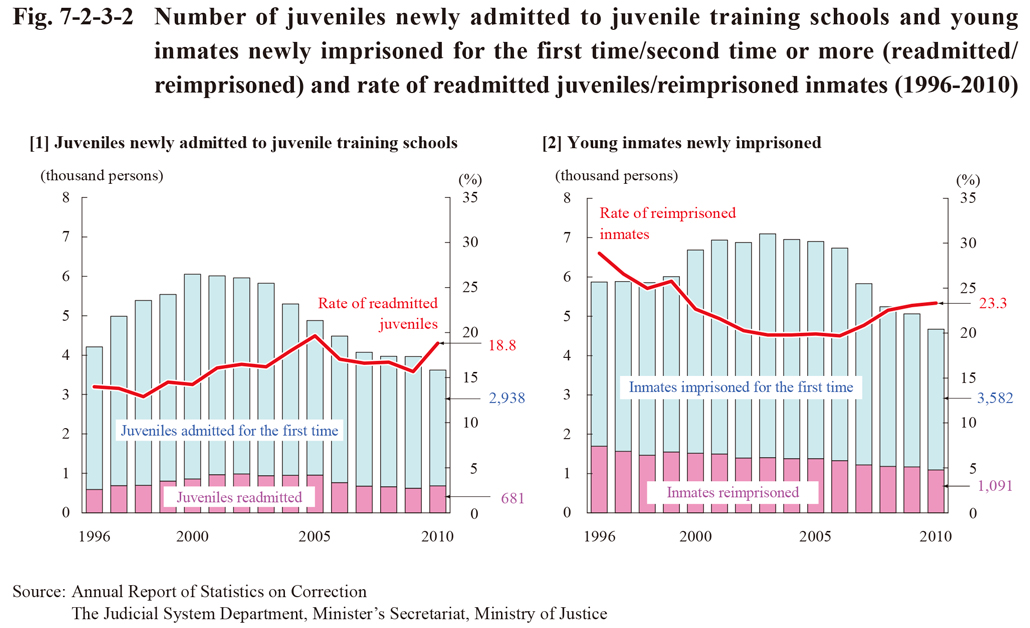
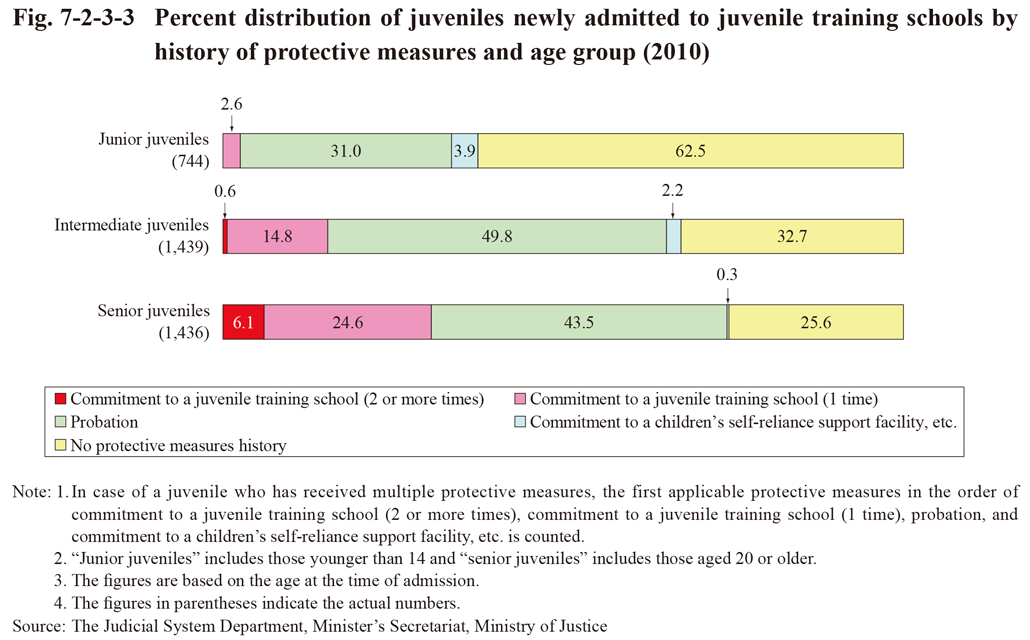
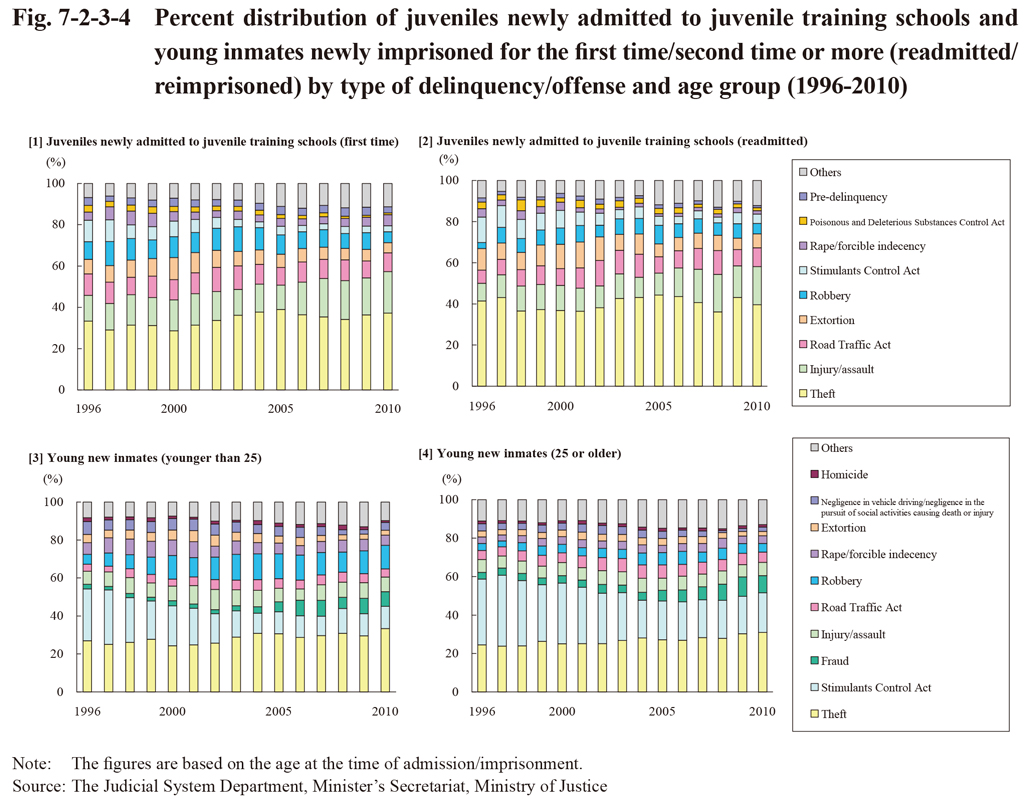
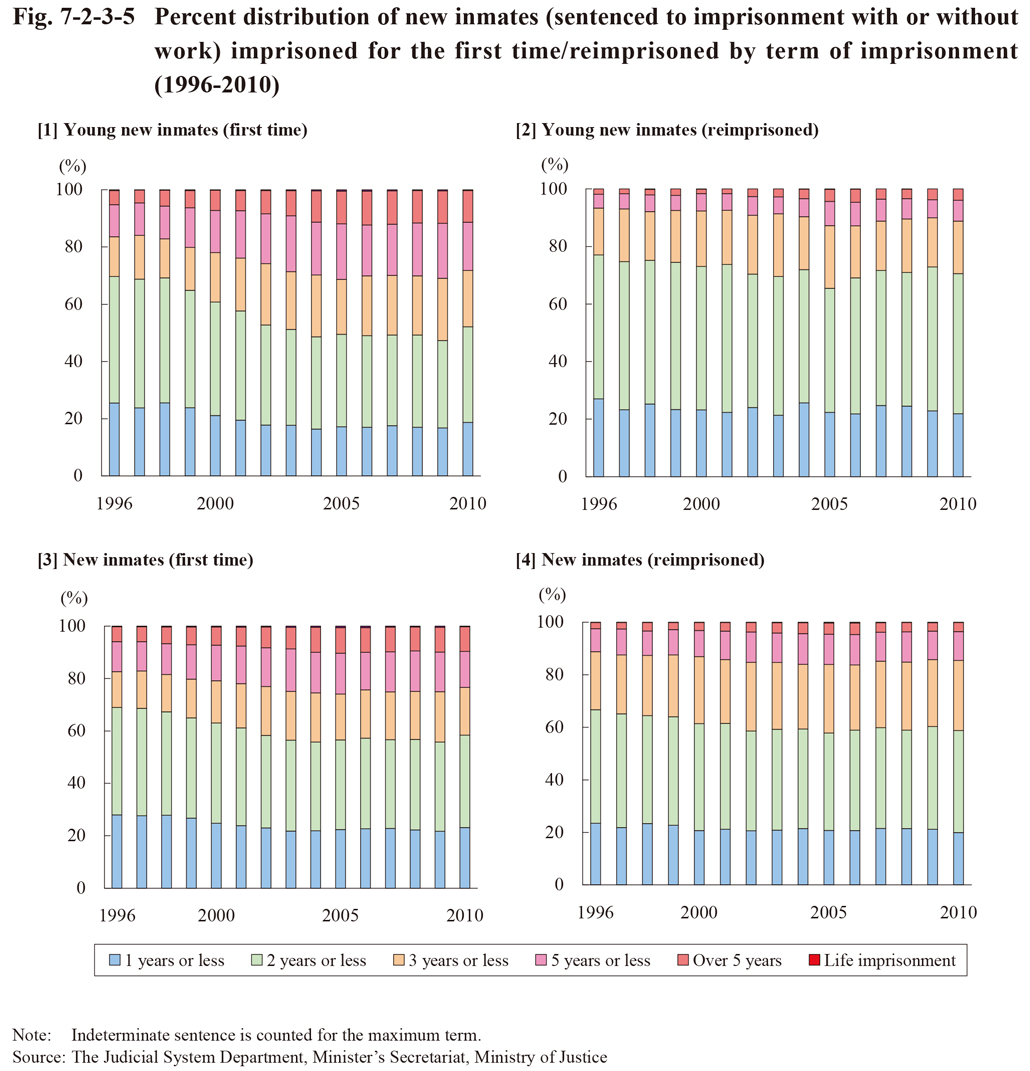
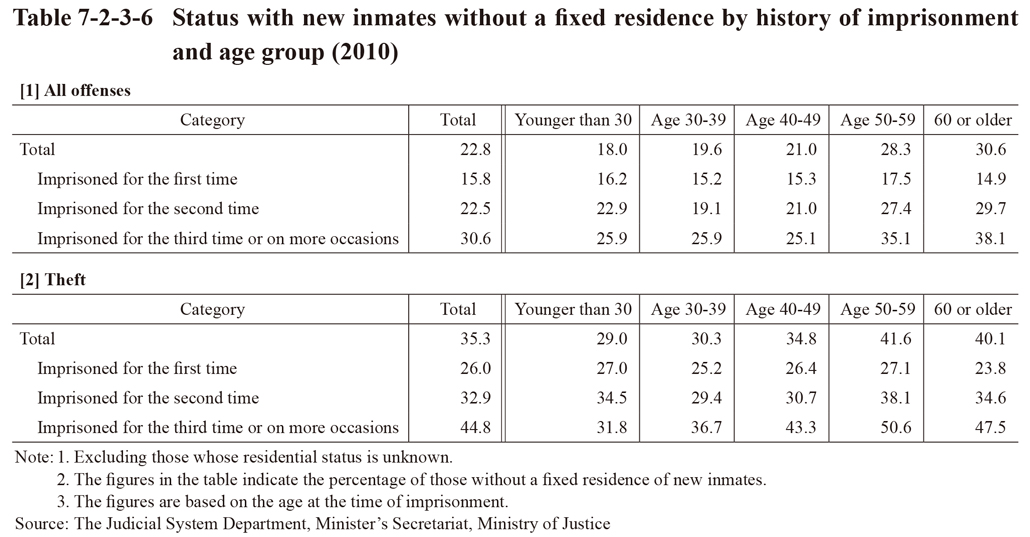
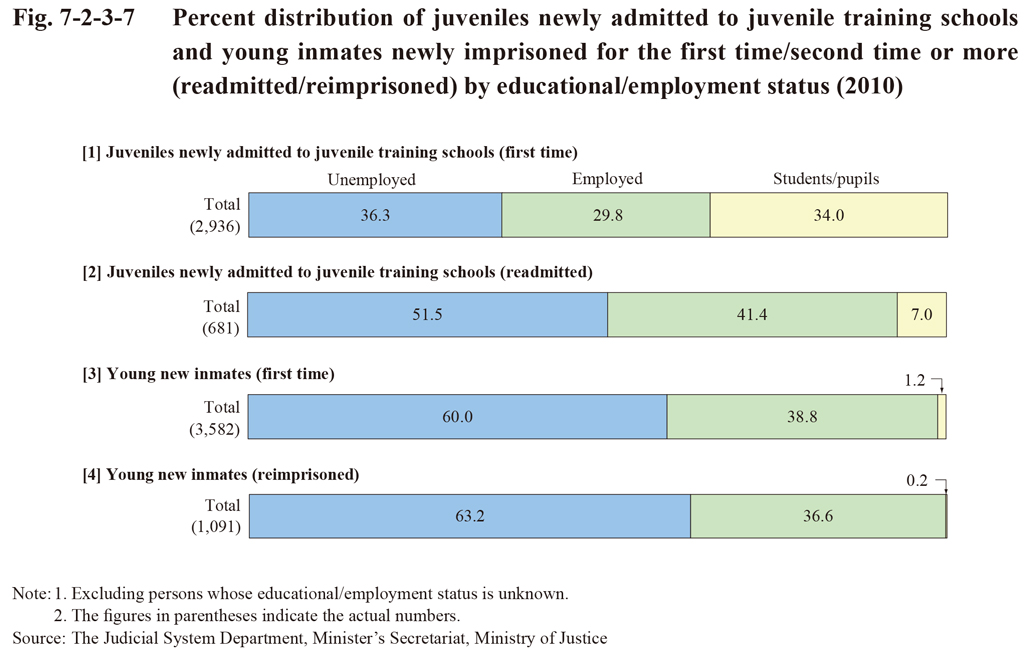
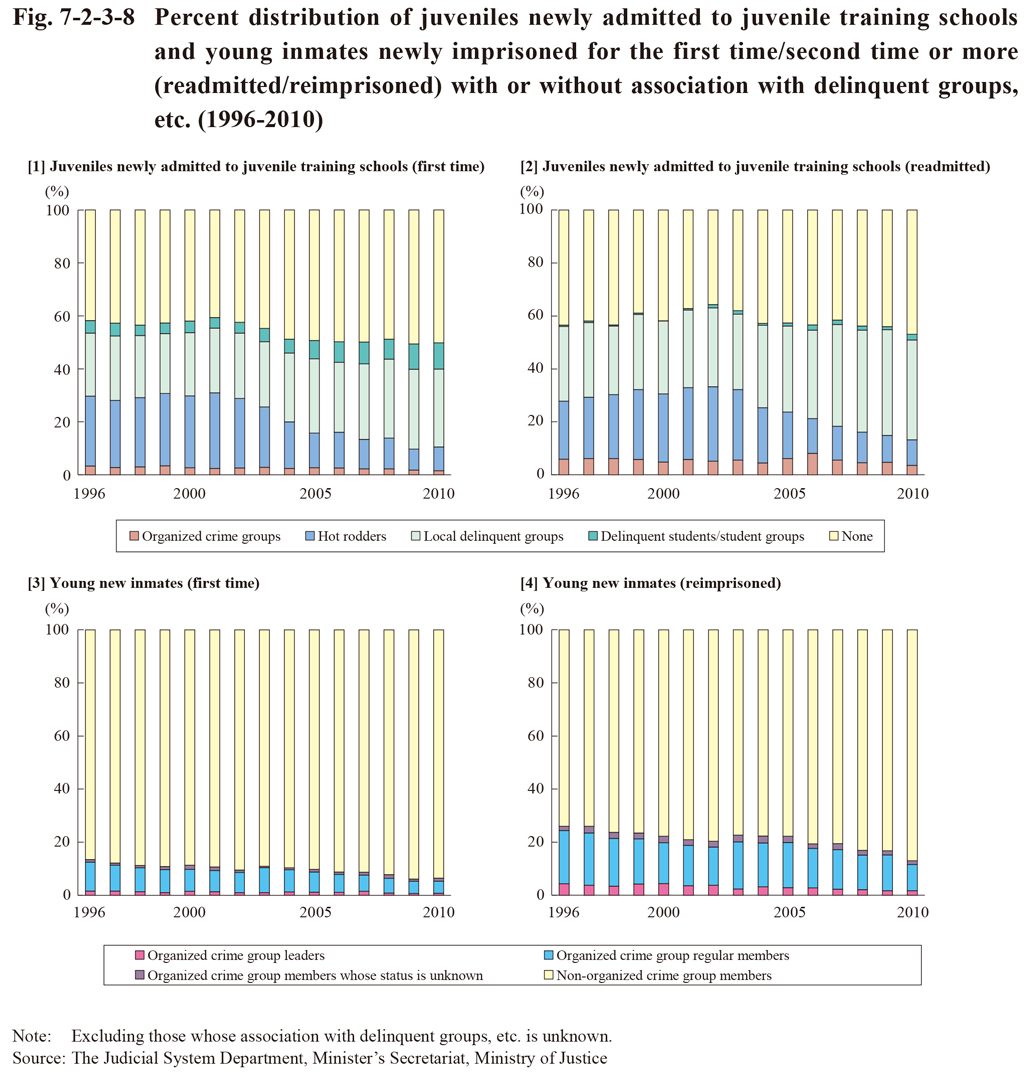
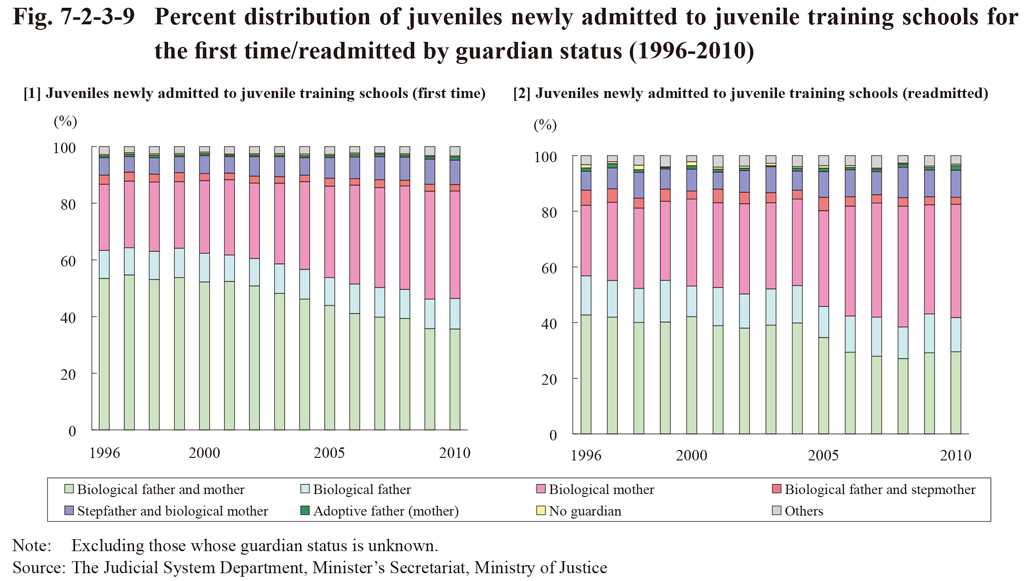
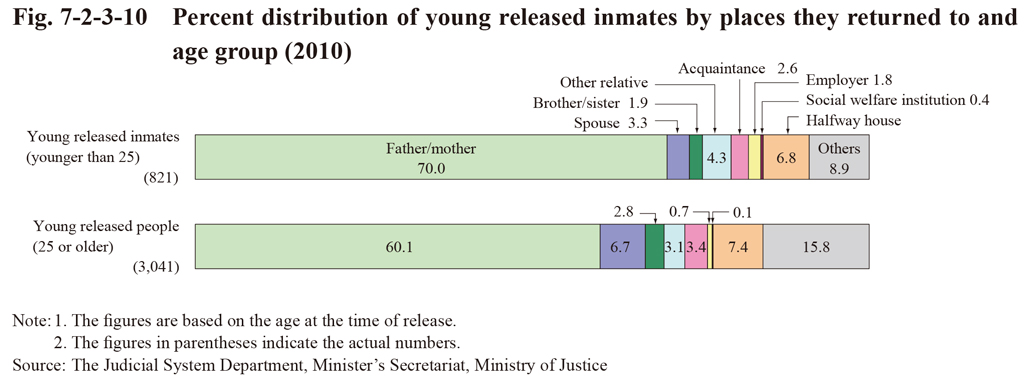
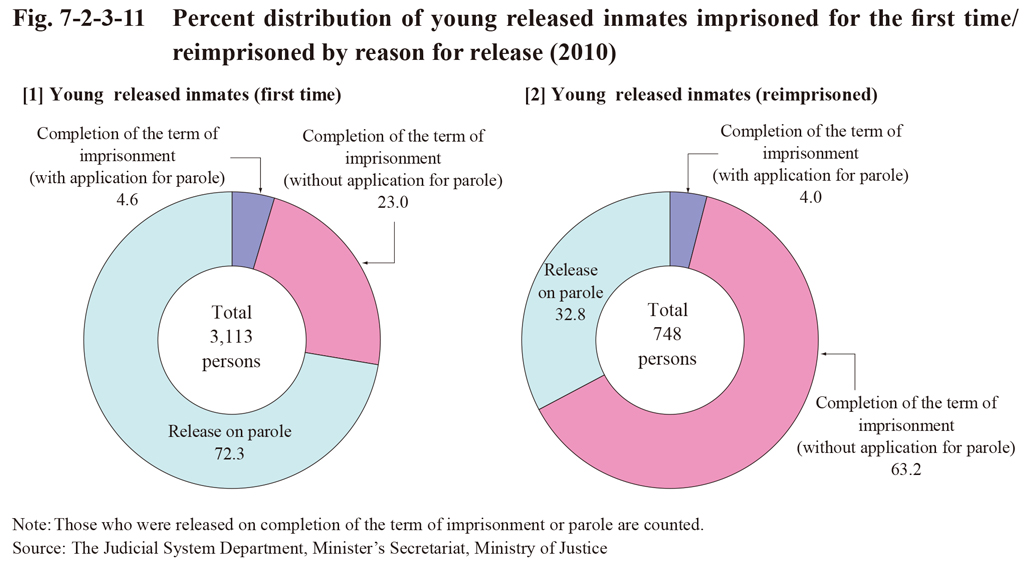
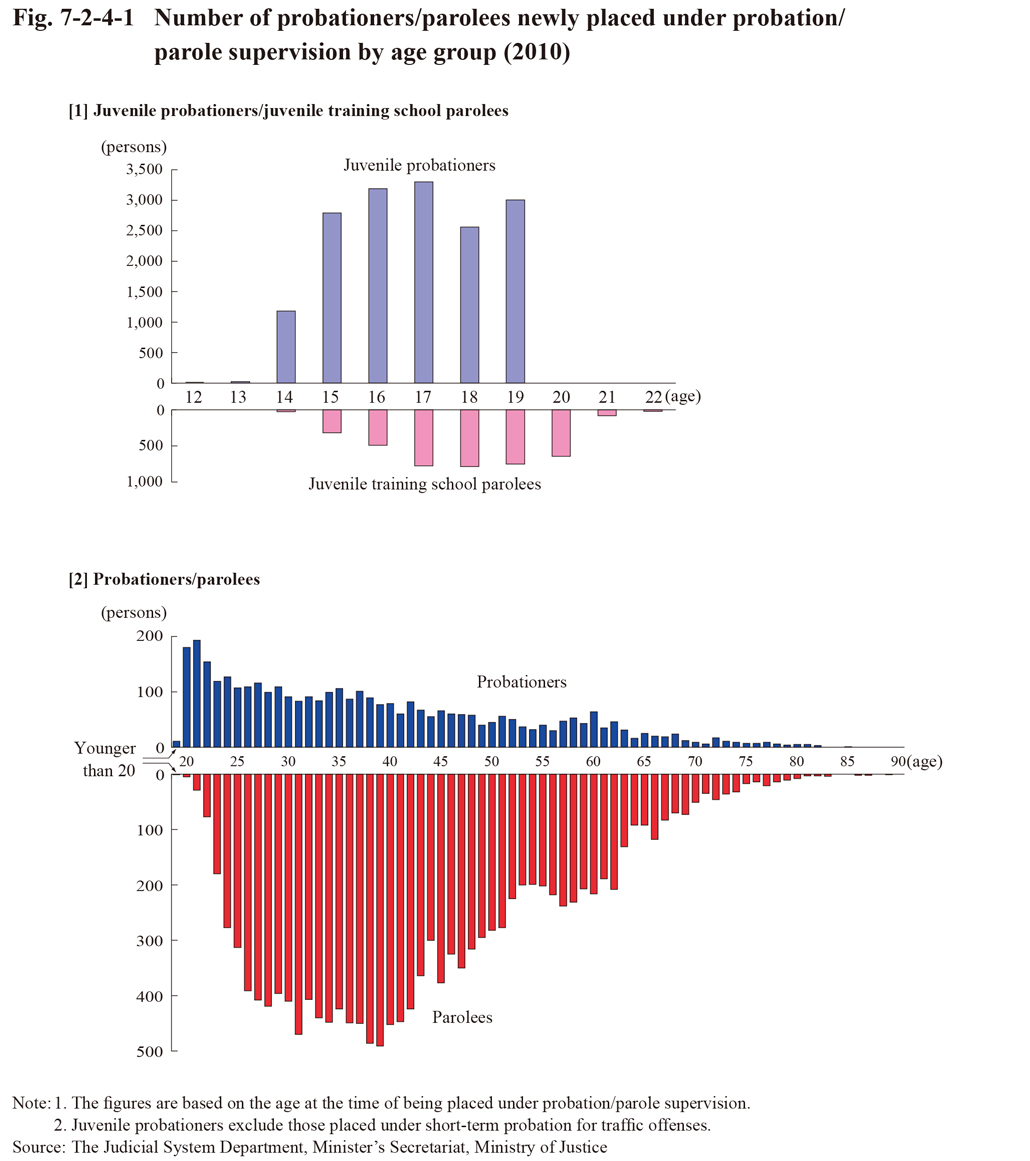
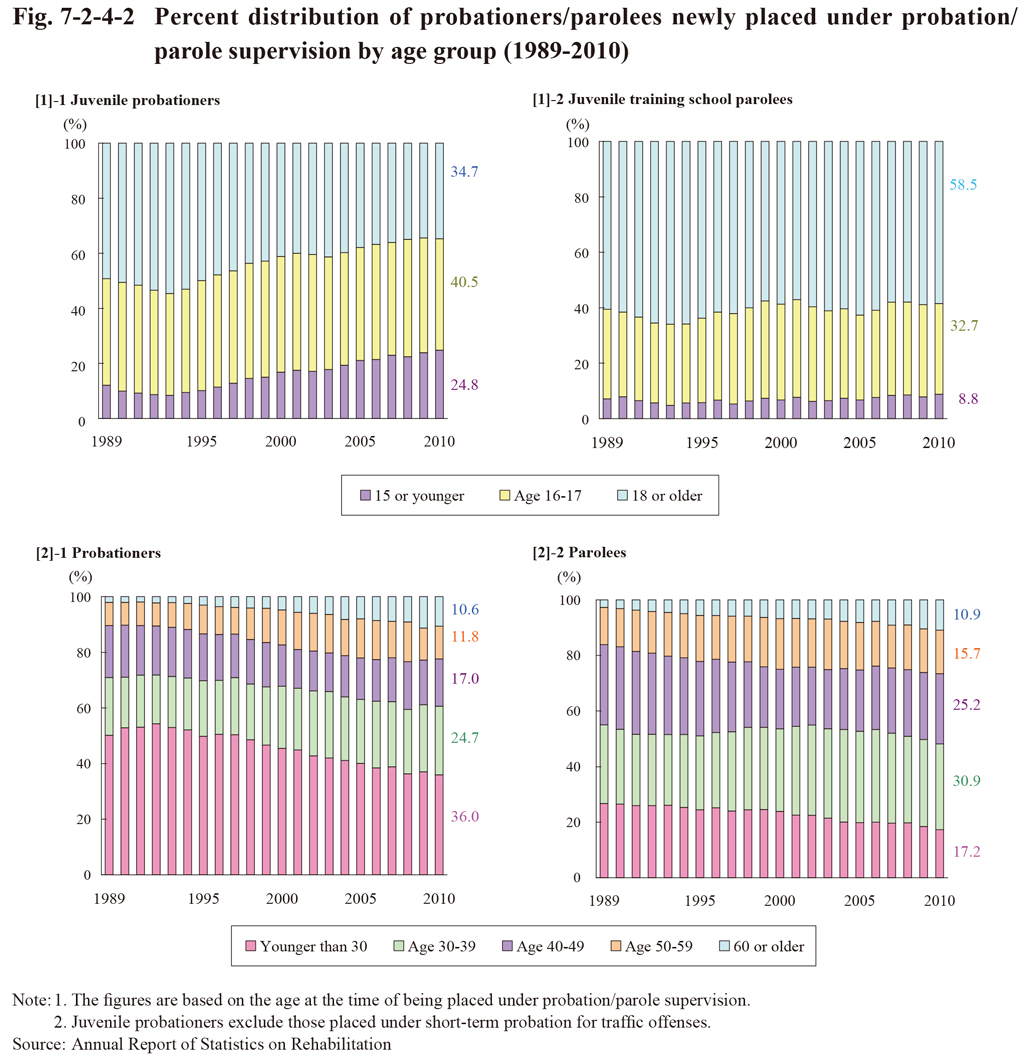
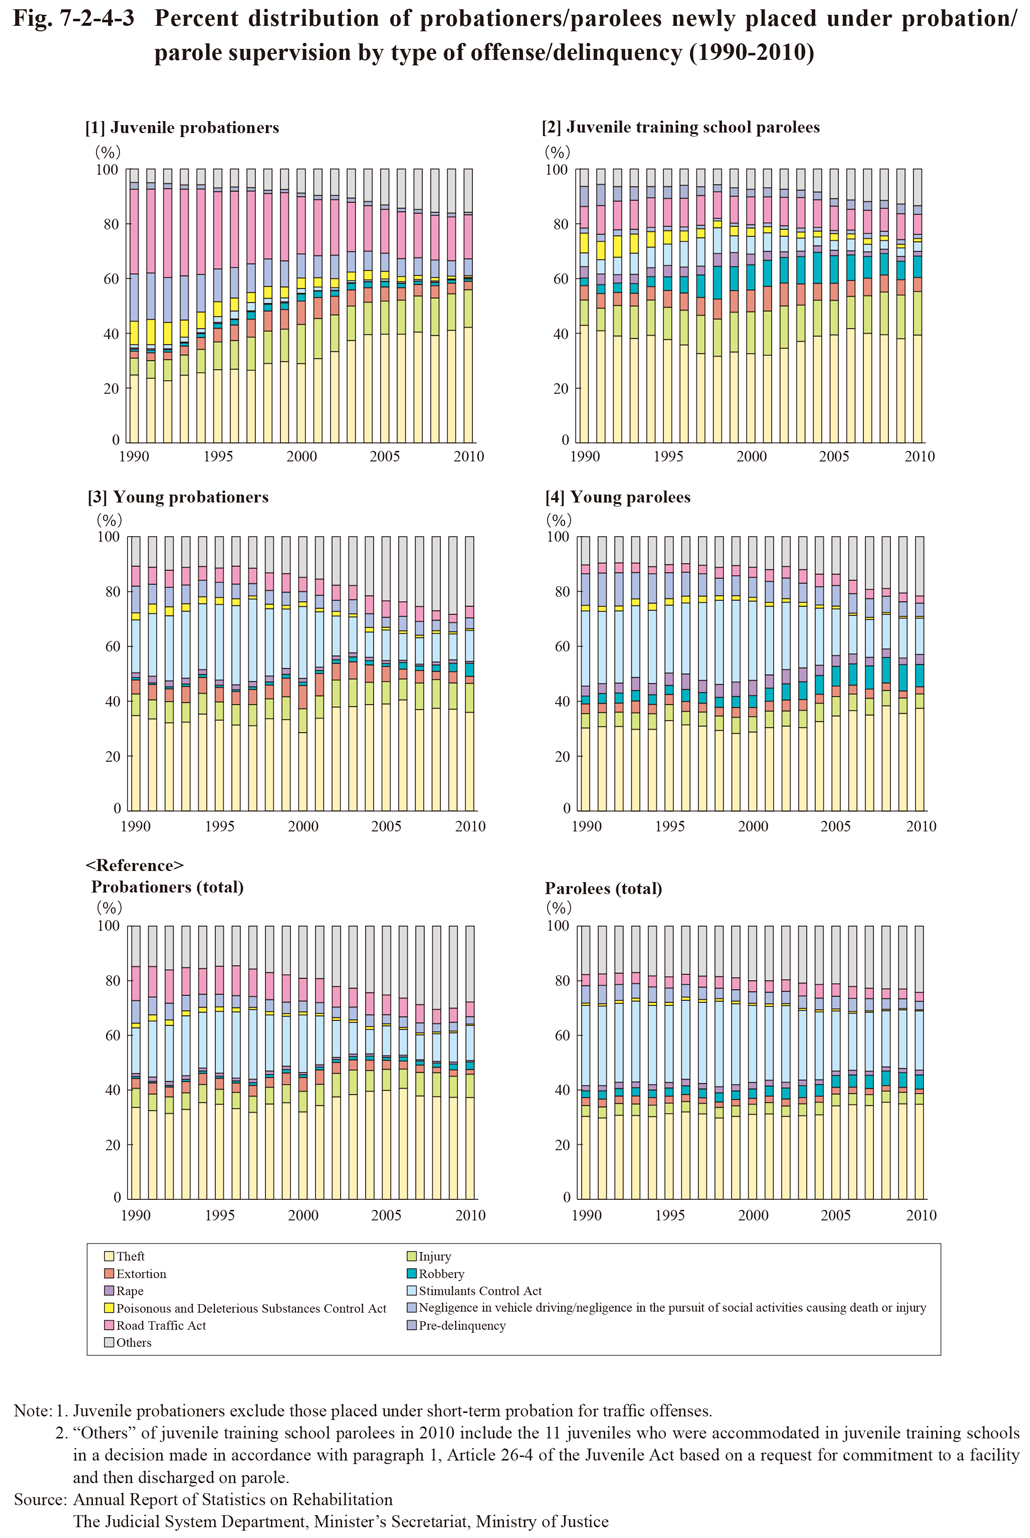
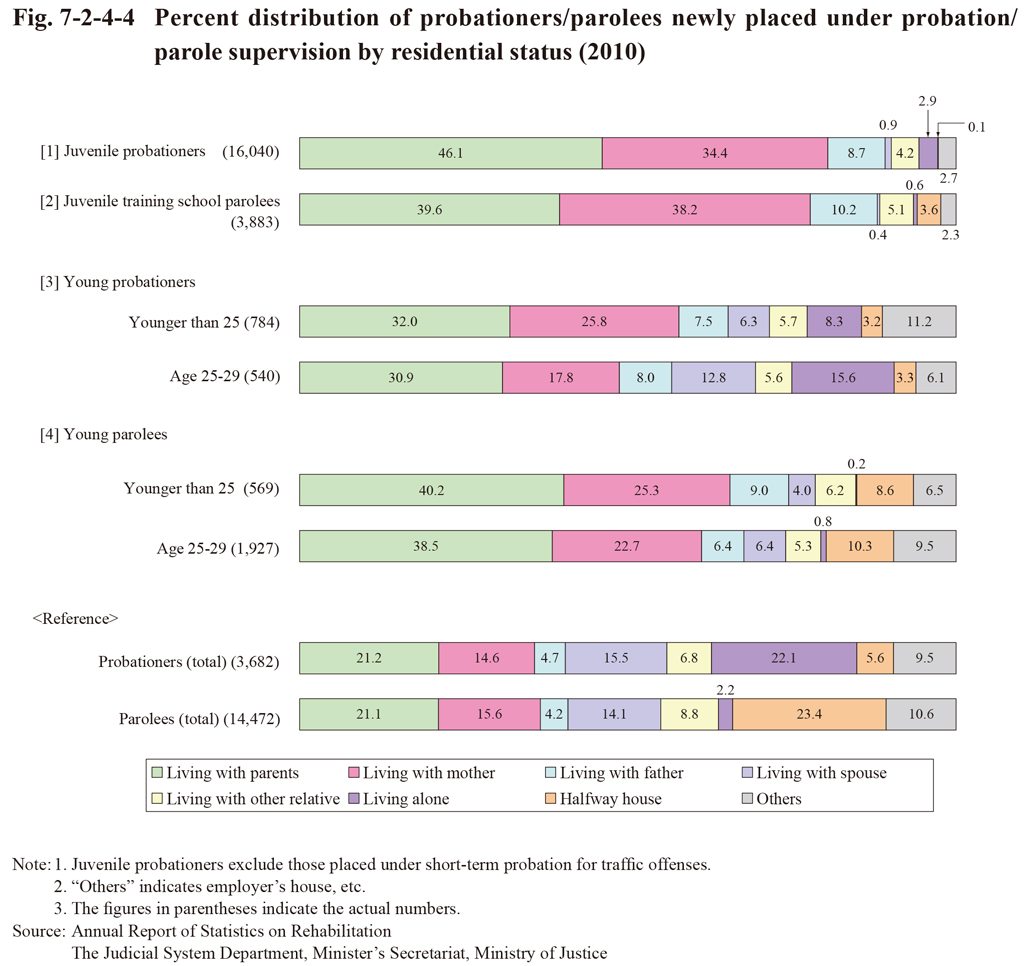
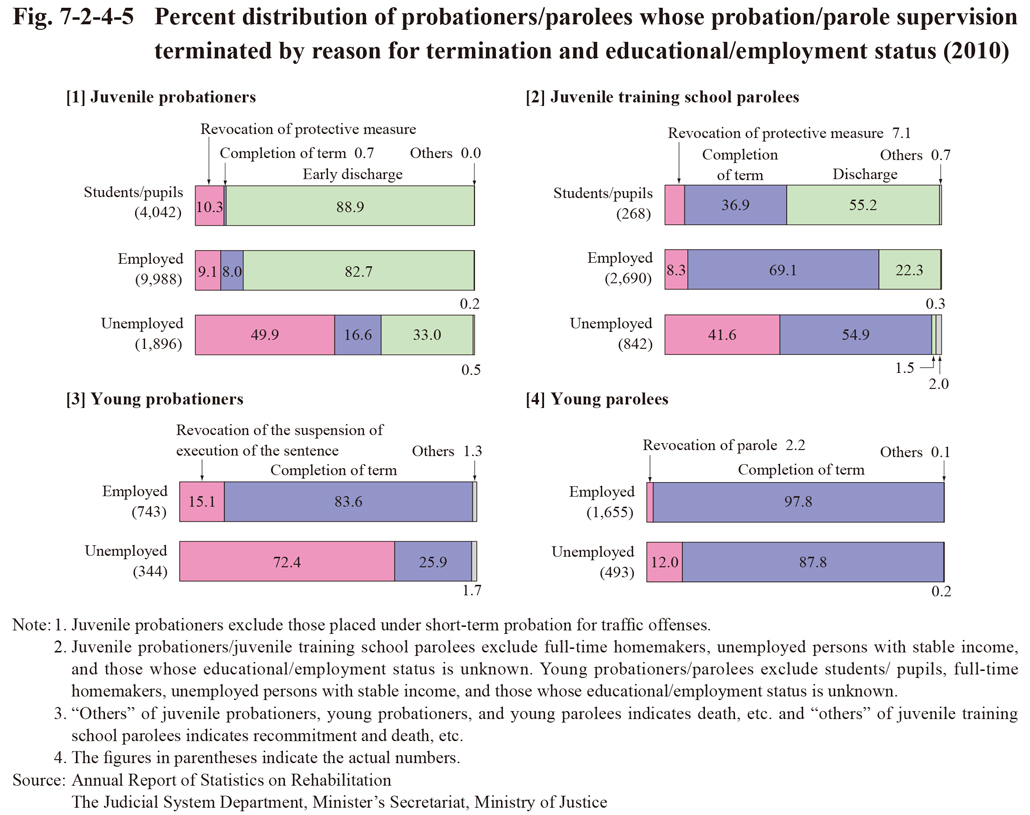
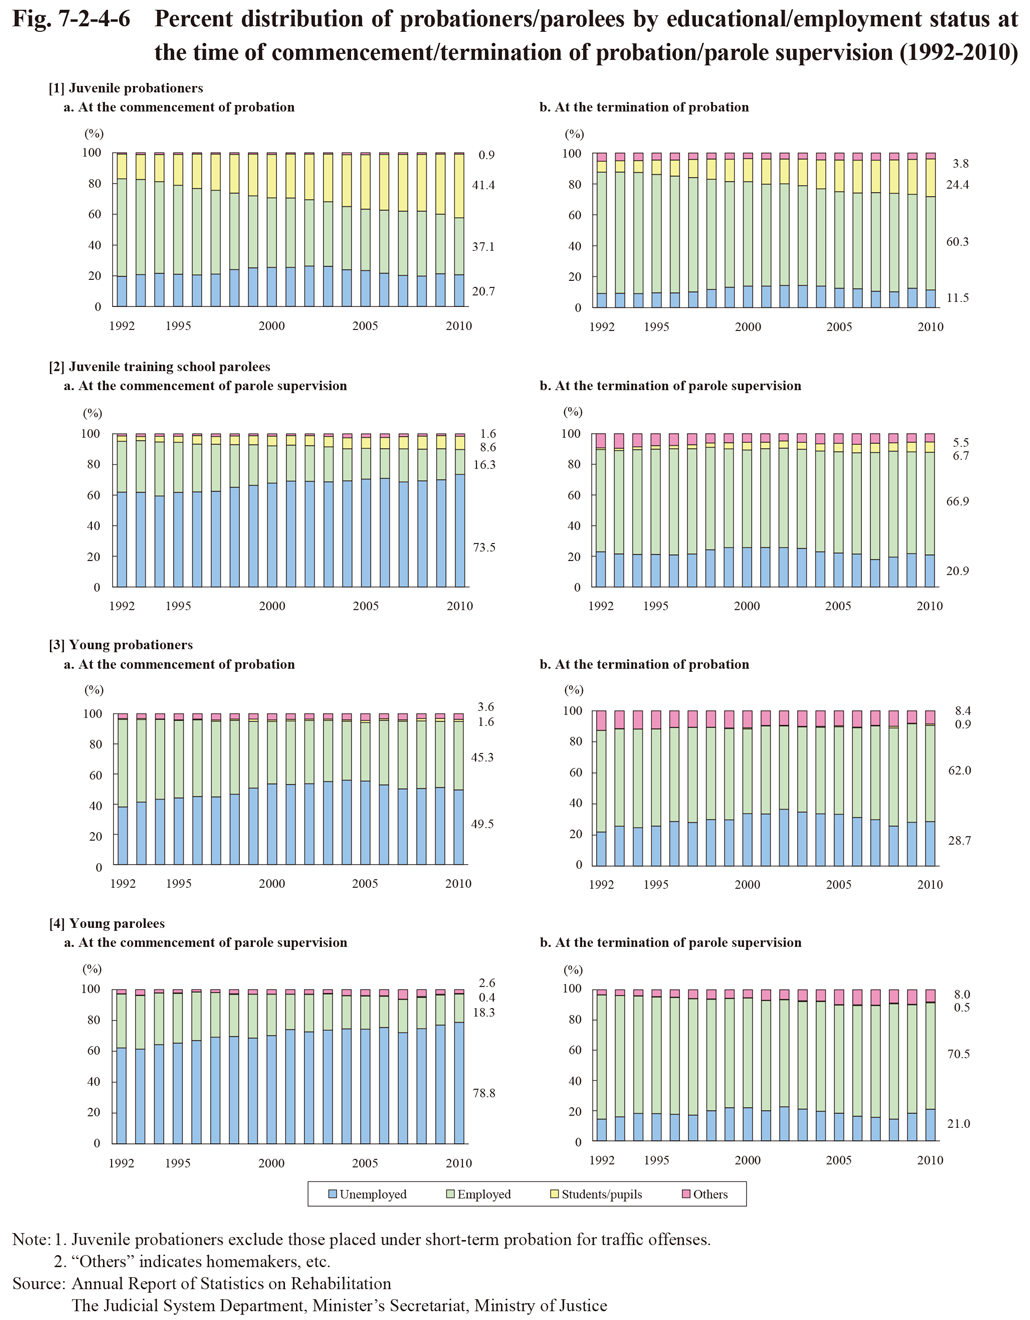
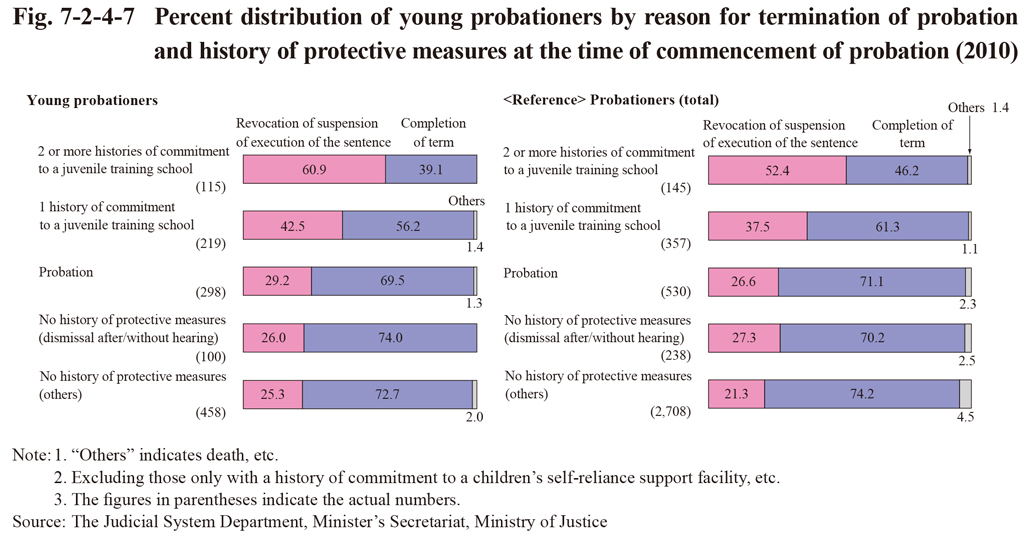
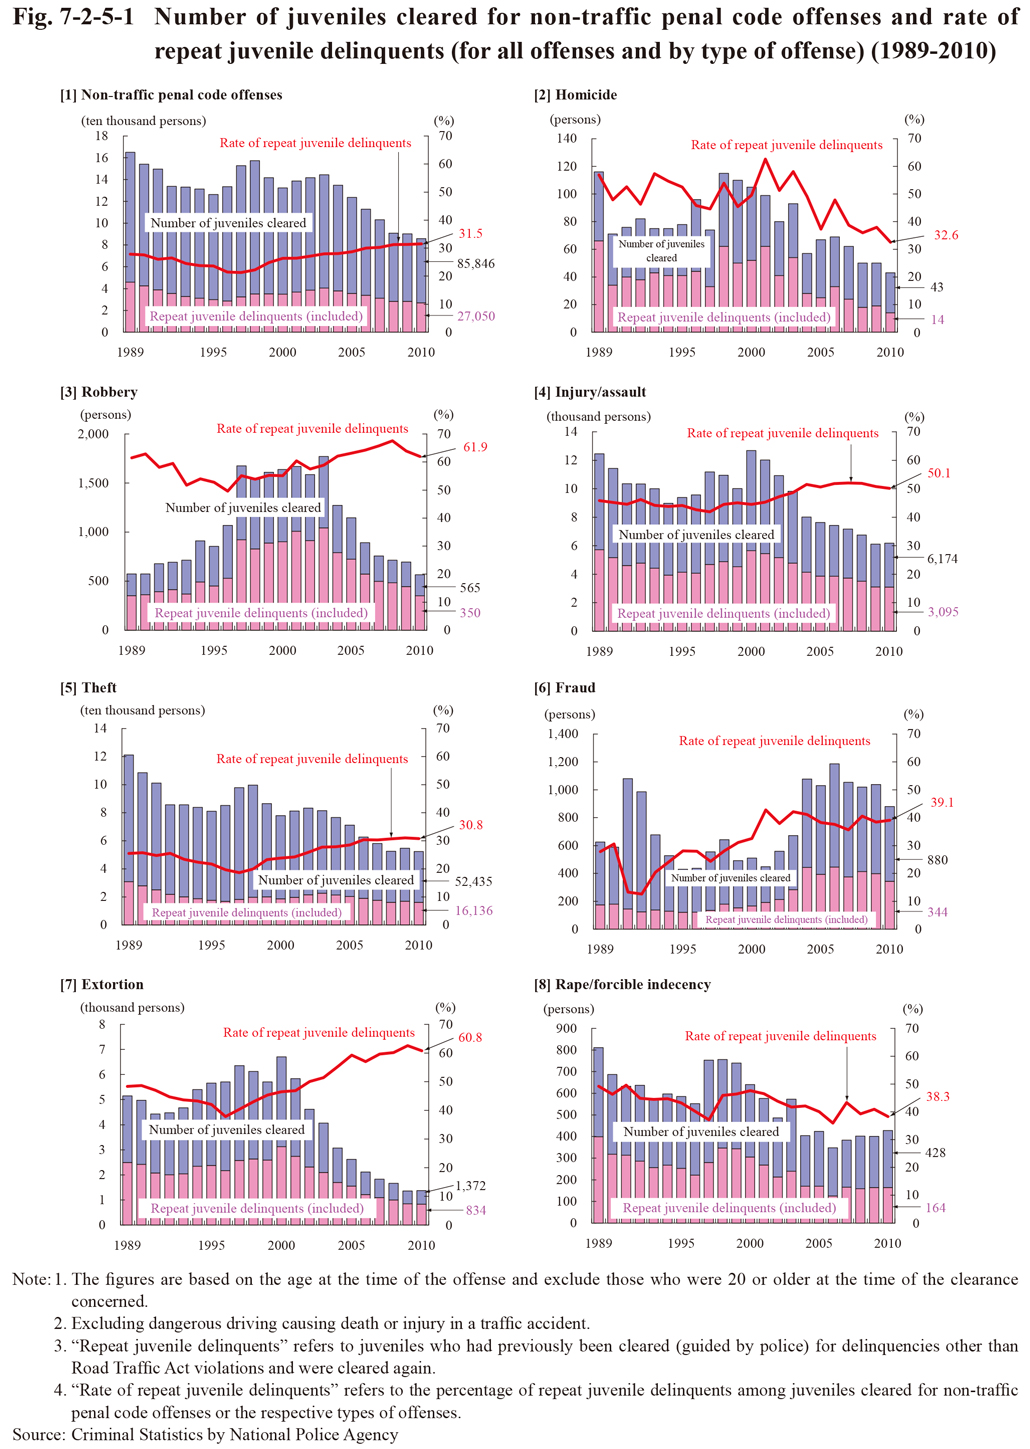
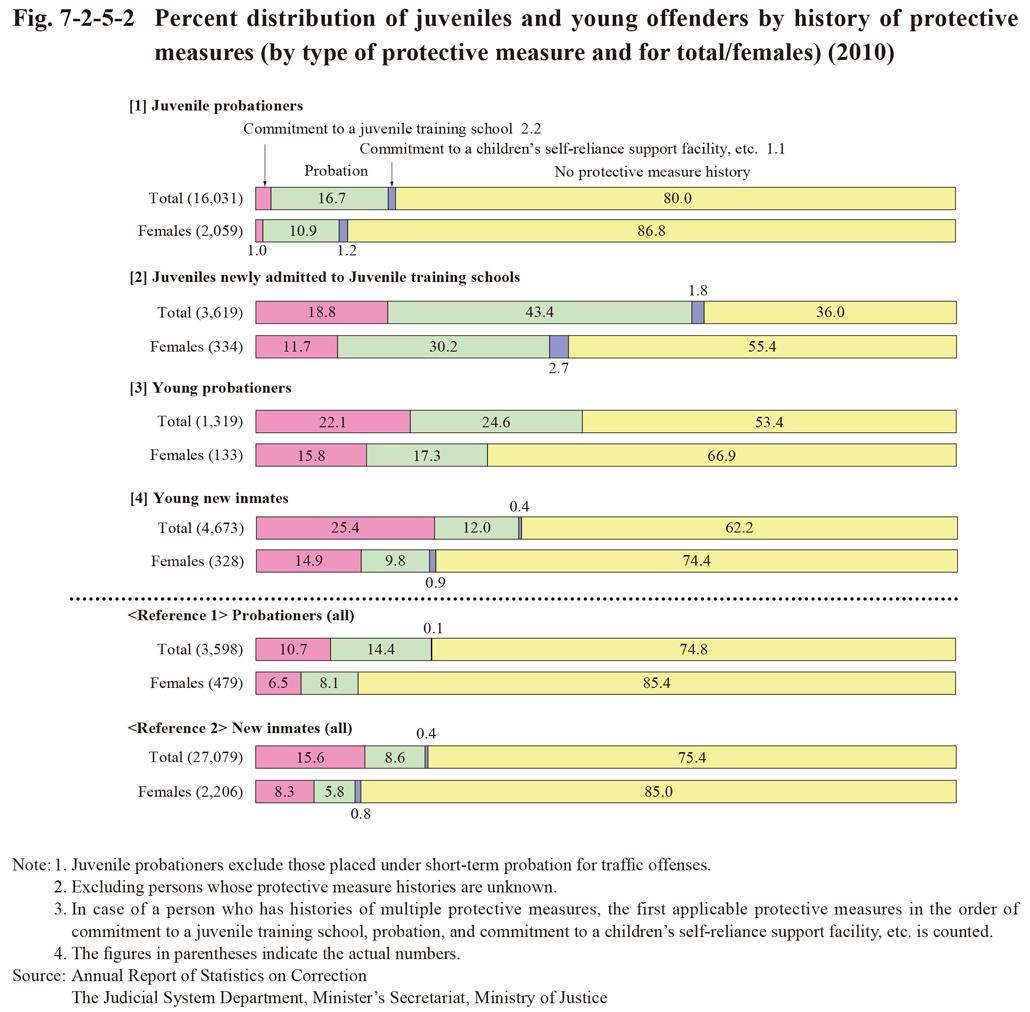
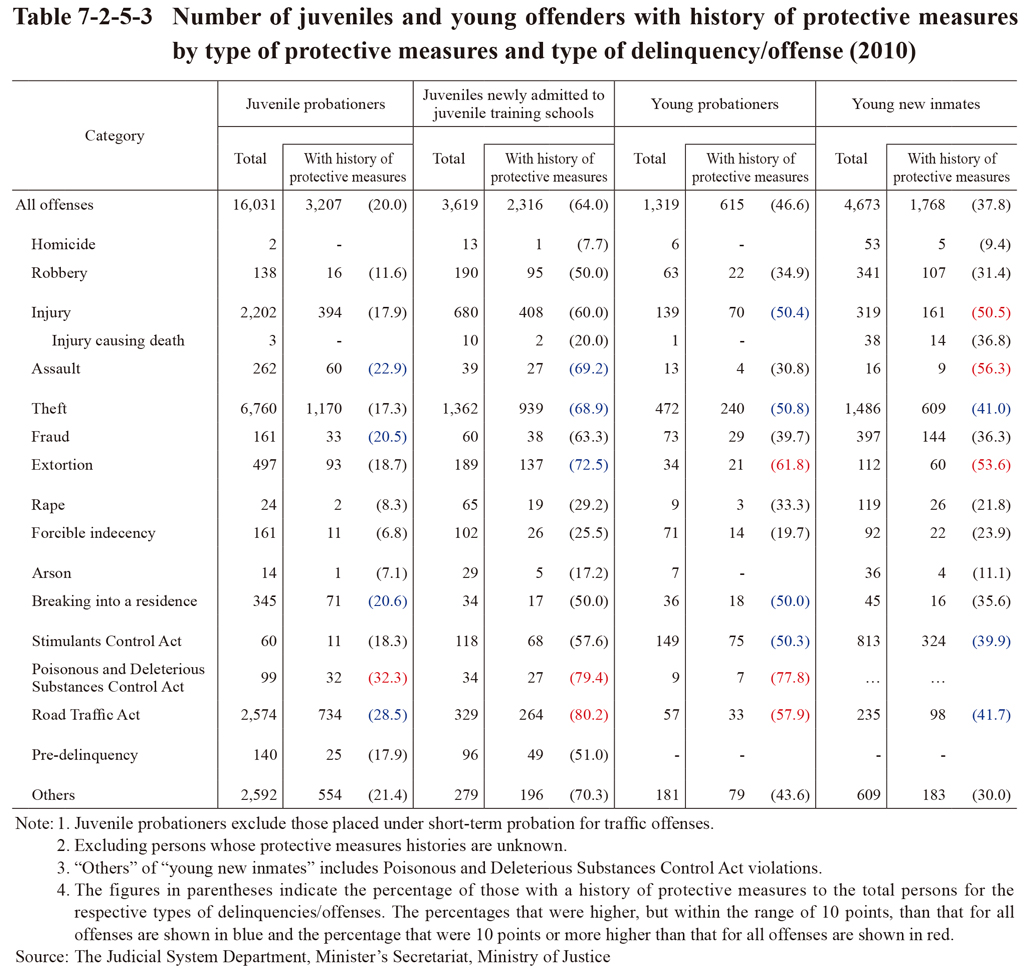
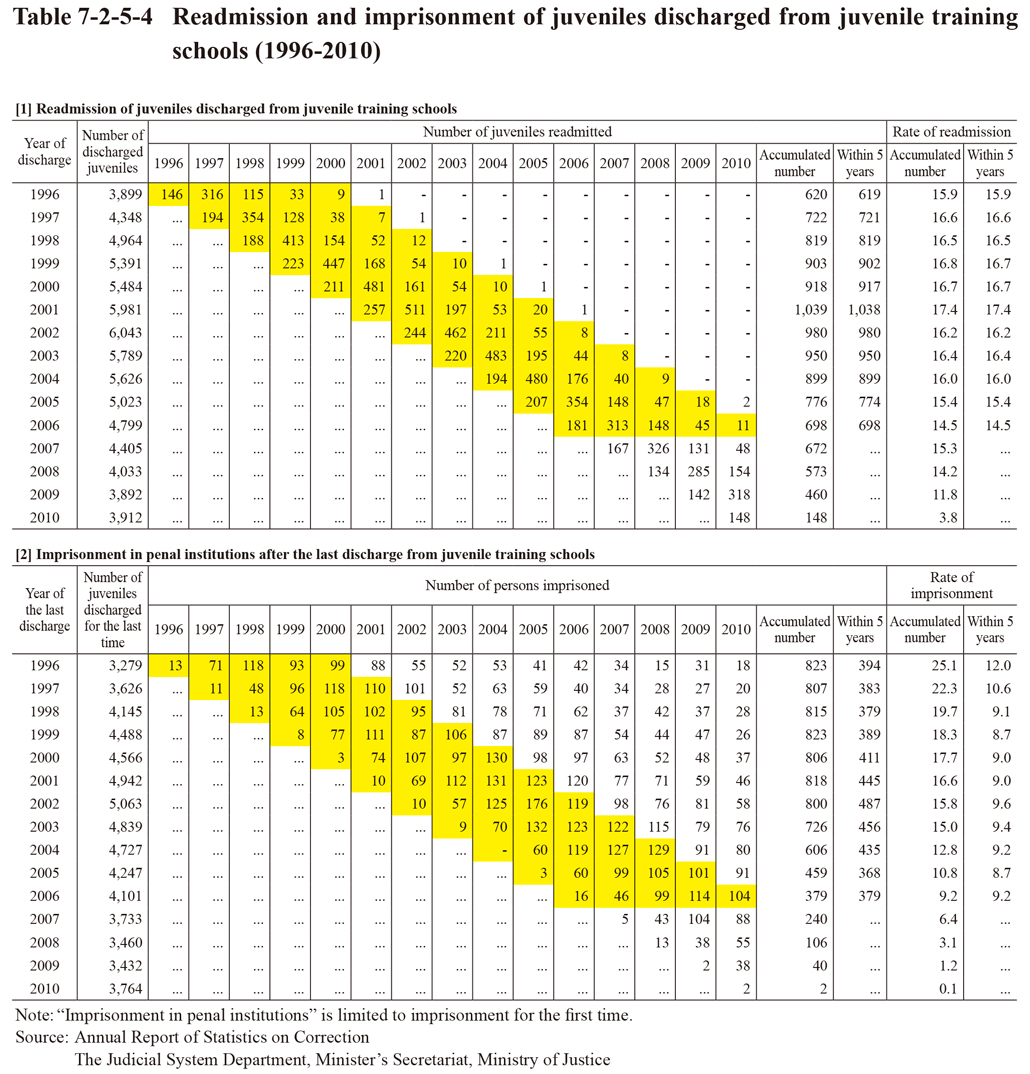
 Table 7-2-5-5 Reimprisonment of young released inmates (1996-2010)
 Table 7-2-5-7 Redisposition rate of young probationers/parolees (2001-2010)
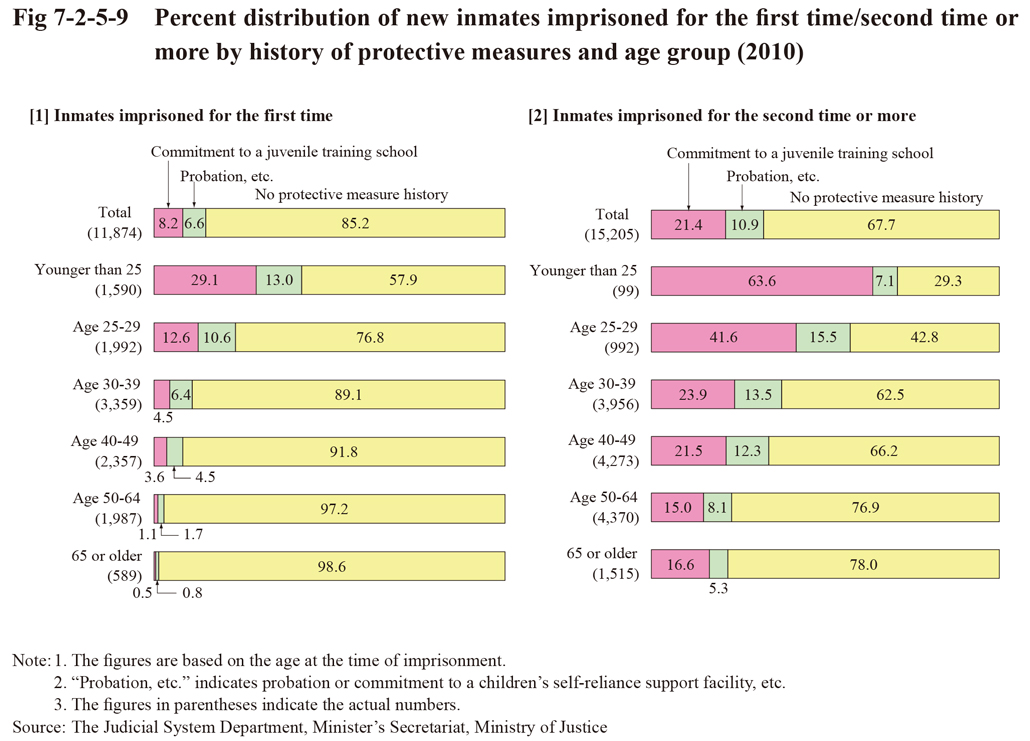
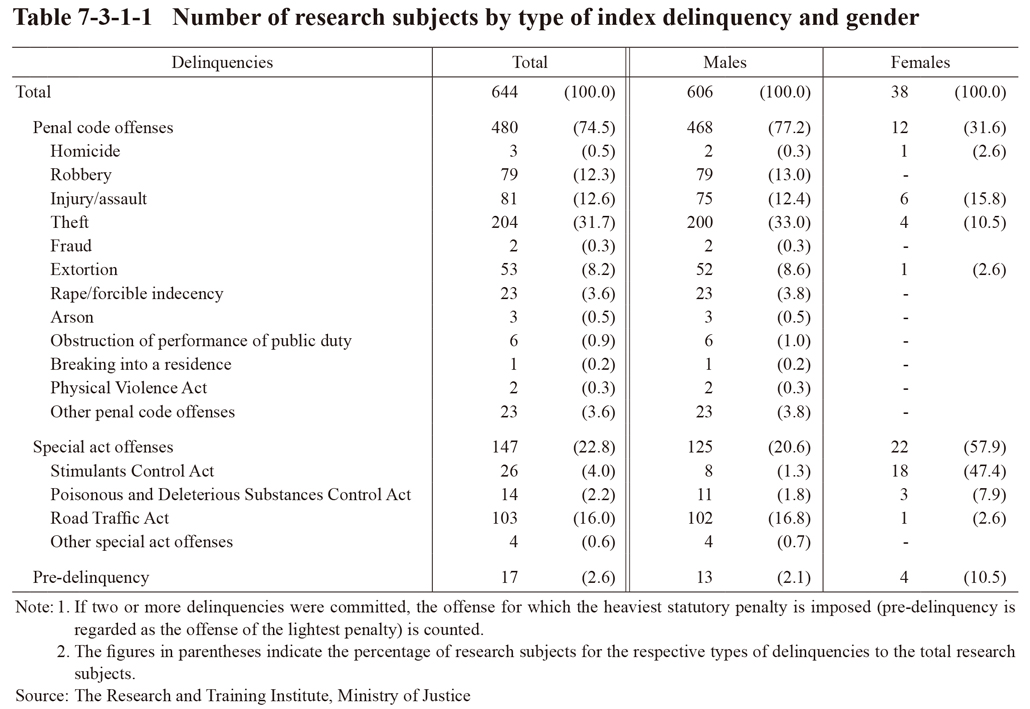 Table 7-3-1-1 Number of research subjects by type of index delinquency and gender
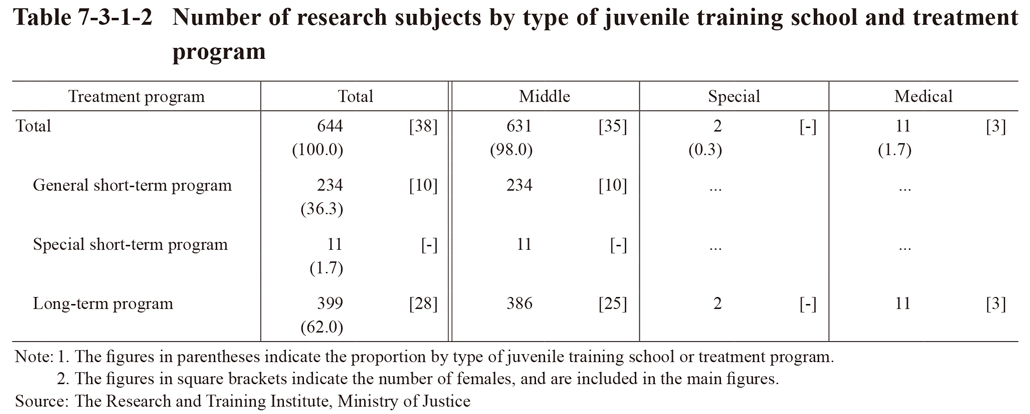 Table 7-3-1-2 Number of research subjects by type of juvenile training school and treatment program
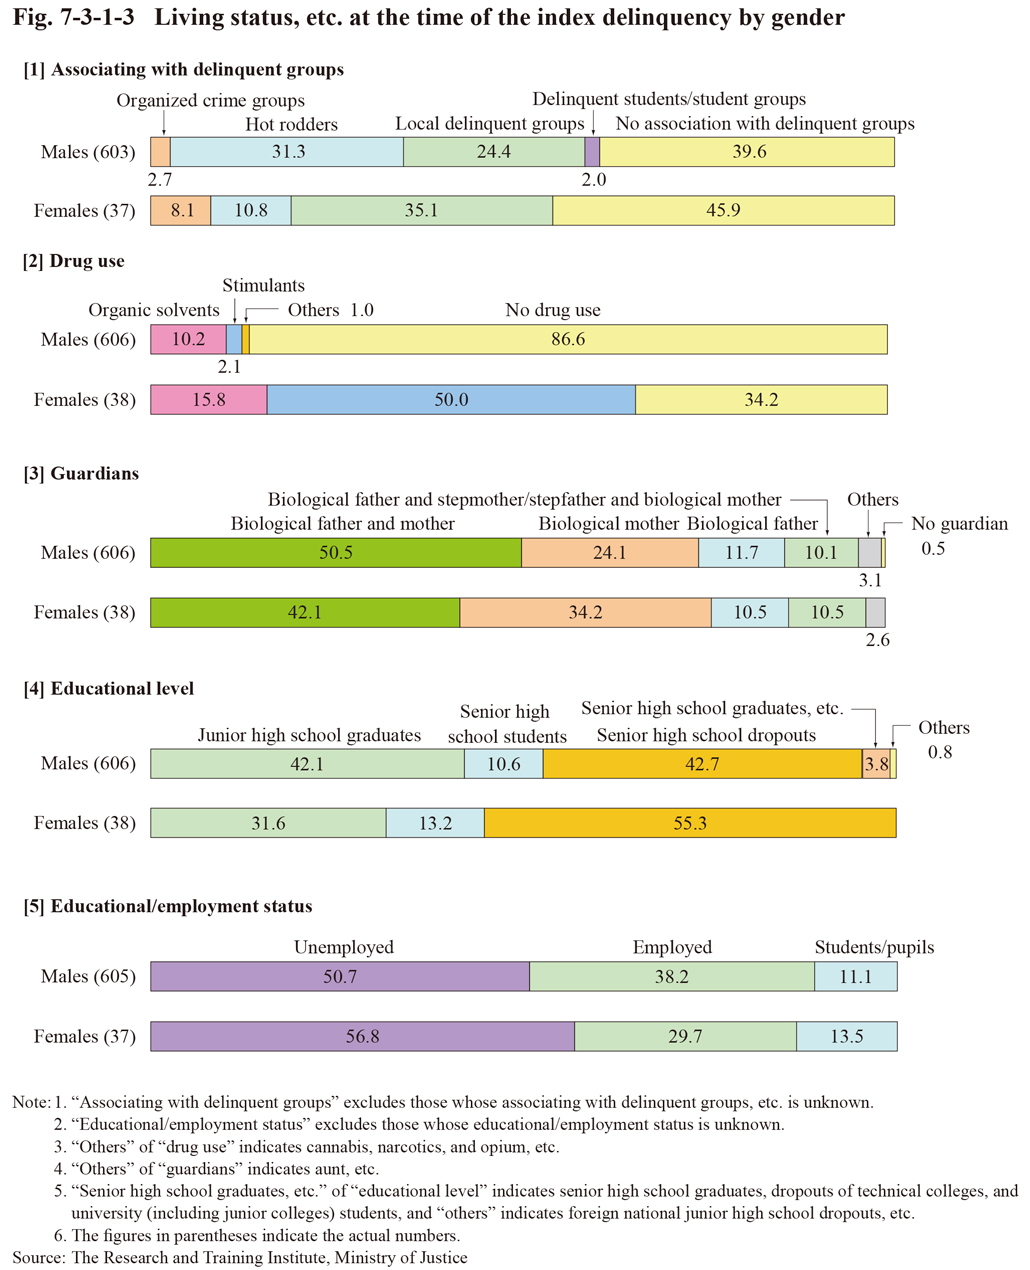 Fig. 7-3-1-3 Living status, etc. at the time of the index delinquency by gender
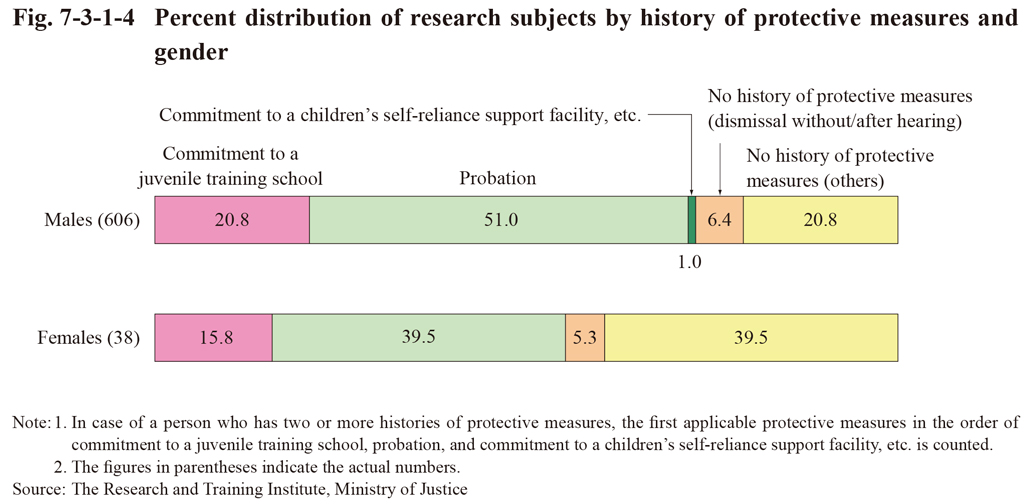 Fig. 7-3-1-4 Percent distribution of research subjects by history of protective measures and gender
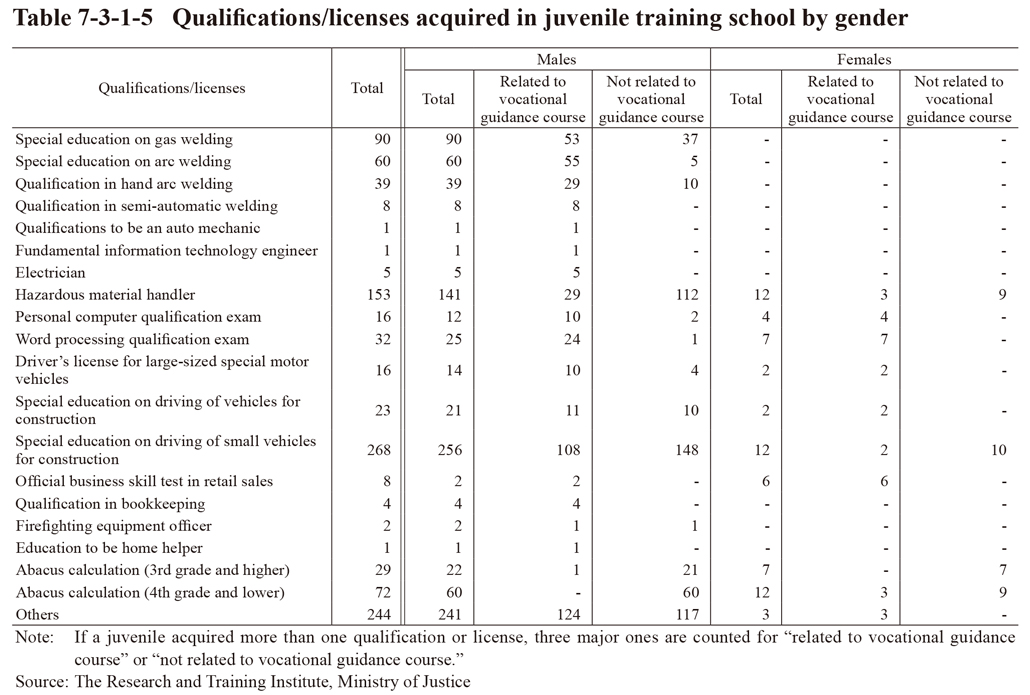 Table 7-3-1-5 Qualifications/licenses acquired in juvenile training school by gender
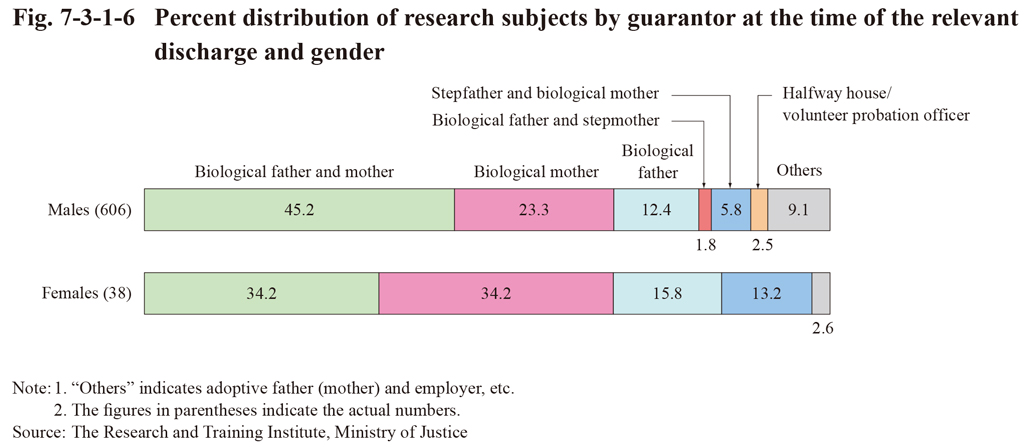
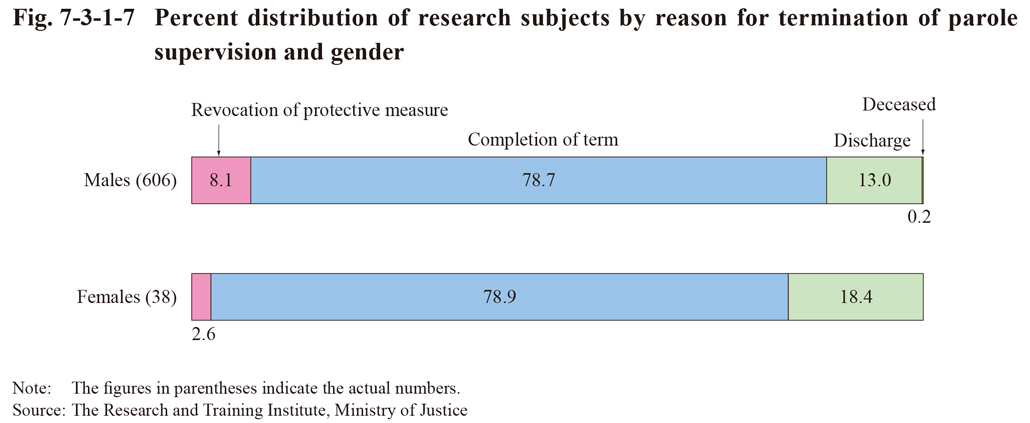
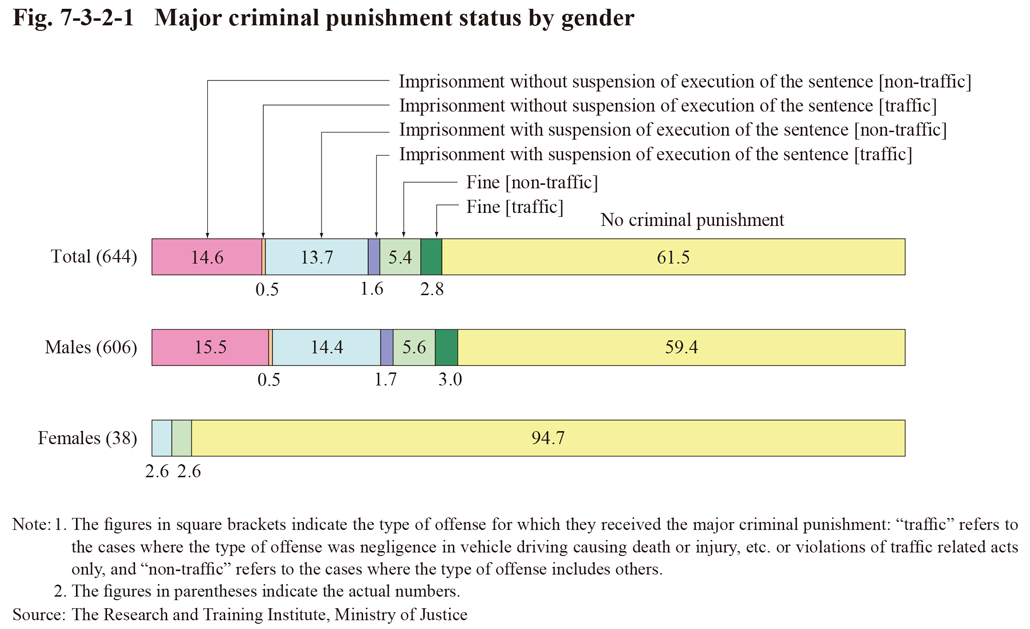 Fig. 7-3-2-1 Major criminal punishment status by gender
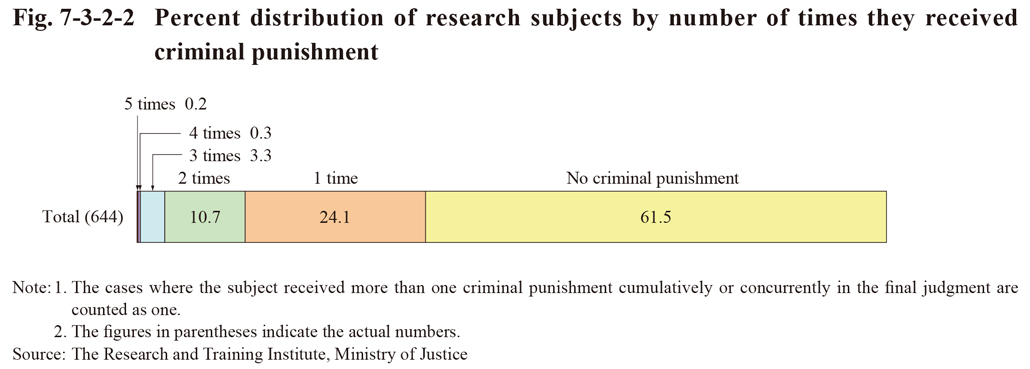
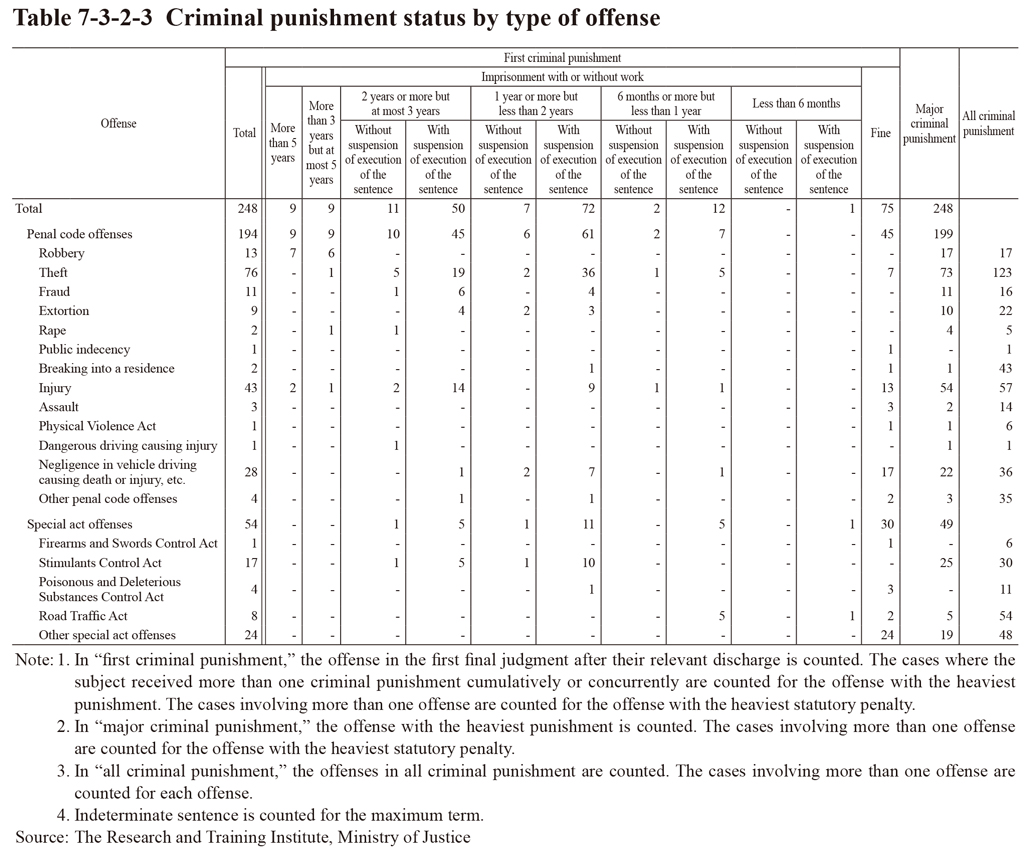 Table 7-3-2-3 Criminal punishment status by type of offense
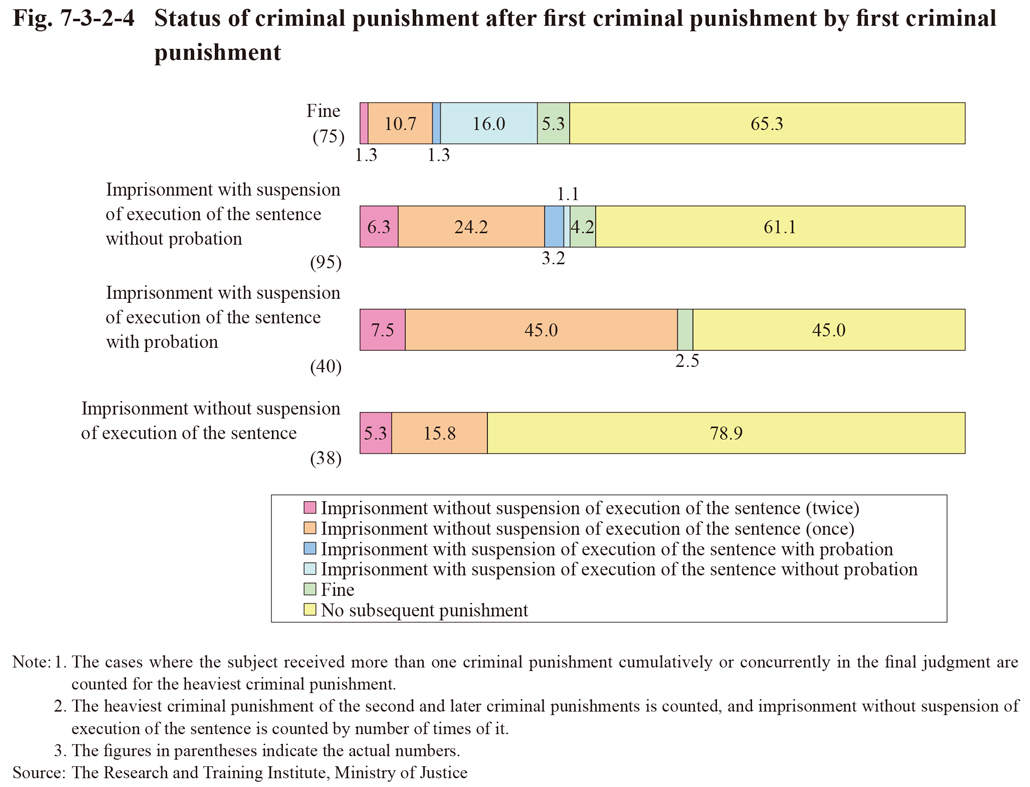
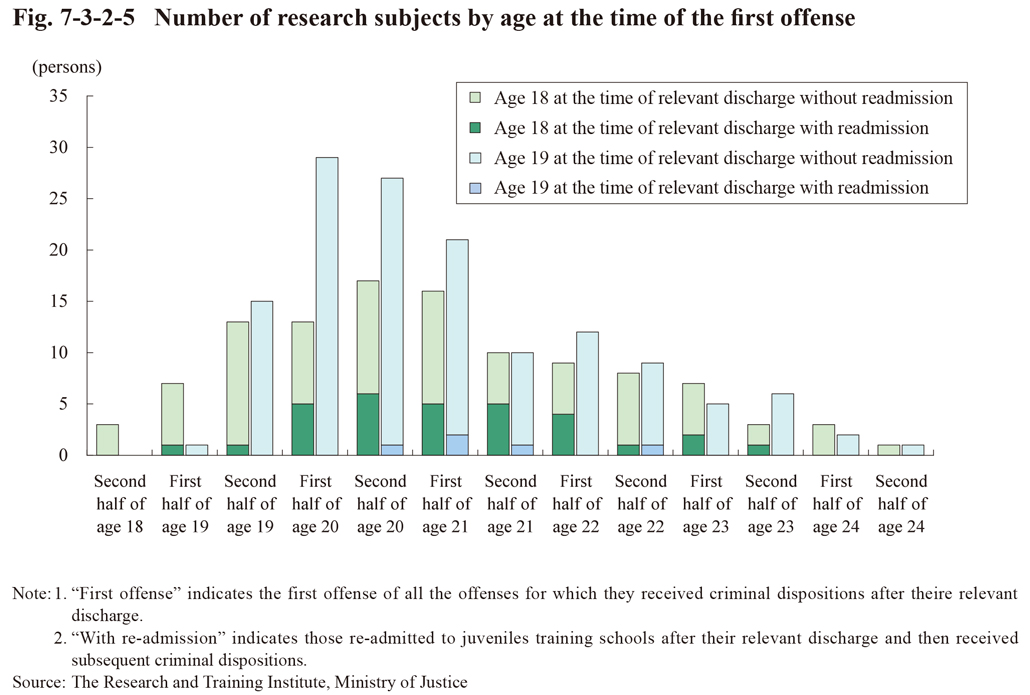 Fig. 7-3-2-5 Number of research subjects by age at the time of the first offense
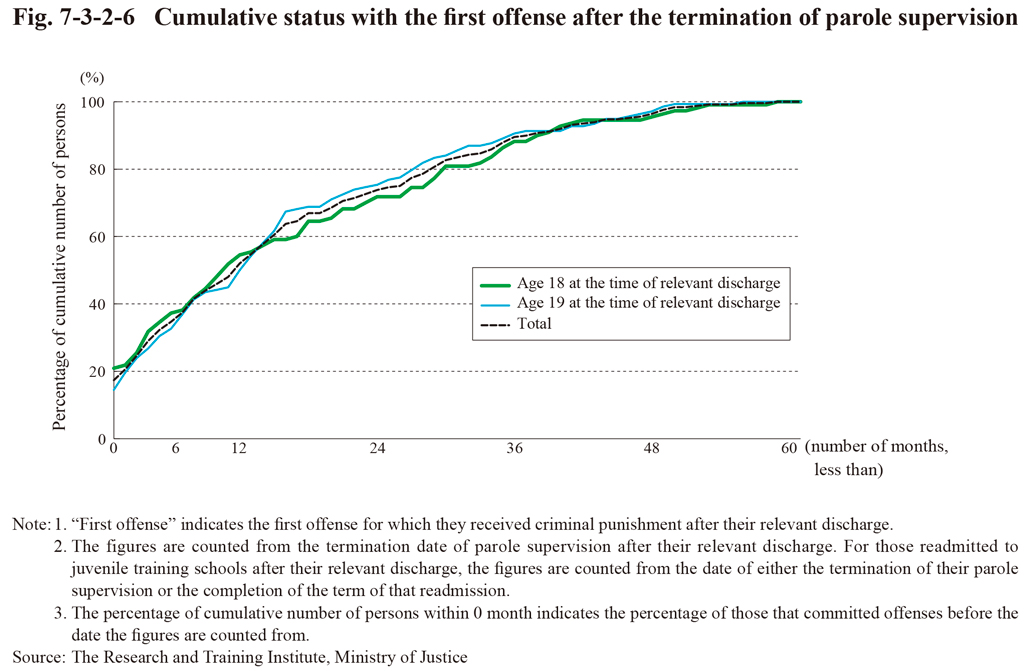 Fig. 7-3-2-6 Cumulative status with the first offense after the termination of parole supervision
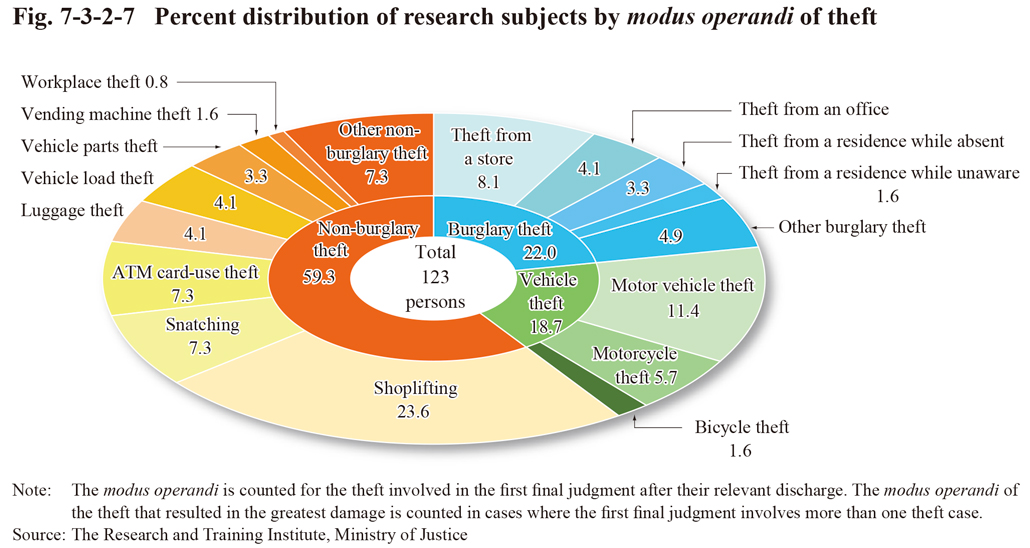 Fig. 7-3-2-7 Percent distribution of research subjects by modus operandi of theft
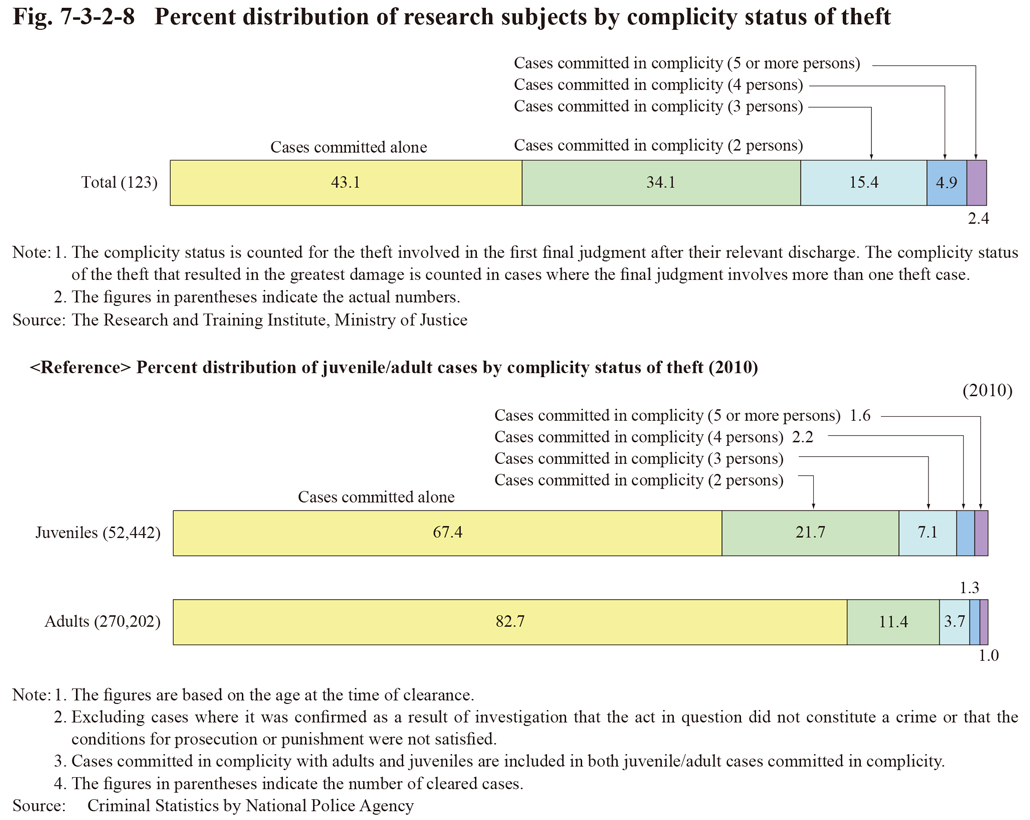 Fig. 7-3-2-8 Percent distribution of research subjects by complicity status of theft
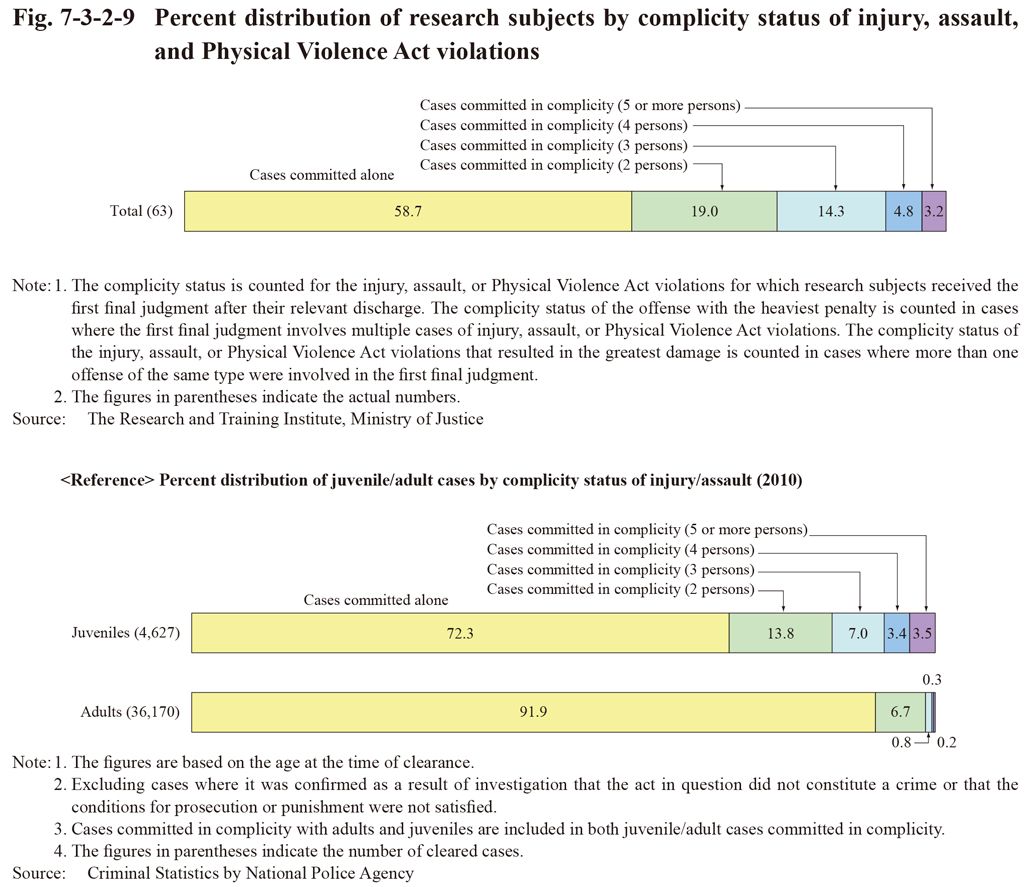
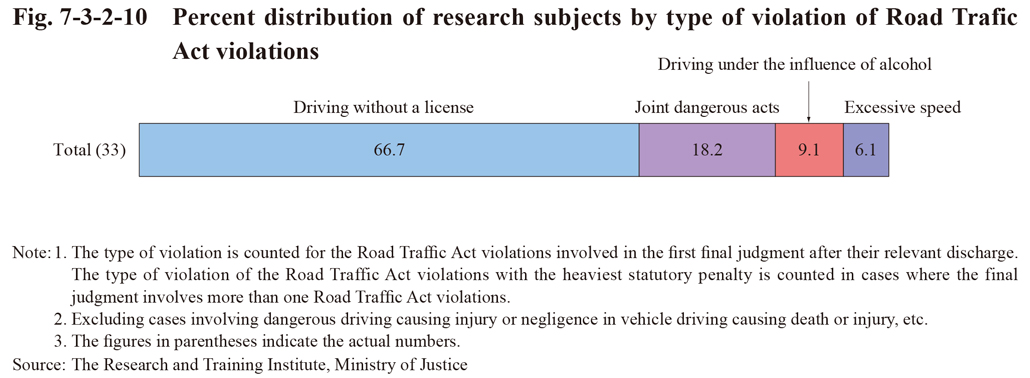
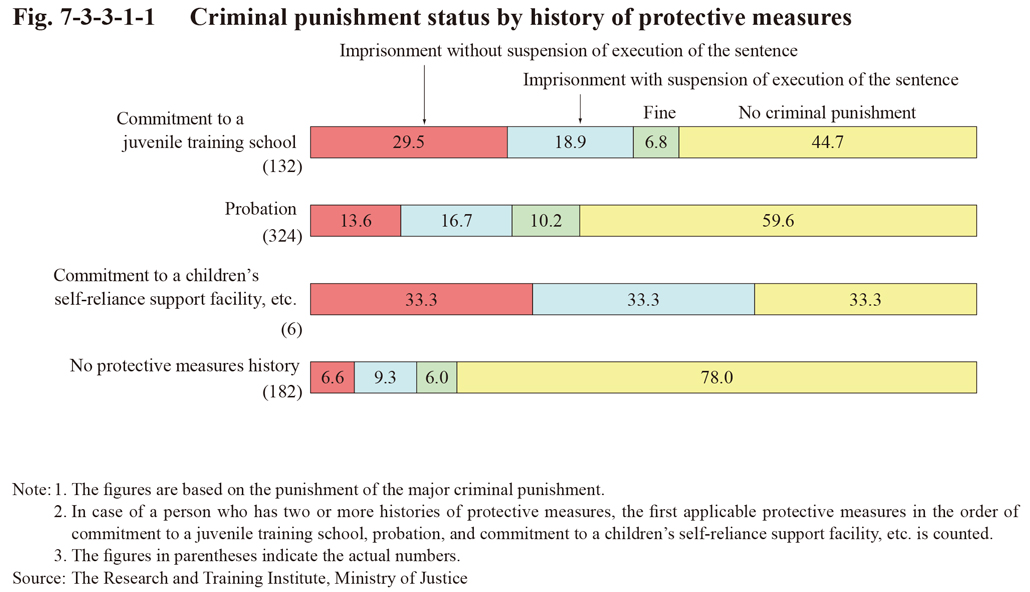 Fig. 7-3-3-1-1 Criminal punishment status by history of protective measures
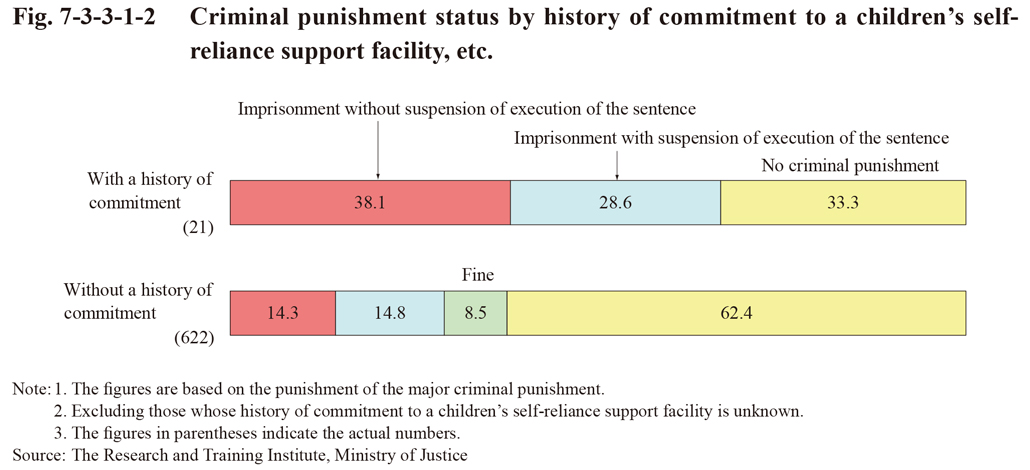
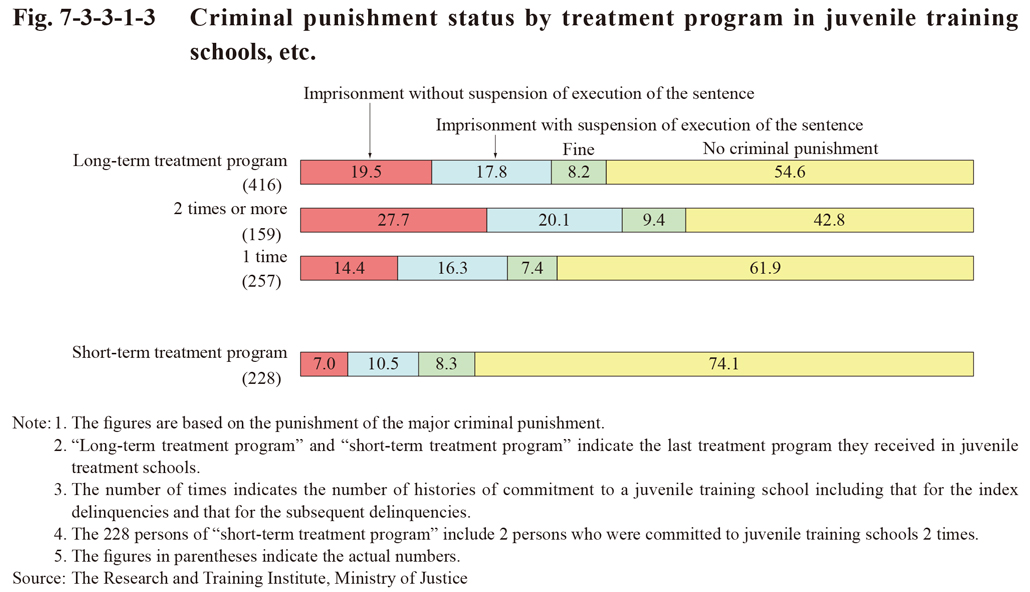 Fig. 7-3-3-1-3 Criminal punishment status by treatment program in juvenile training schools, etc.
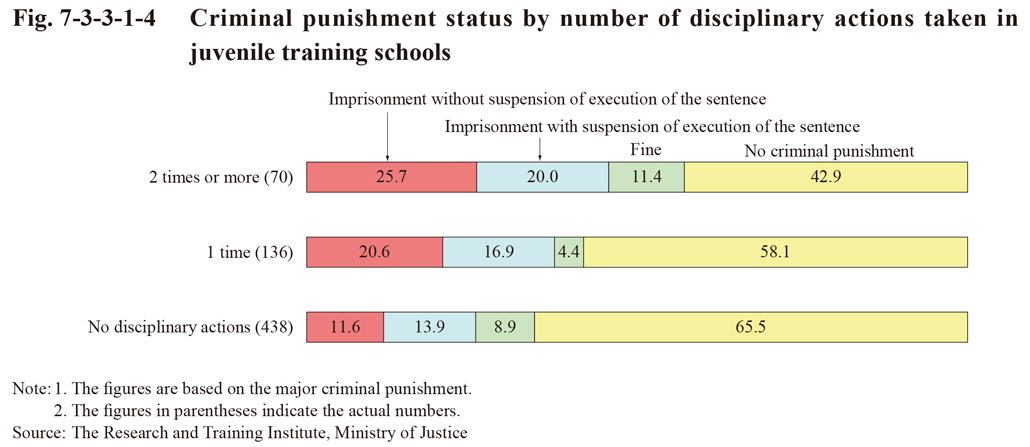
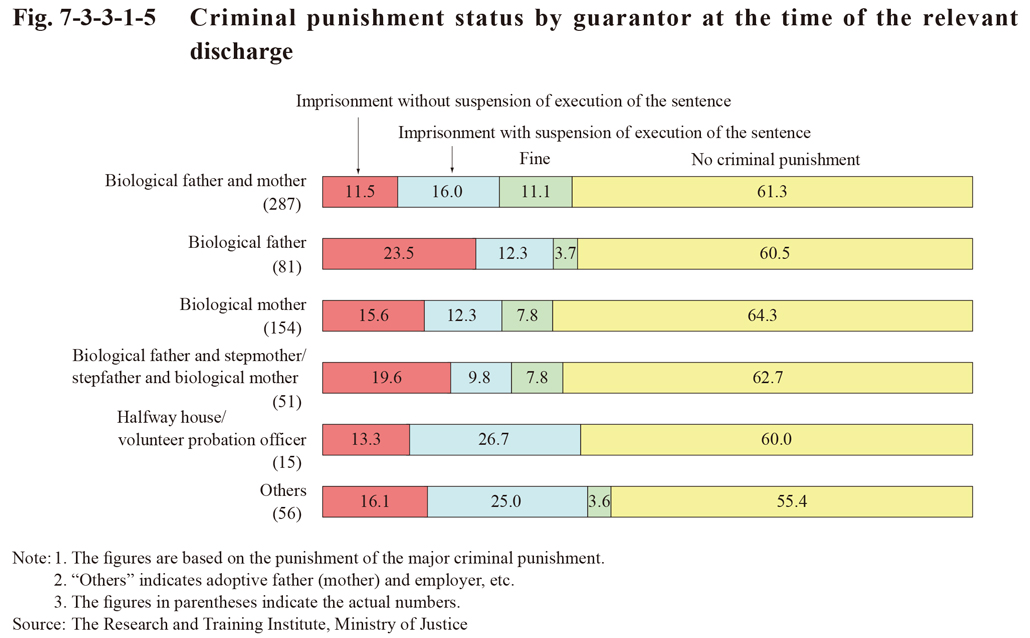 Fig. 7-3-3-1-5 Criminal punishment status by guarantor at the time of the relevant discharge
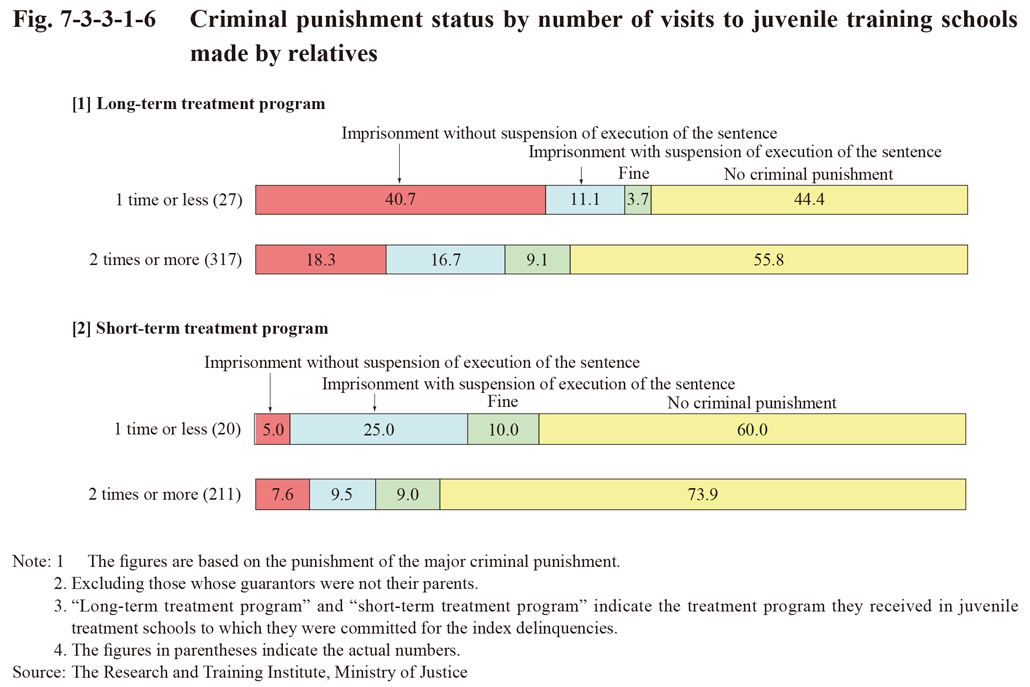
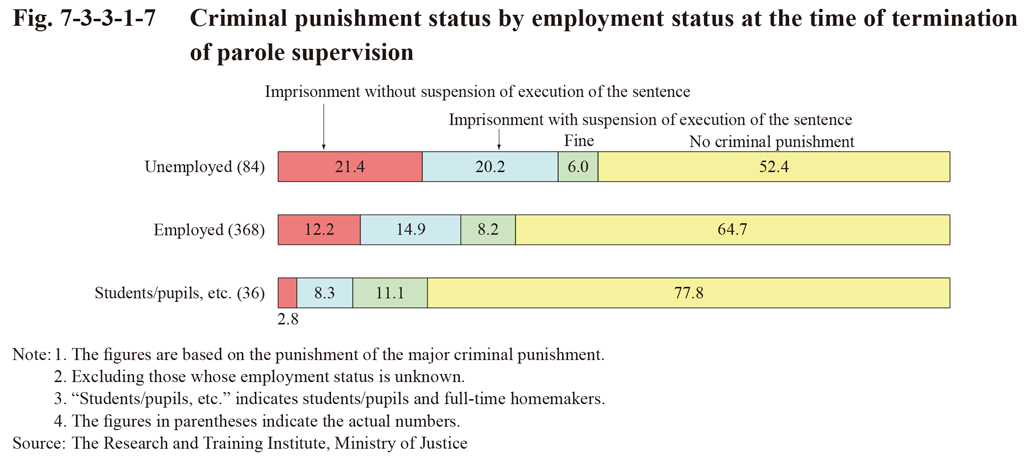
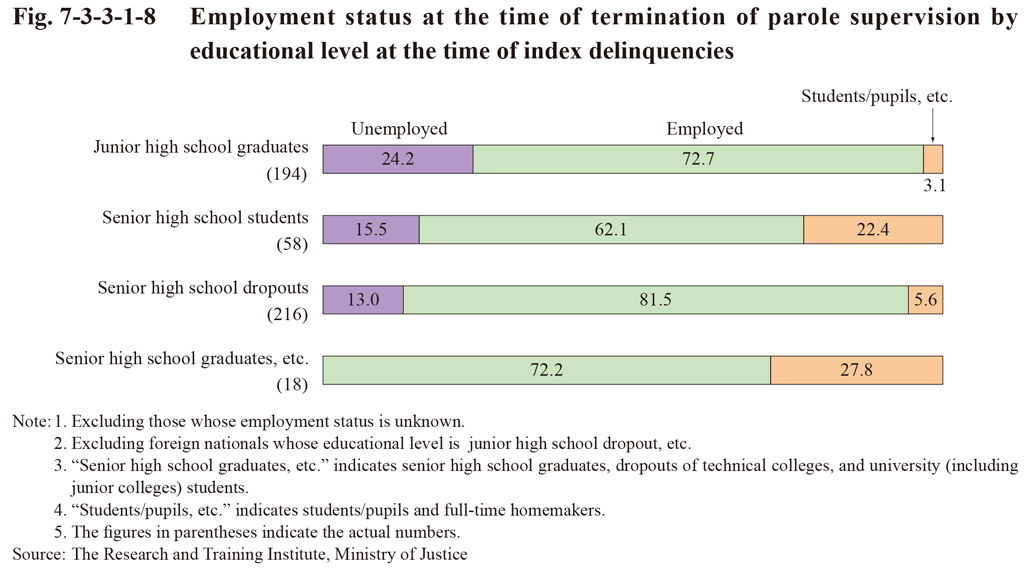
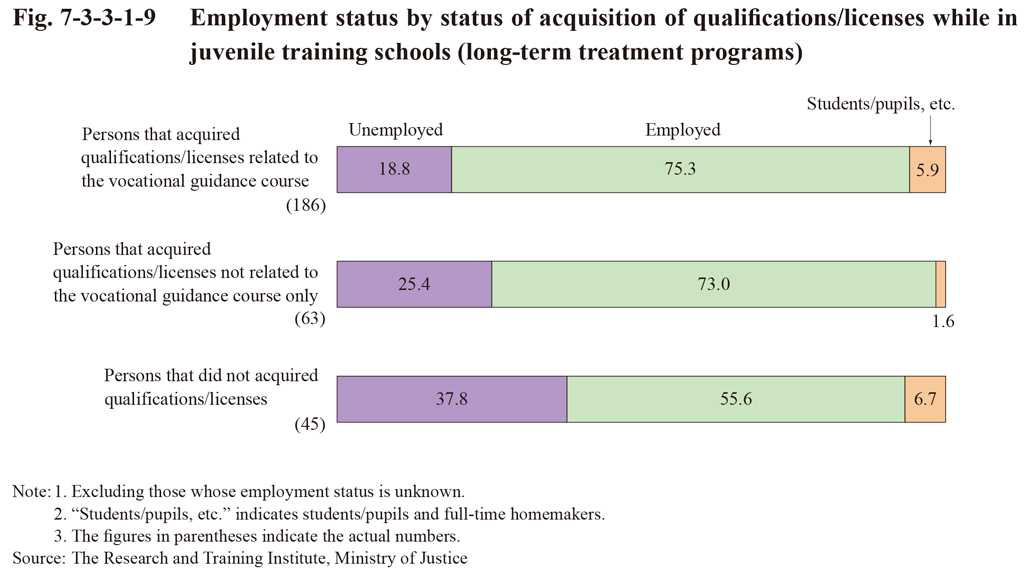
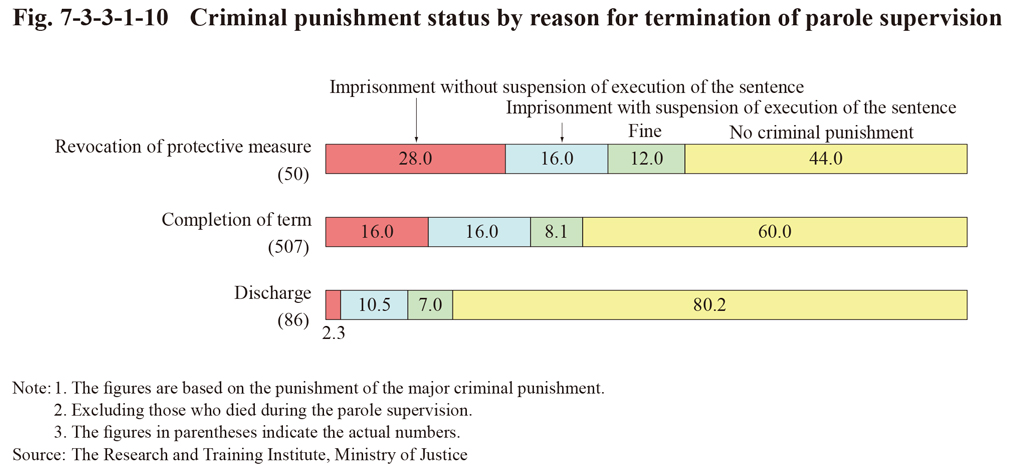 Fig. 7-3-3-1-10 Criminal punishment status by reason for termination of parole supervision
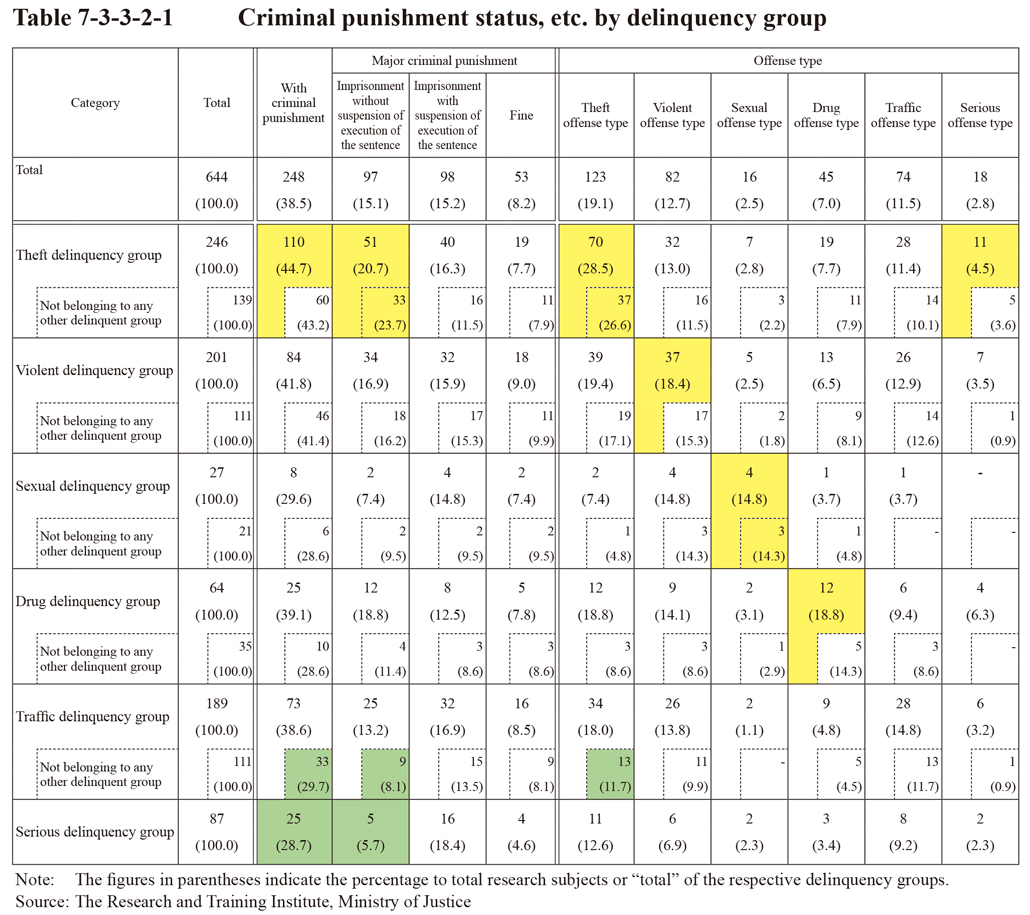 Table 7-3-3-2-1 Criminal punishment status, etc. by delinquency group
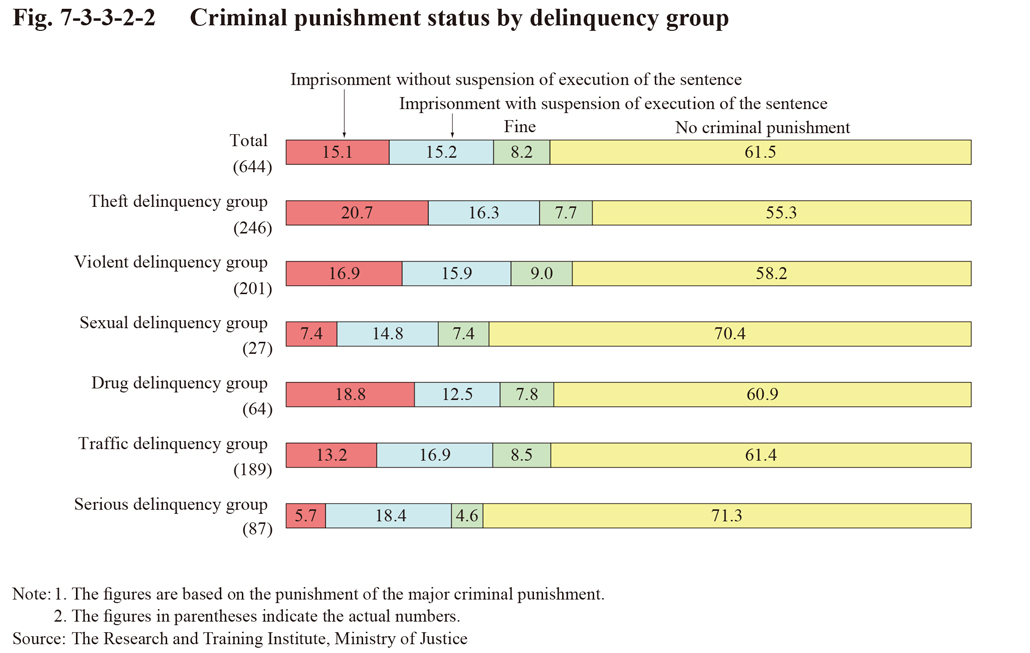 Fig. 7-3-3-2-2 Criminal punishment status by delinquency group
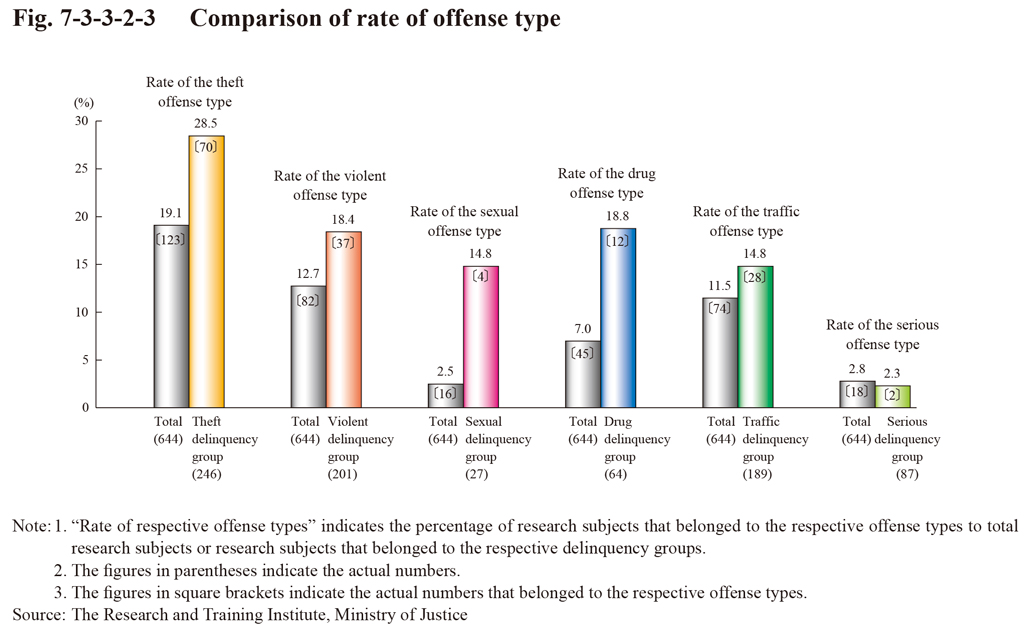 Fig. 7-3-3-2-3 Comparison of rate of offense type
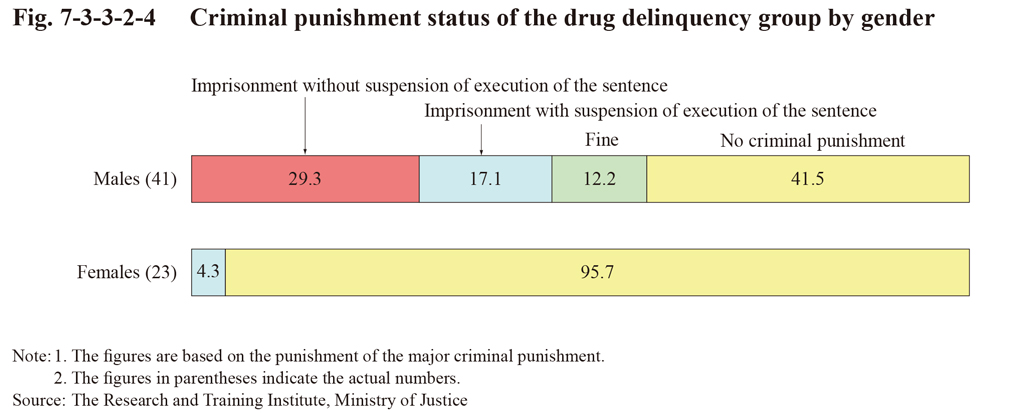 Fig. 7-3-3-2-4 Criminal punishment status of the drug delinquency group by gender
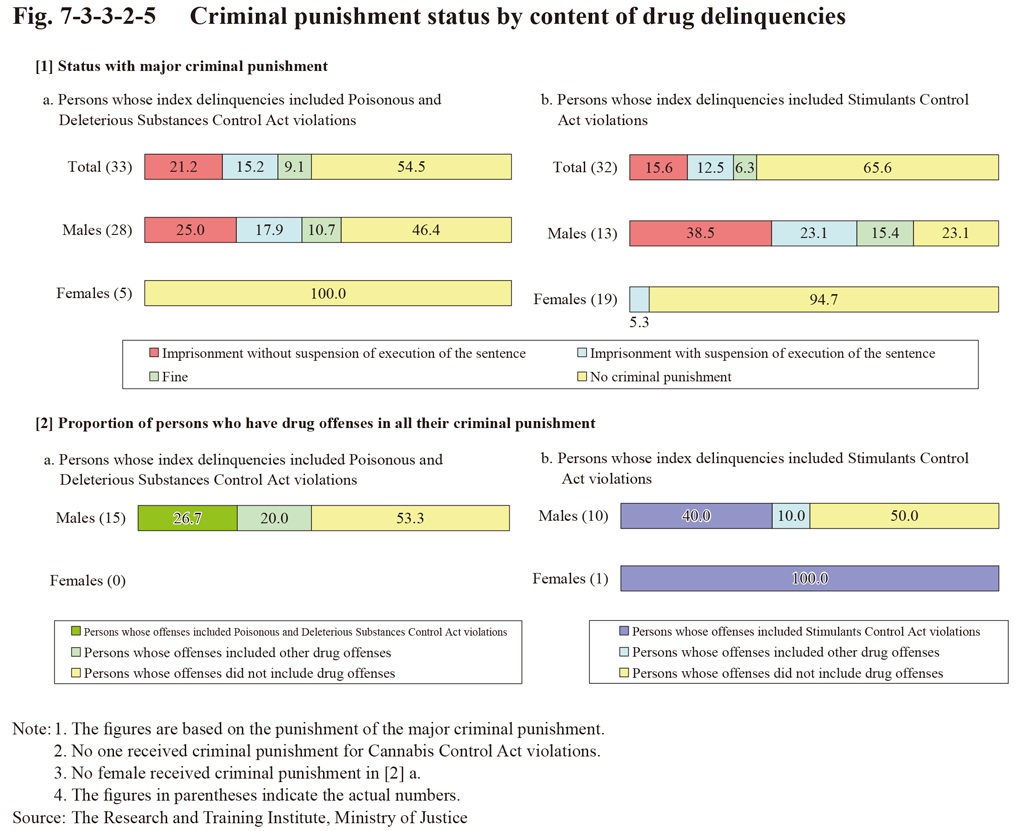 Fig. 7-3-3-2-5 Criminal punishment status by content of drug delinquencies
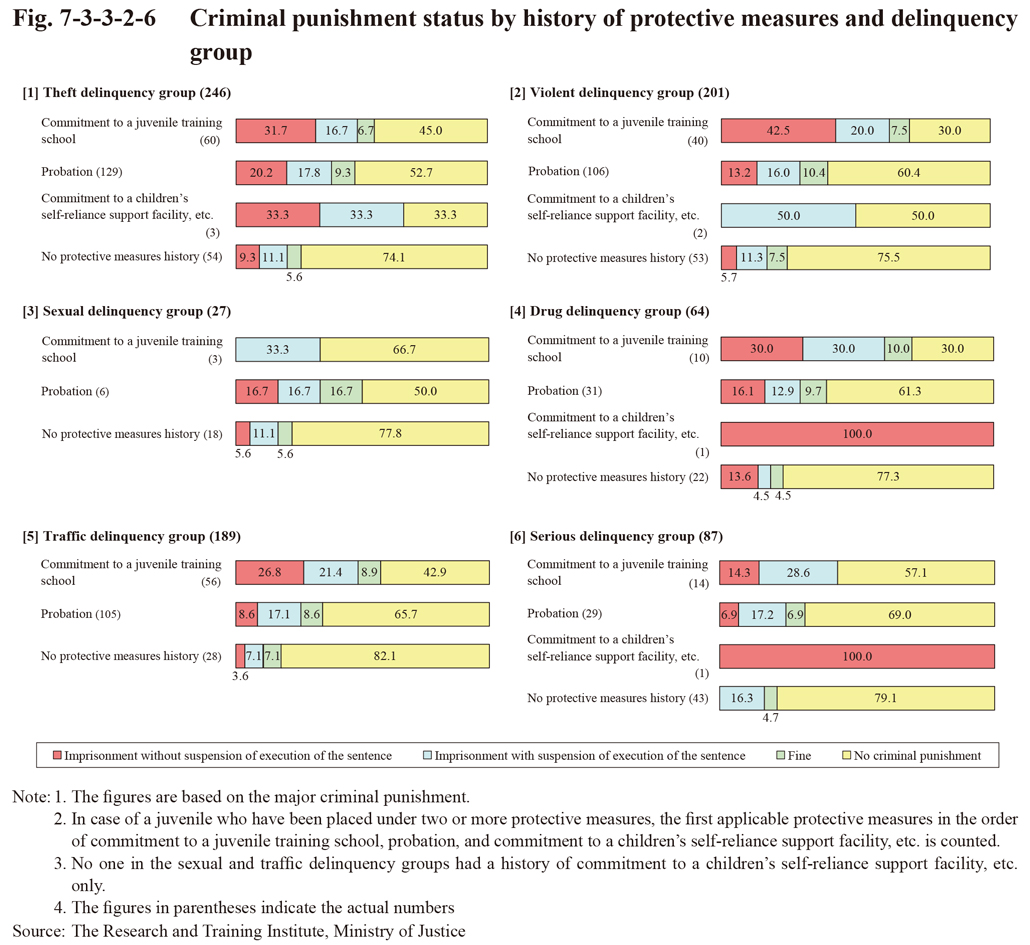 Fig. 7-3-3-2-6 Criminal punishment status by history of protective measures and delinquency group
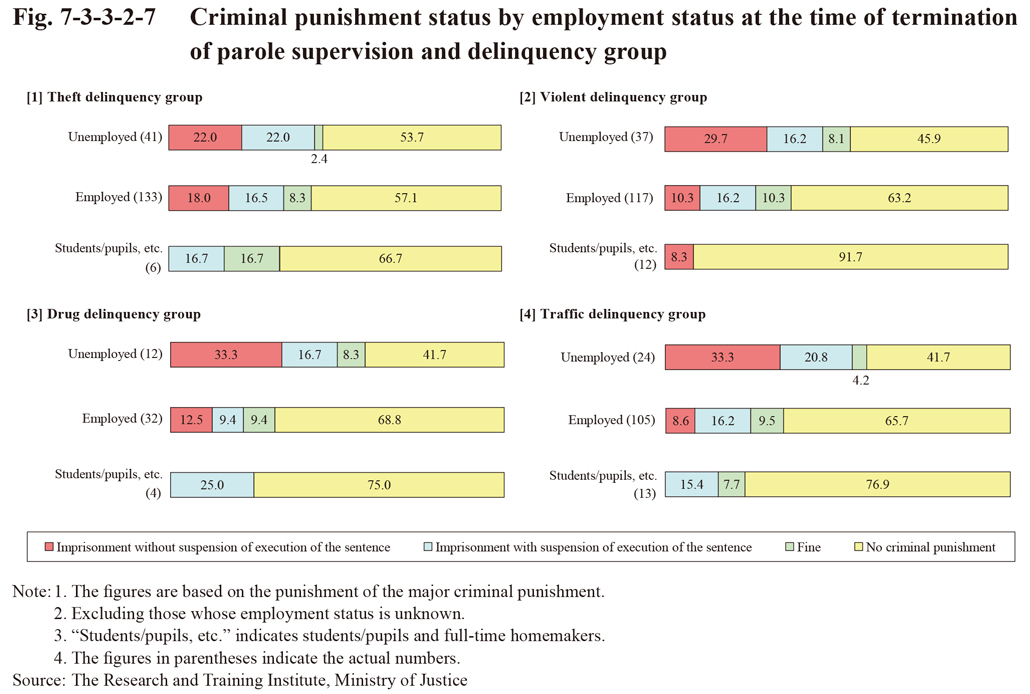
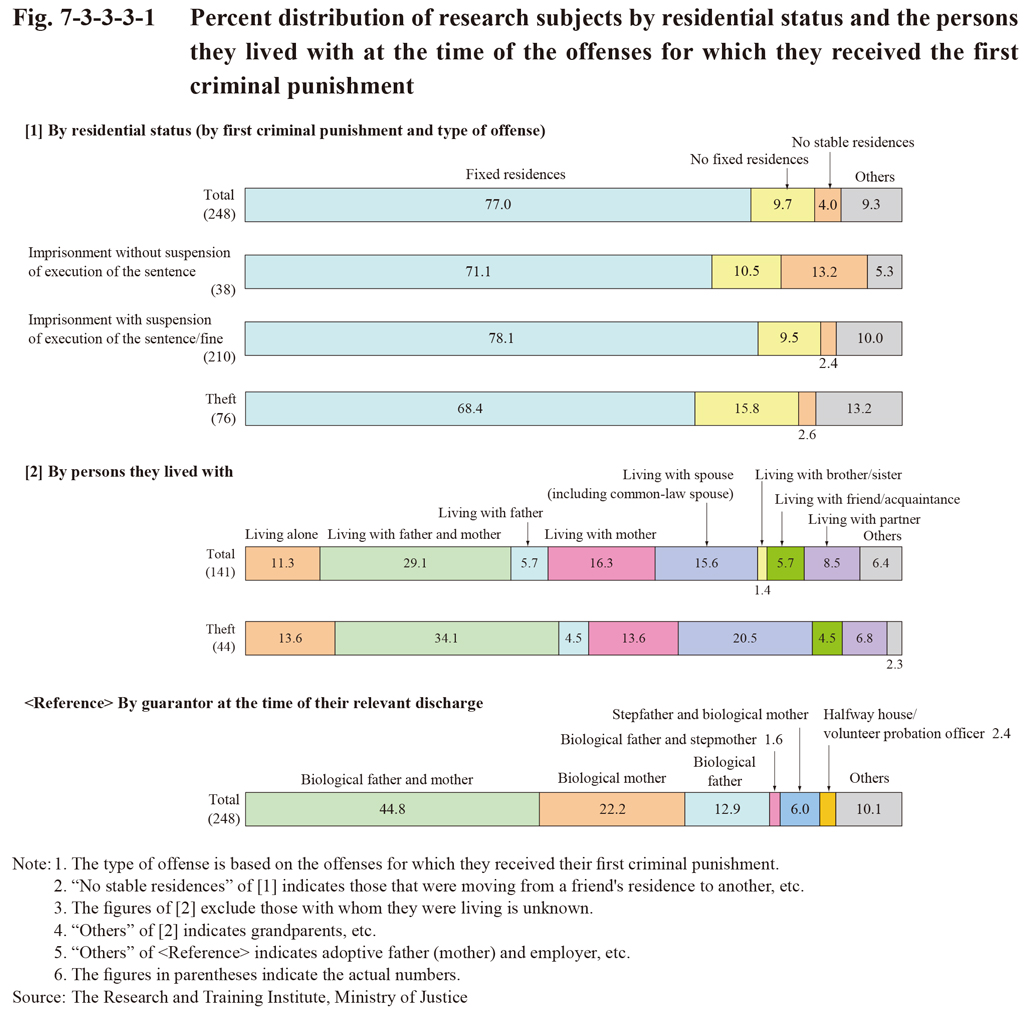
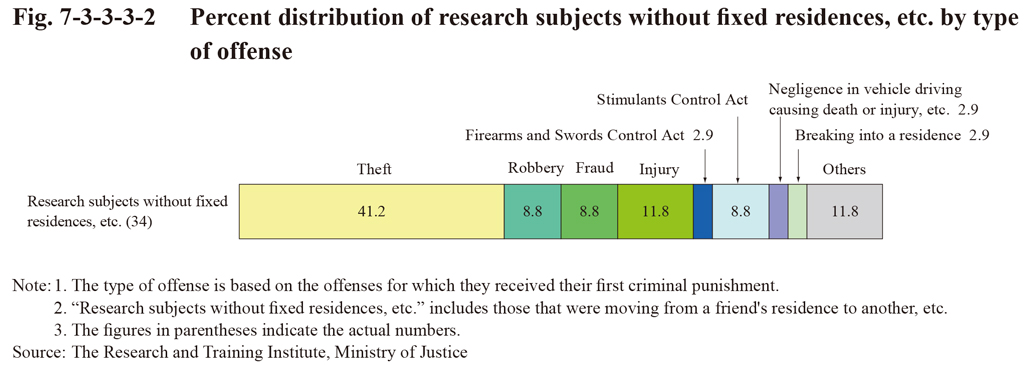
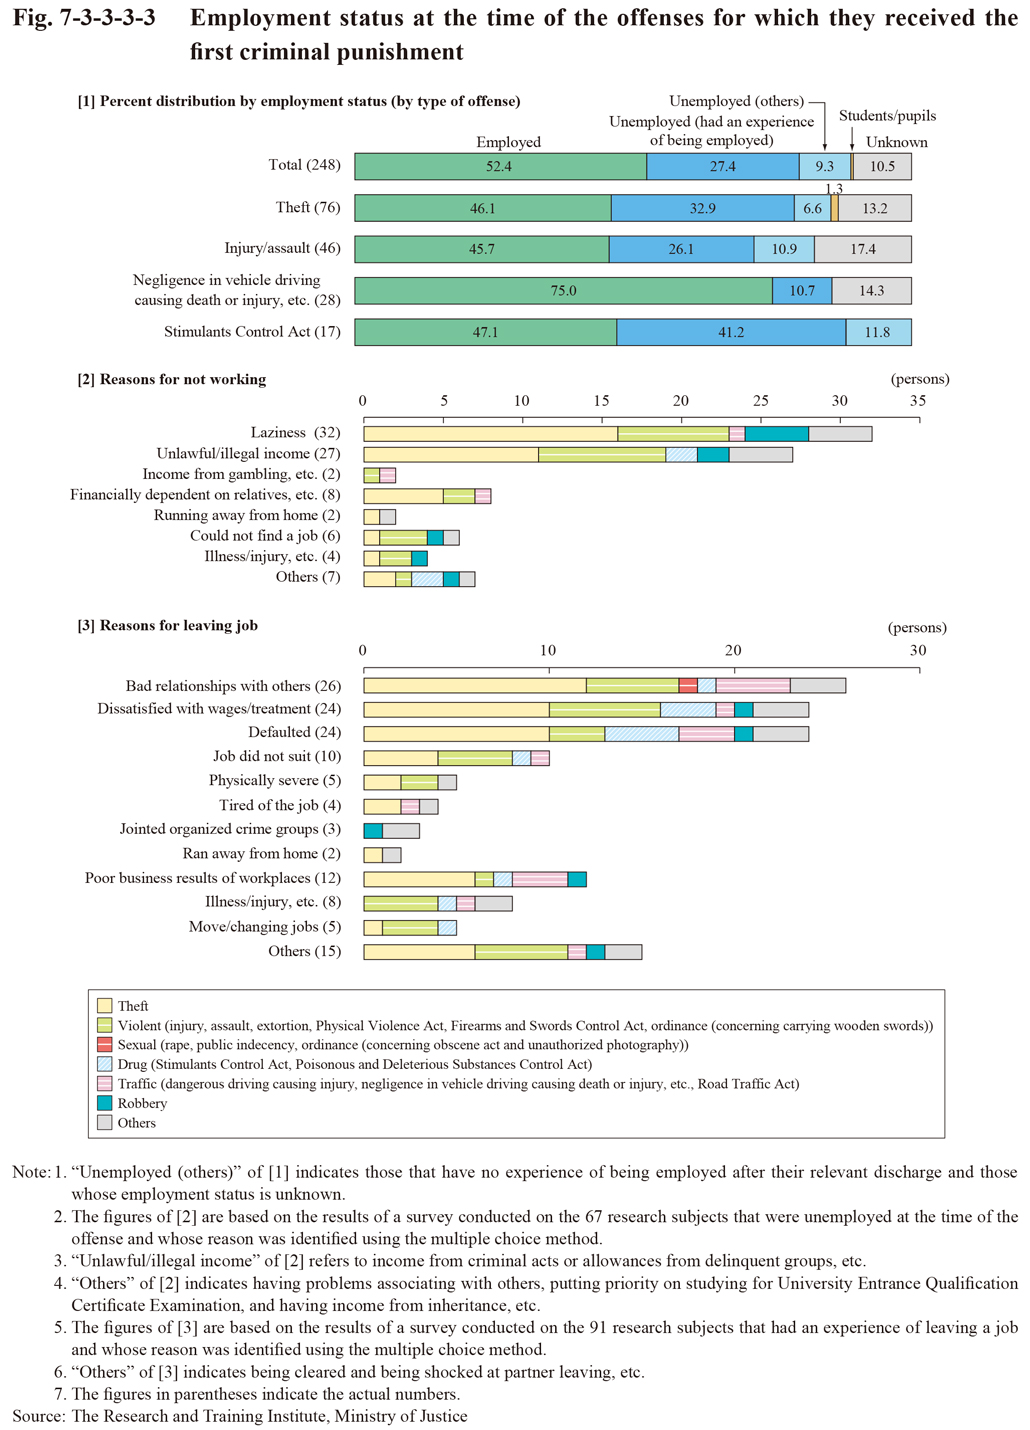
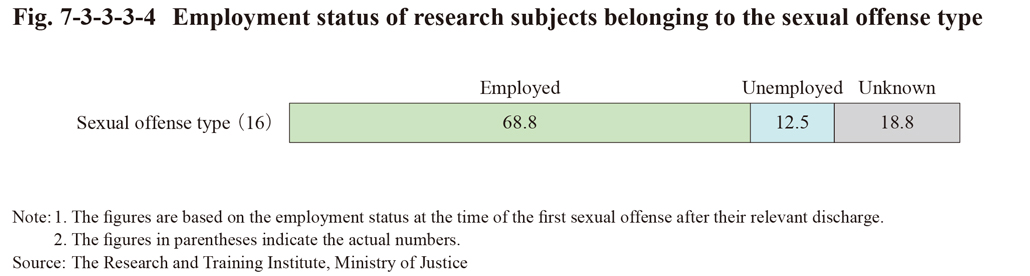 Fig. 7-3-3-3-4 Employment status of research subjects belonging to the sexual offense type
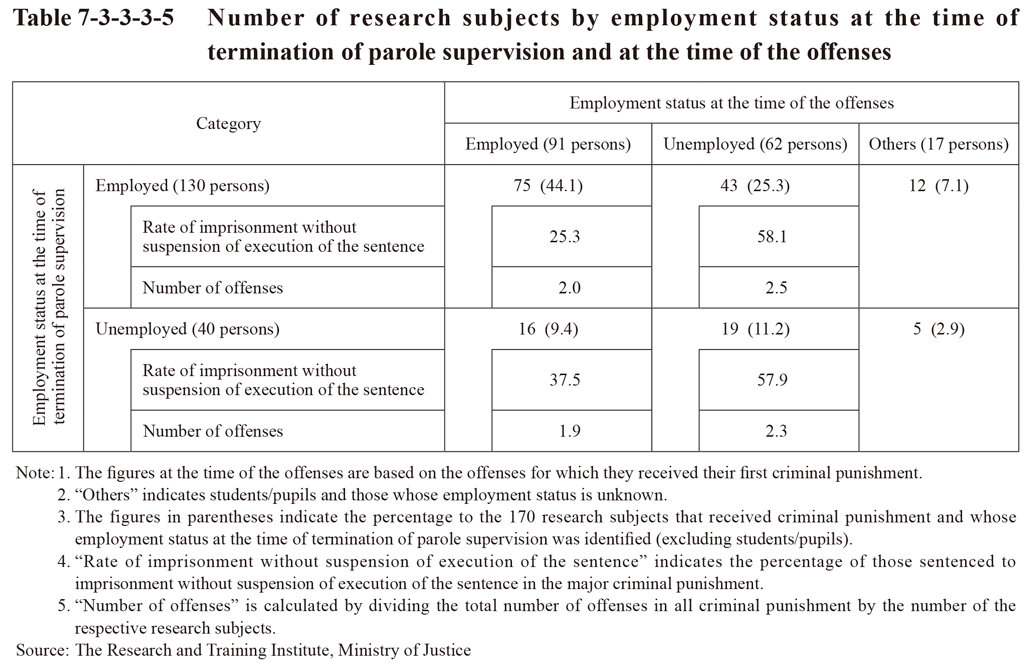
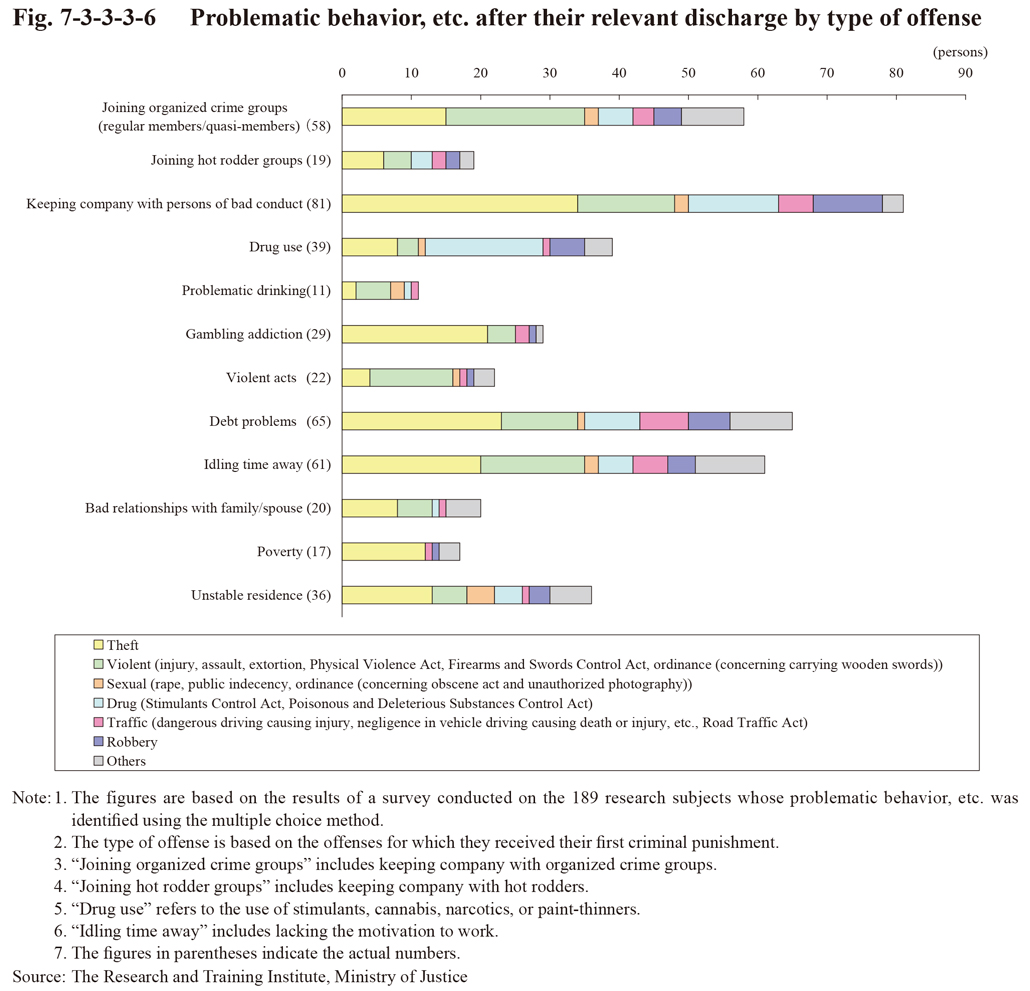 Fig. 7-3-3-3-6 Problematic behavior, etc. after their relevant discharge by type of offense
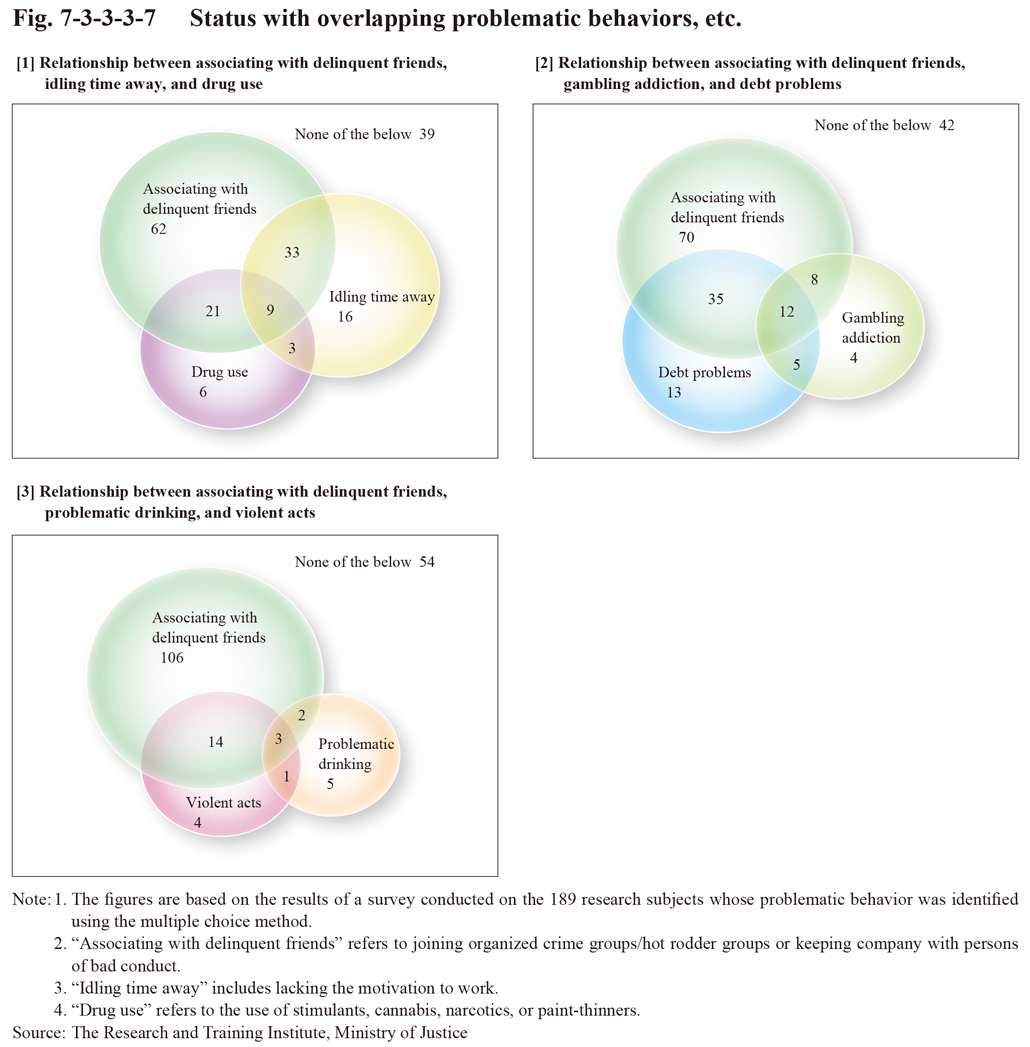 Fig. 7-3-3-3-7 Status with overlapping problematic behaviors, etc.
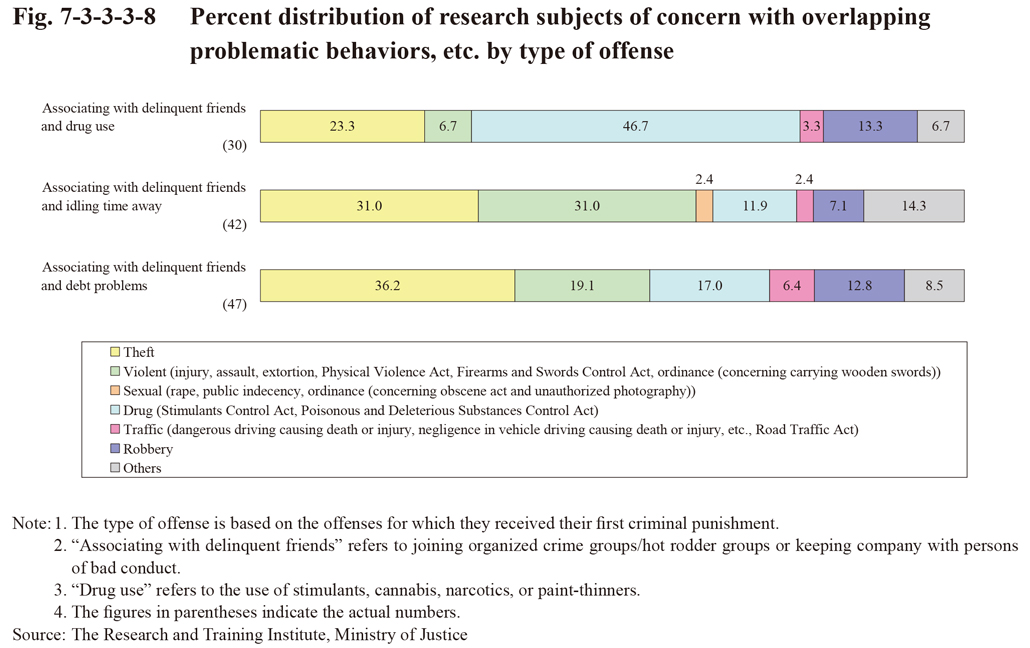
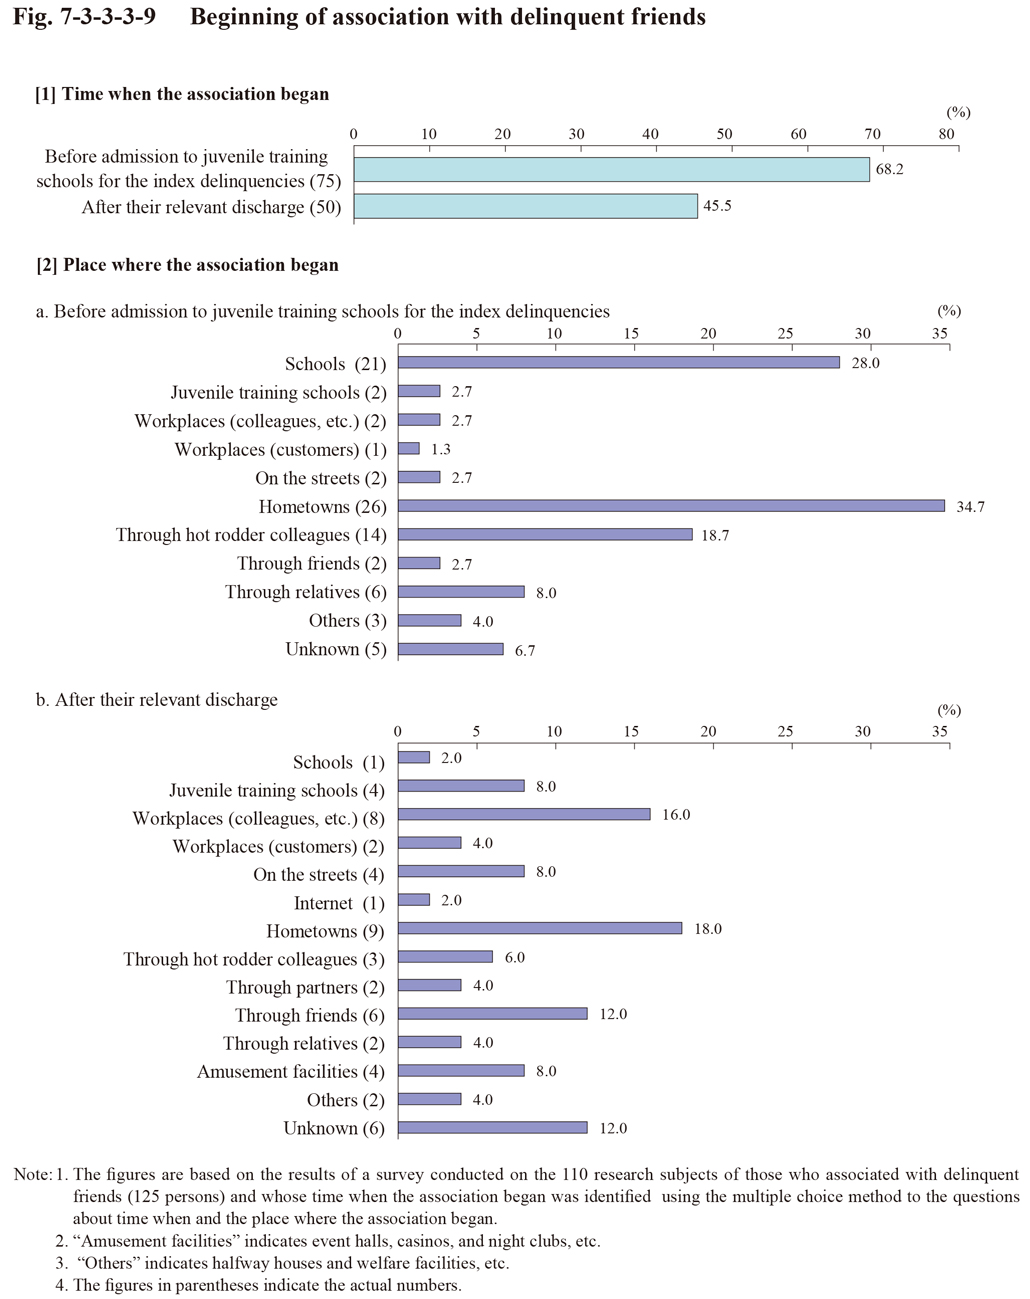 Fig. 7-3-3-3-9 Beginning of association with delinquent friends
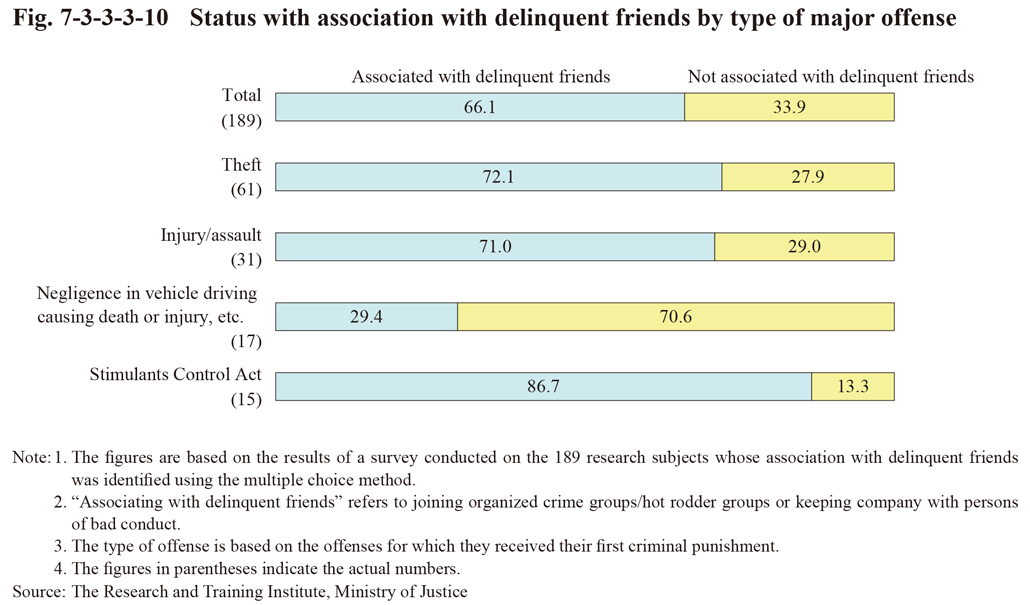 Fig. 7-3-3-3-10 Status with association with delinquent friends by type of major offense
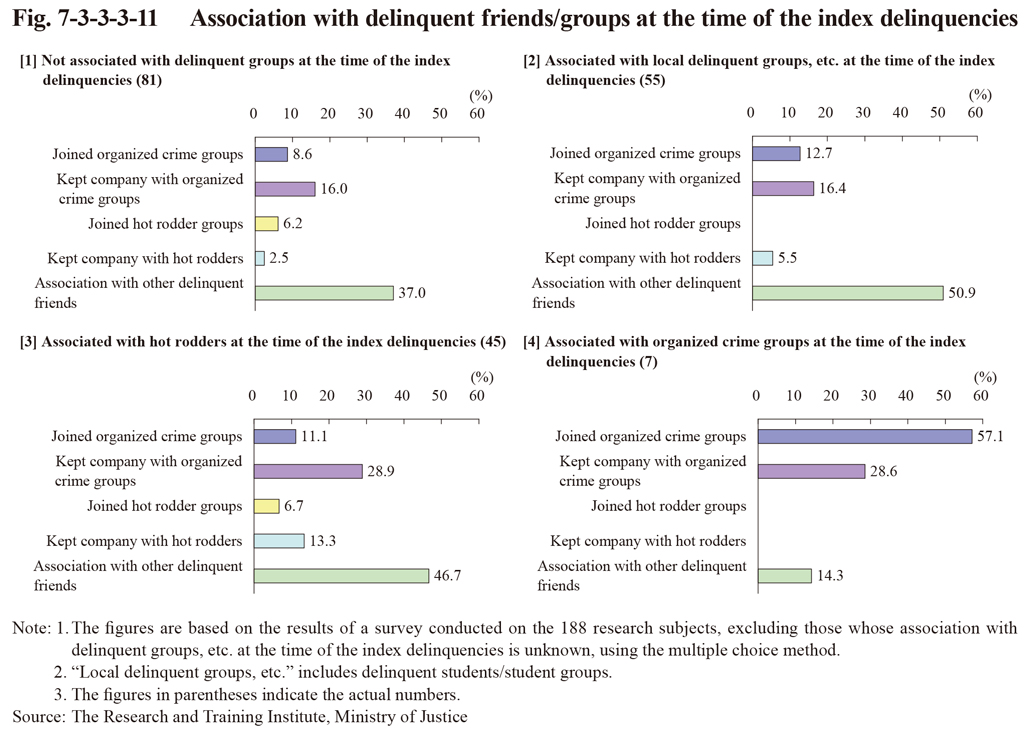 Fig. 7-3-3-3-11 Association with delinquent friends/groups at the time of the index delinquencies
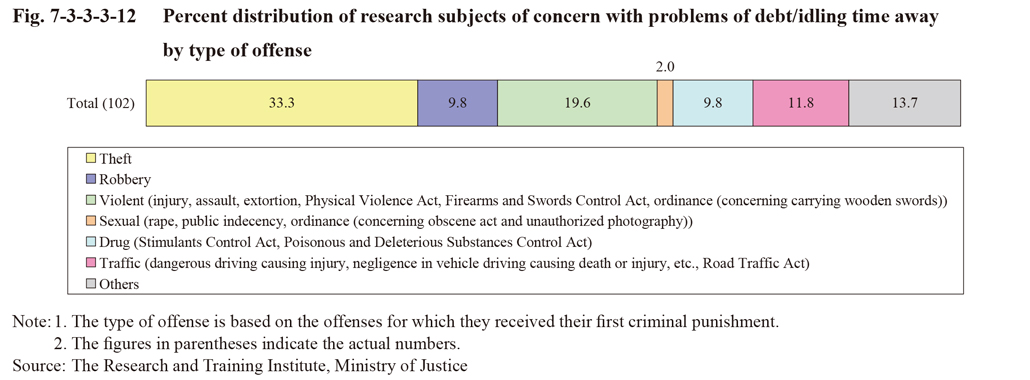
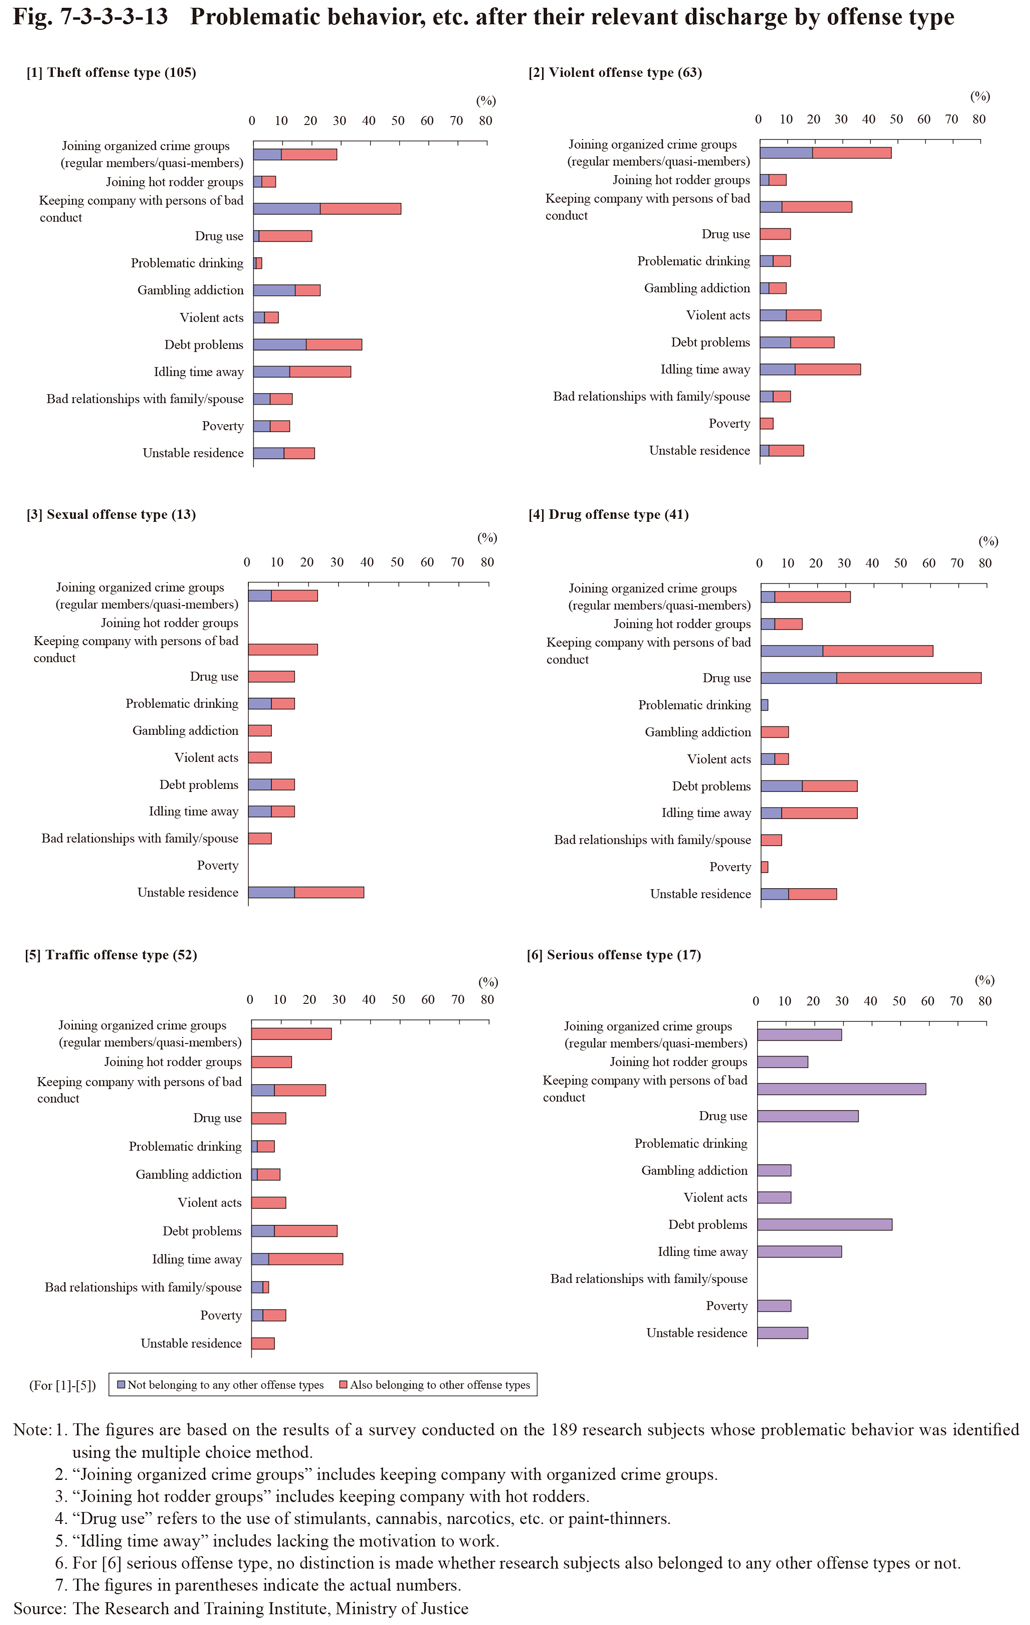 Fig. 7-3-3-3-13 Problematic behavior, etc. after their relevant discharge by offense type
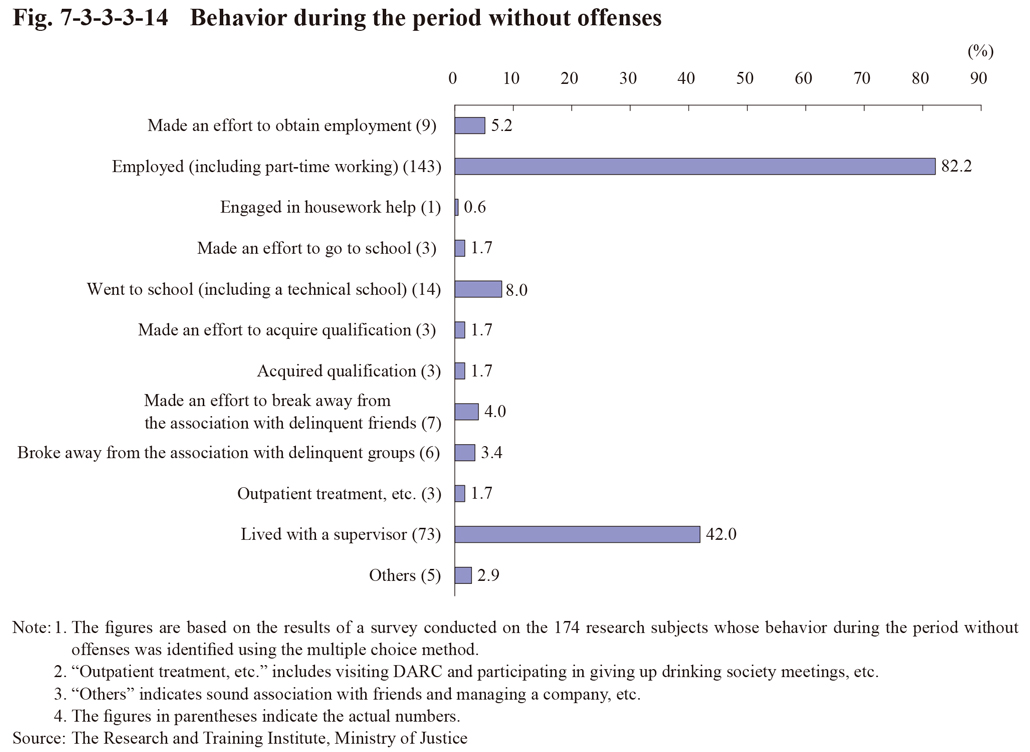 Fig. 7-3-3-3-14 Behavior during the period without offenses
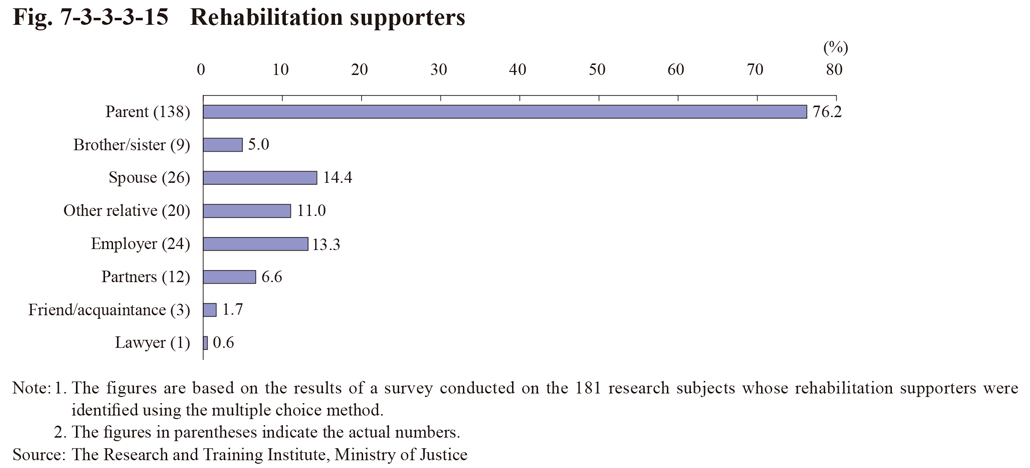 Fig. 7-3-3-3-15 Rehabilitation supporters
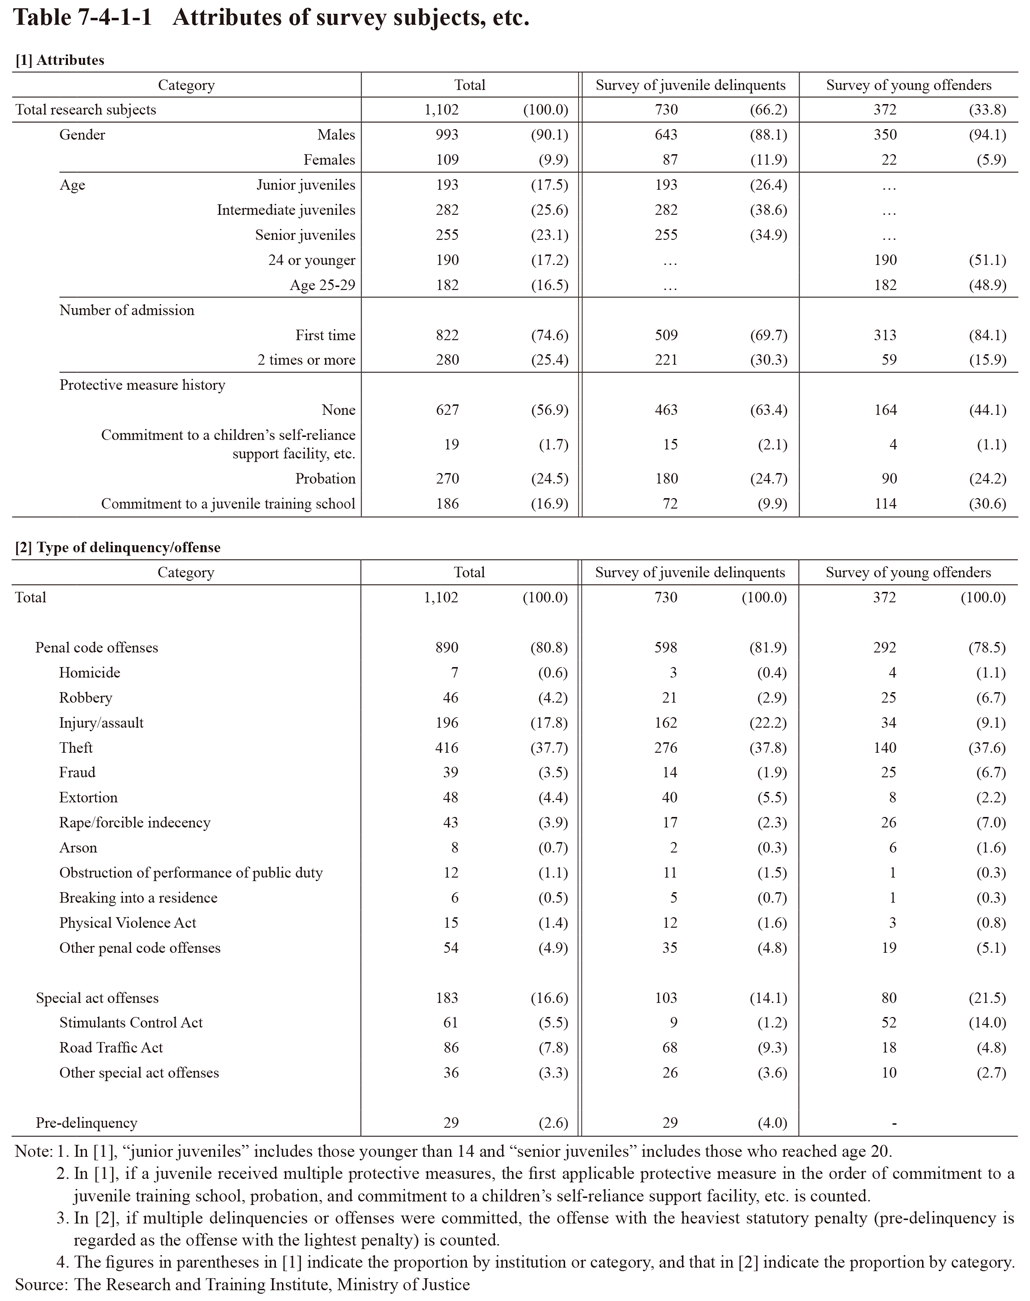 Table 7-4-1-1 Attributes of survey subjects, etc.
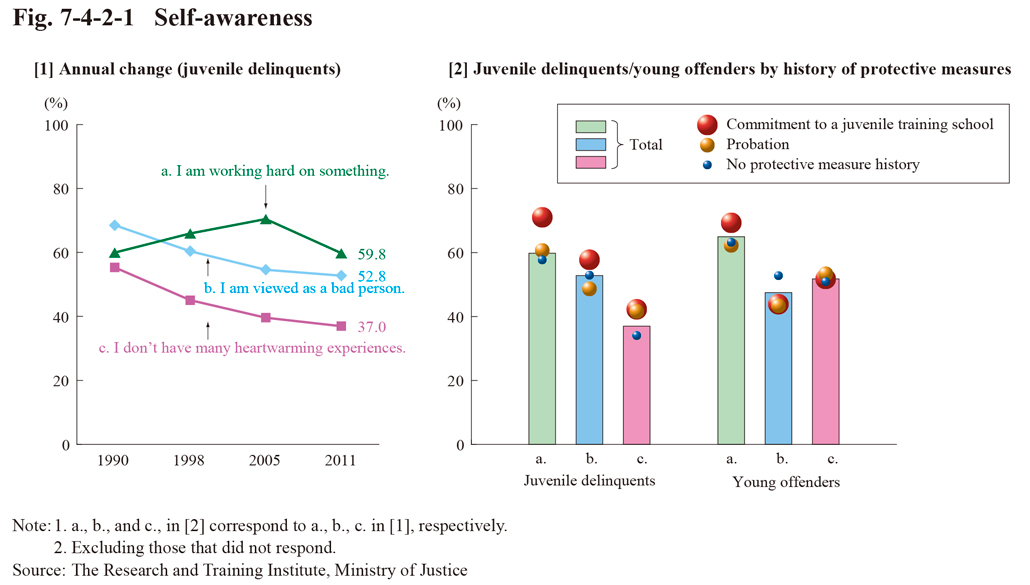
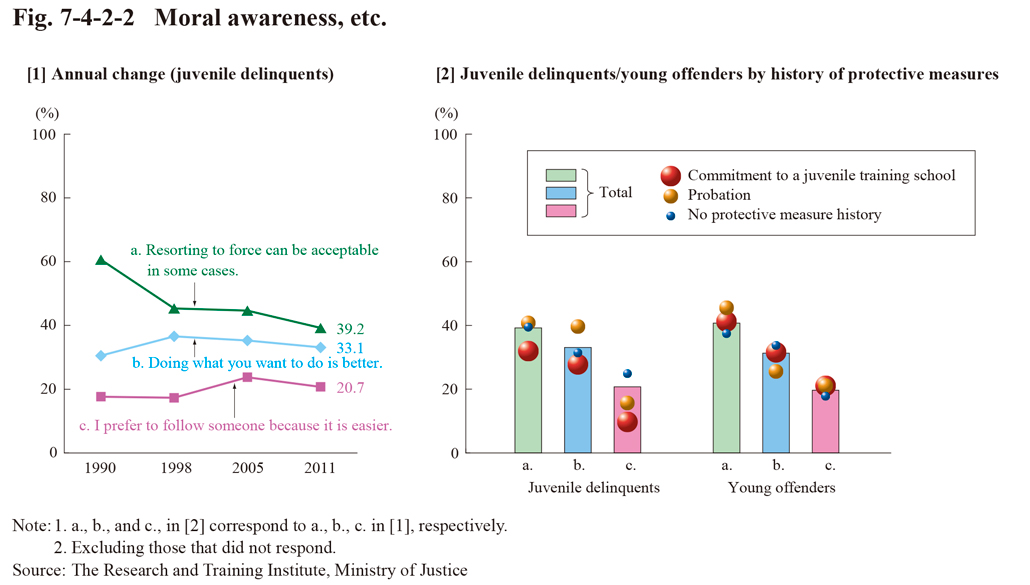 Fig. 7-4-2-2 Moral awareness, etc.
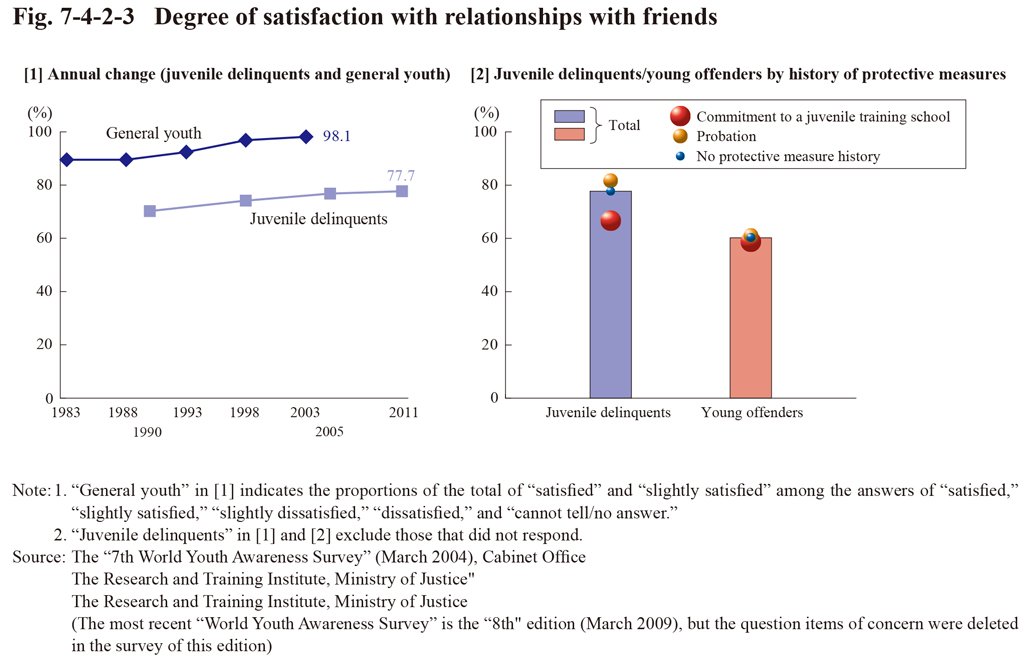 Fig. 7-4-2-3 Degree of satisfaction with relationships with friends
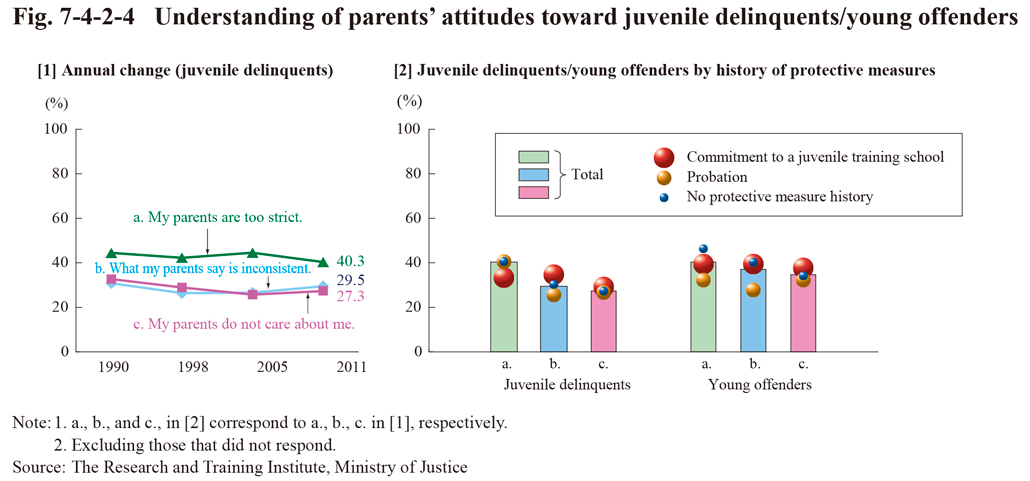 Fig. 7-4-2-4 Understanding of parents’ attitudes toward juvenile delinquents/young offenders
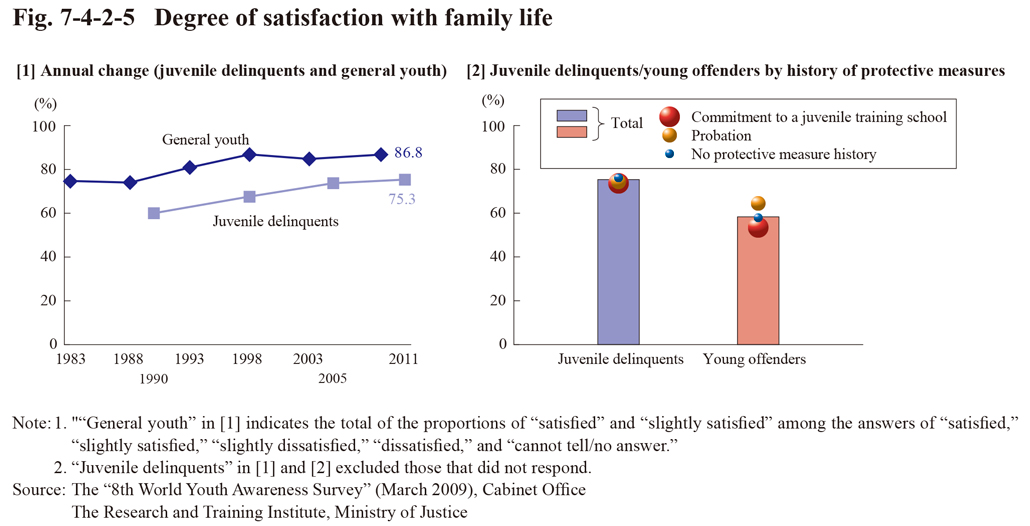 Fig. 7-4-2-5 Degree of satisfaction with family life
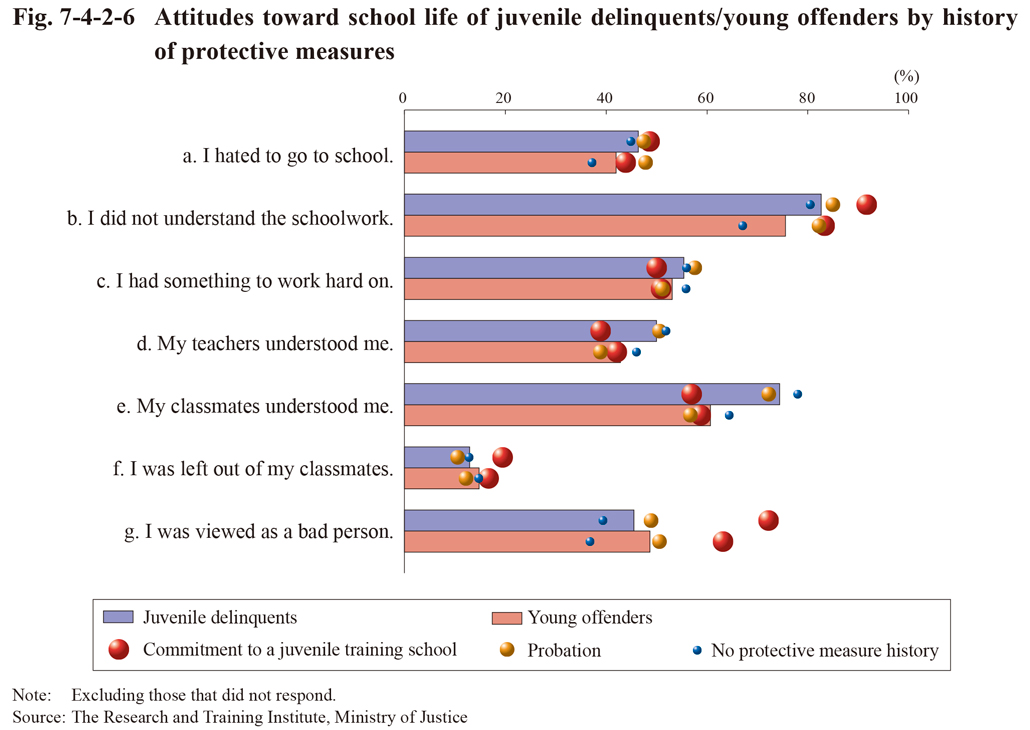
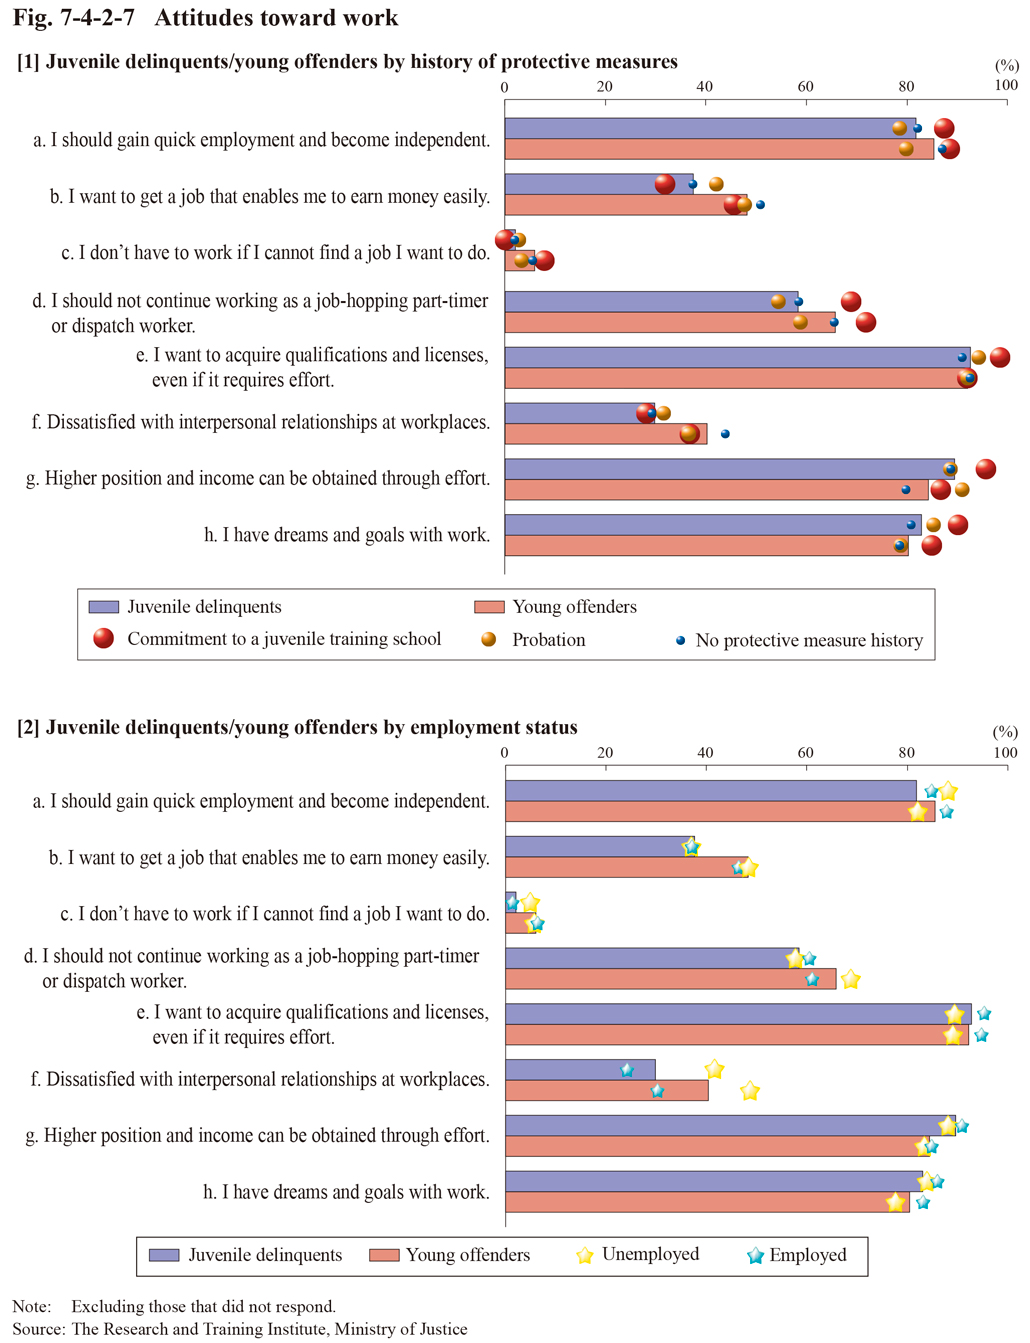 Fig. 7-4-2-7 Attitudes toward work
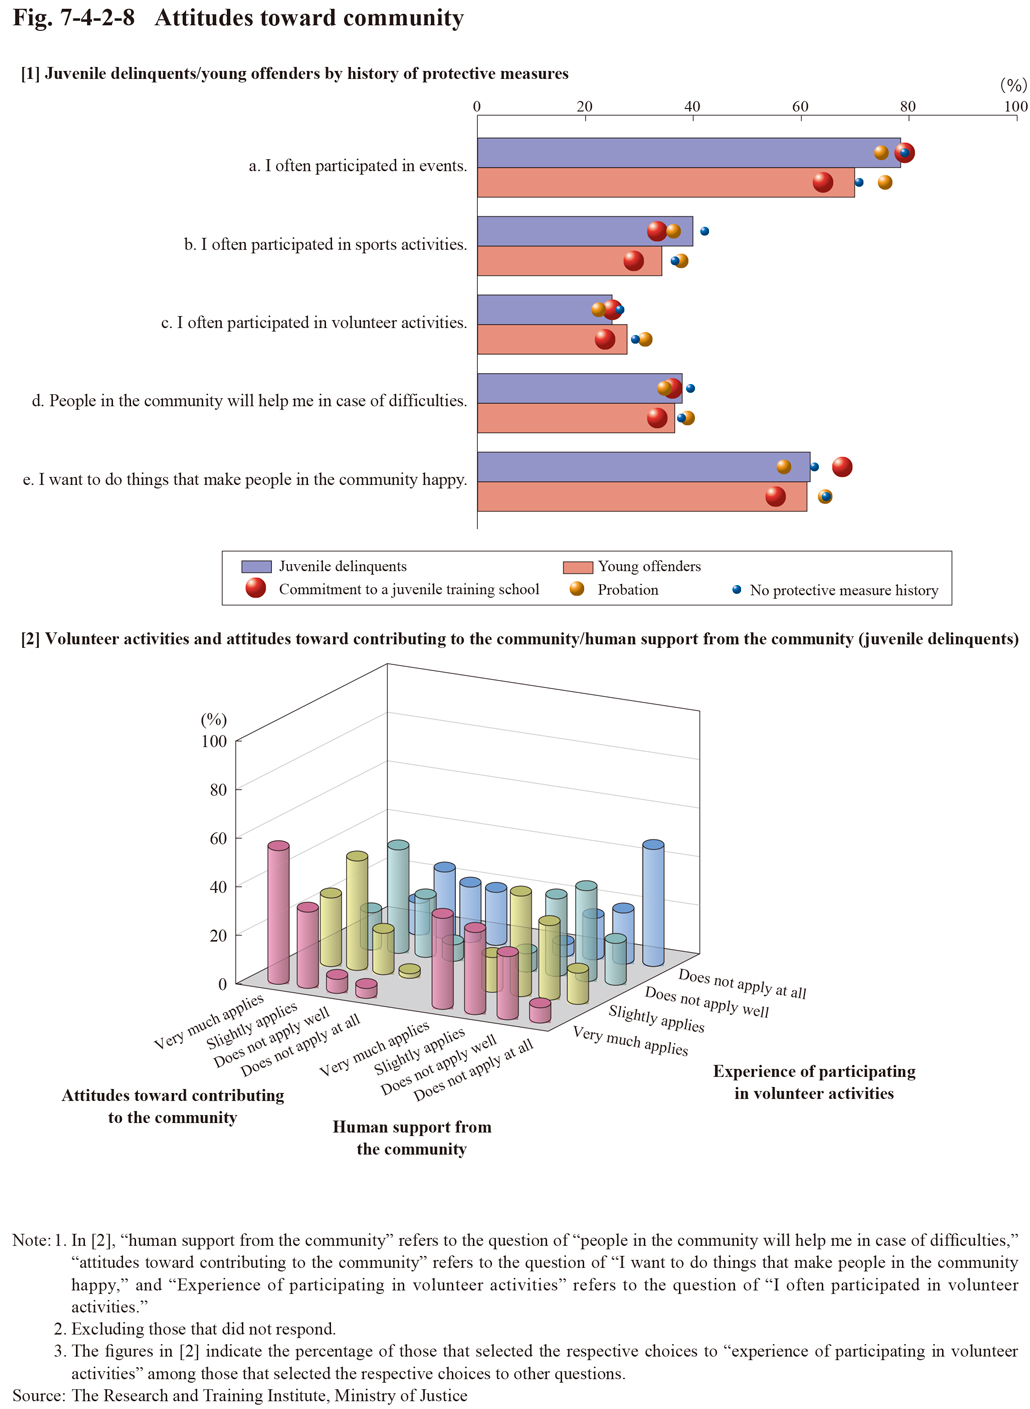 Fig. 7-4-2-8 Attitudes toward community
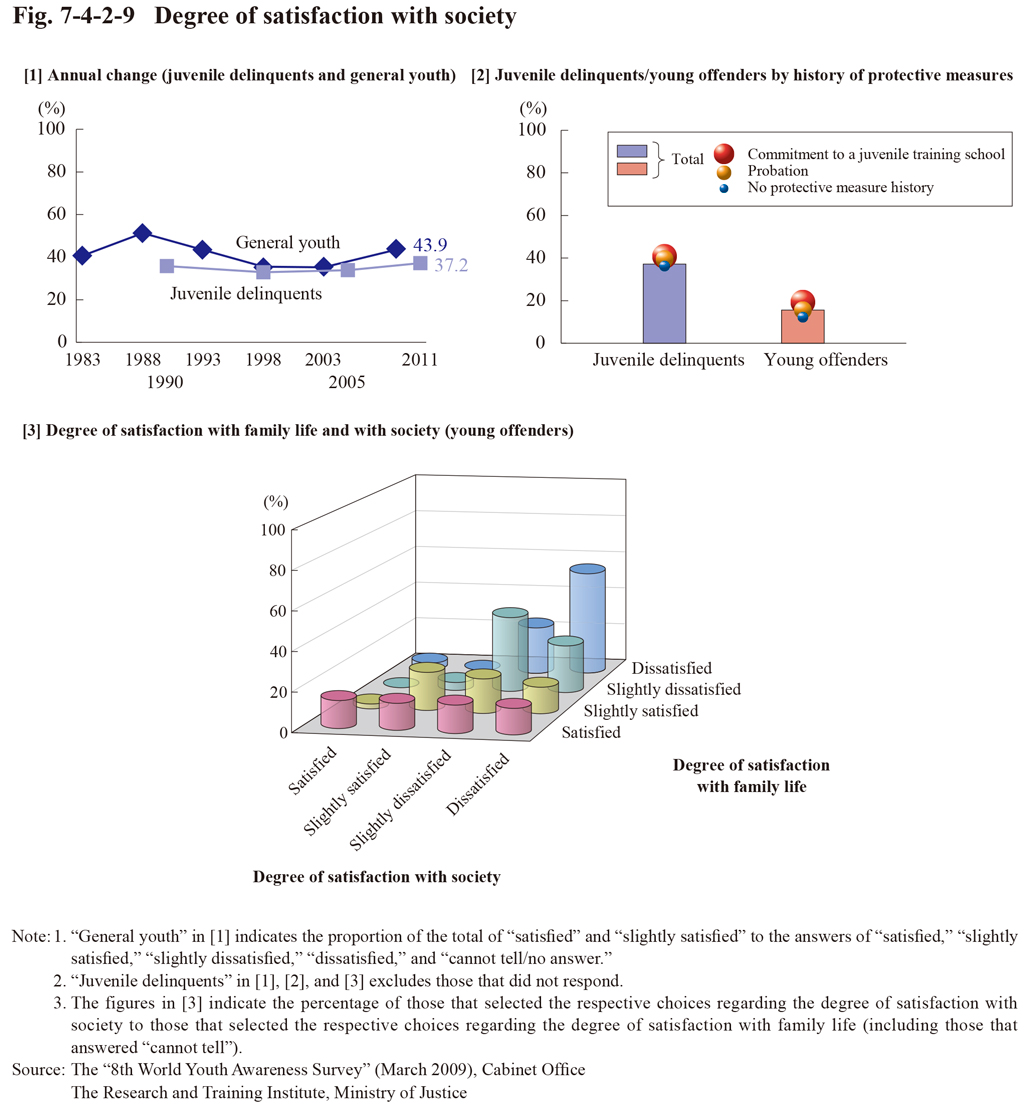 Fig. 7-4-2-9 Degree of satisfaction with society
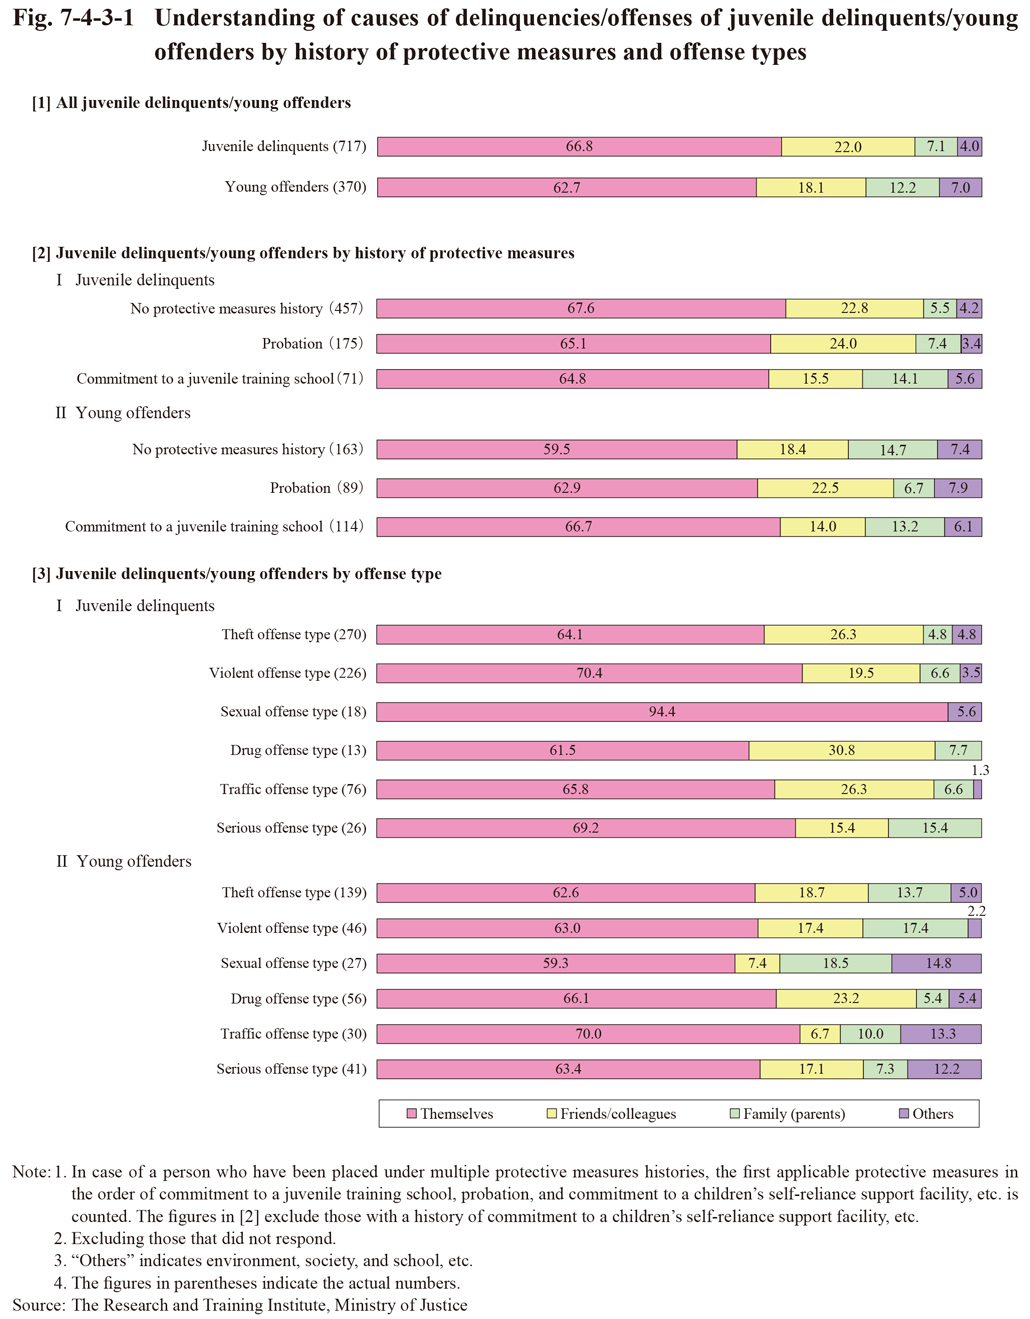
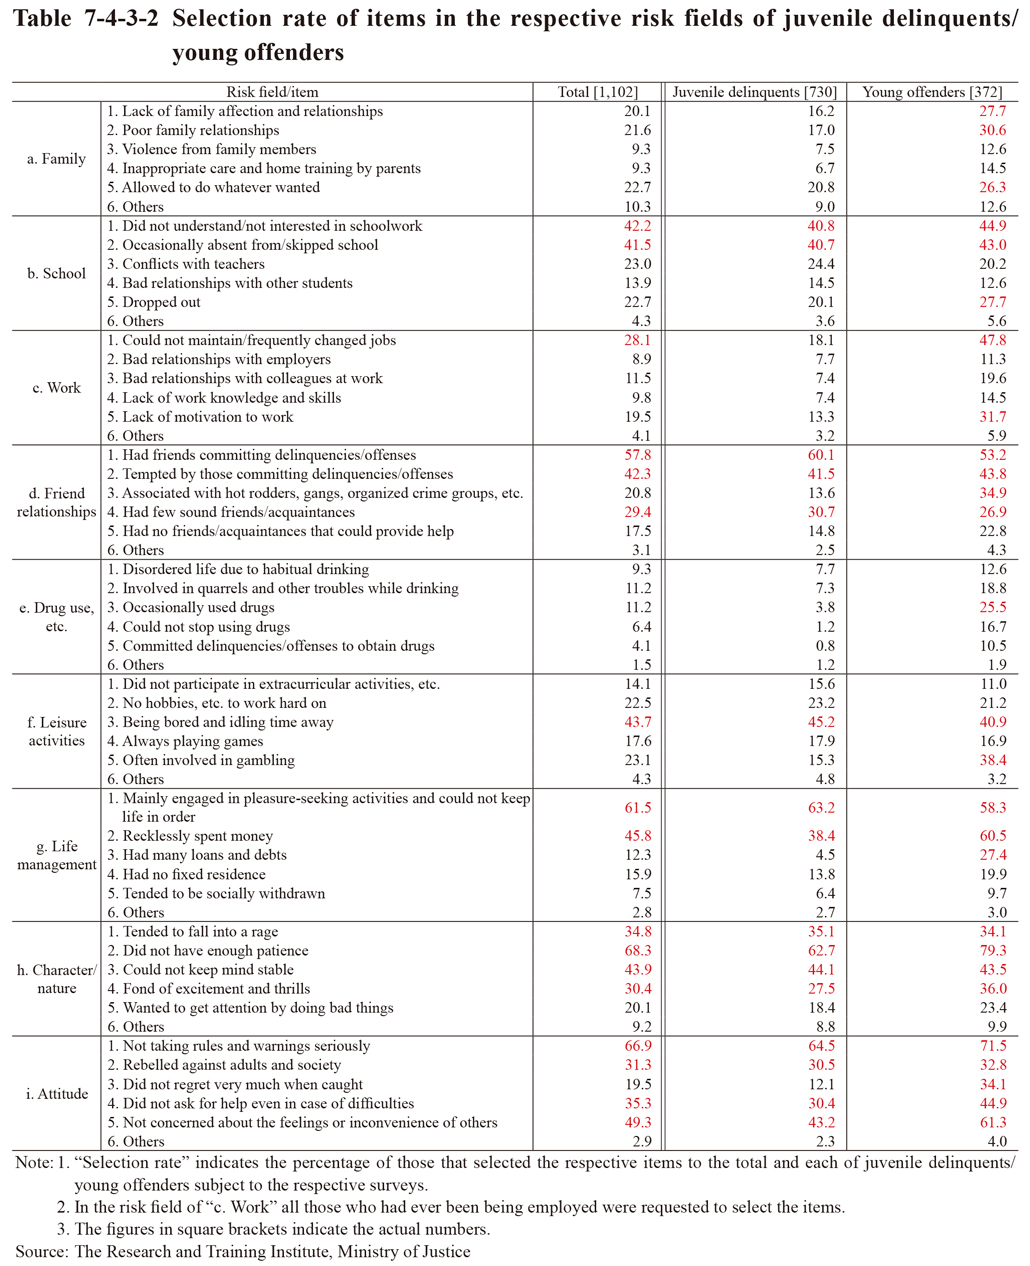
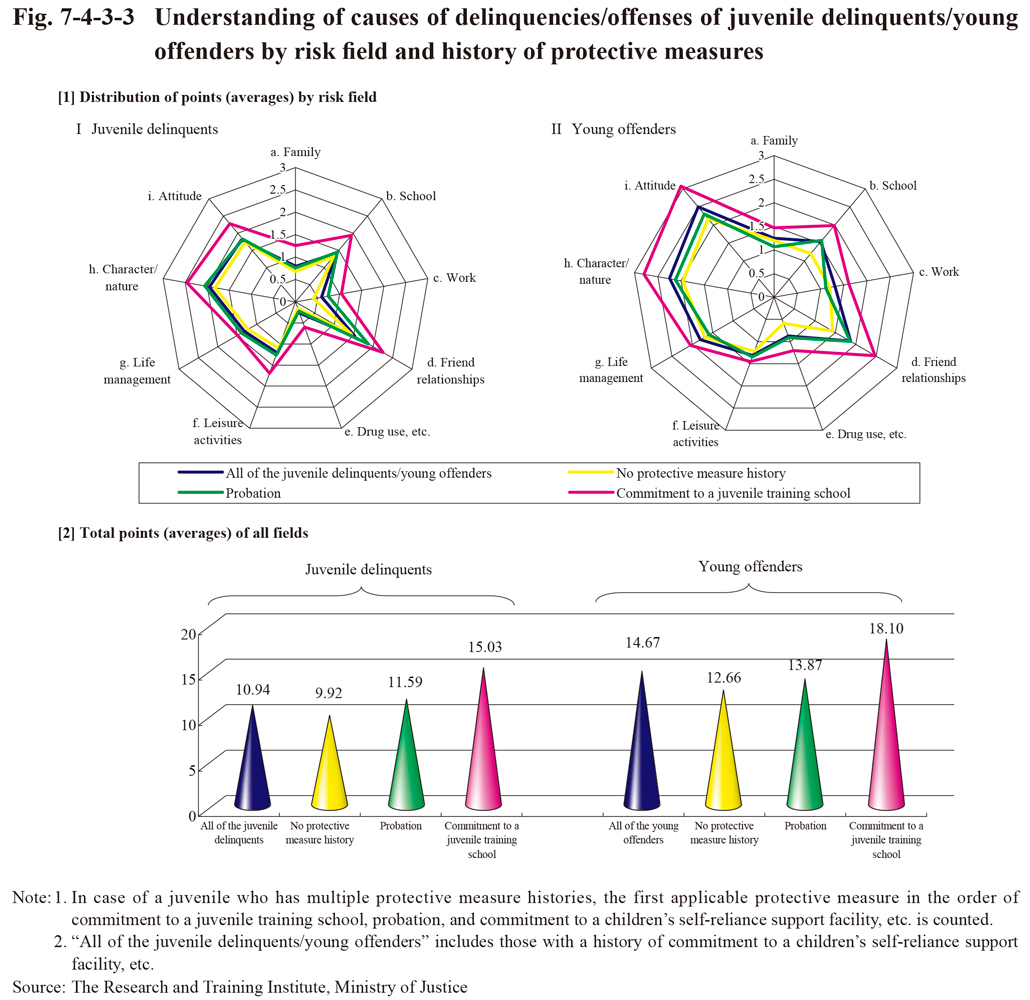
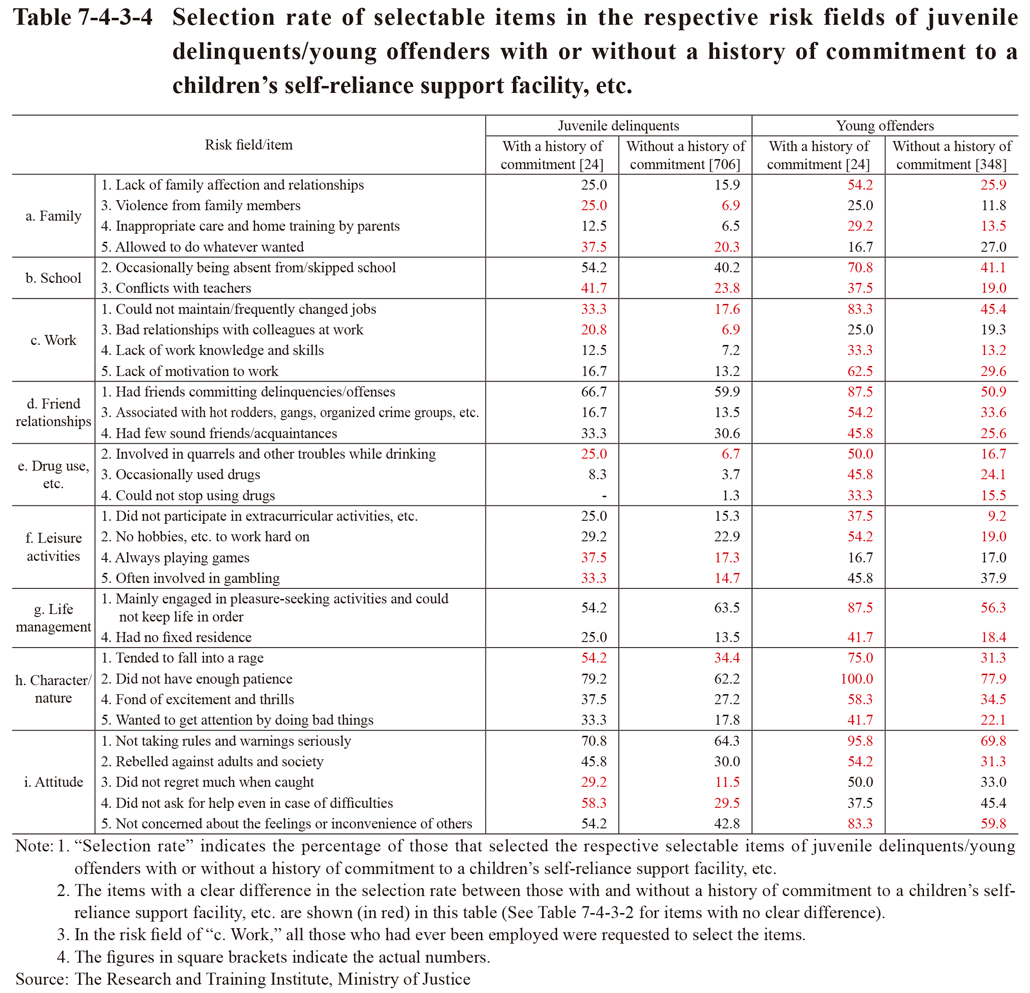
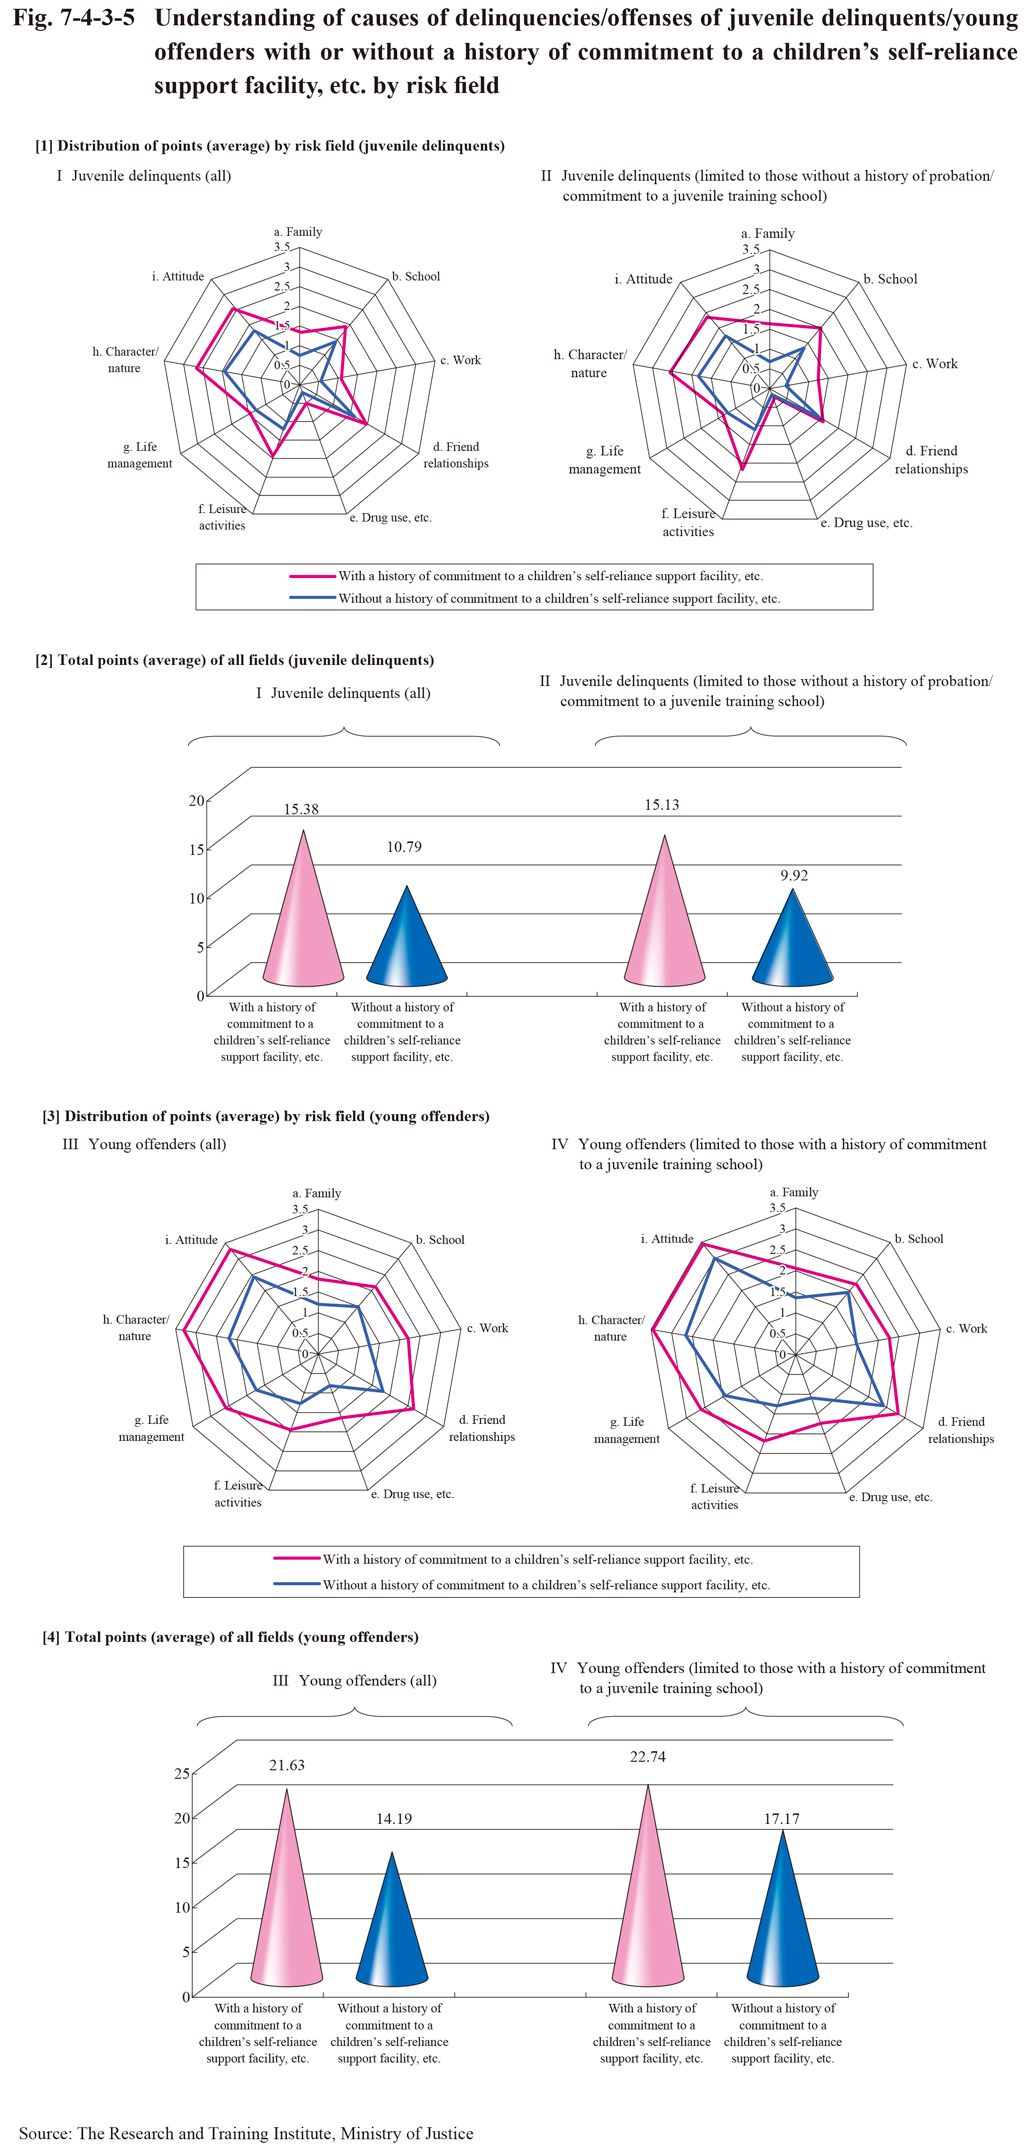
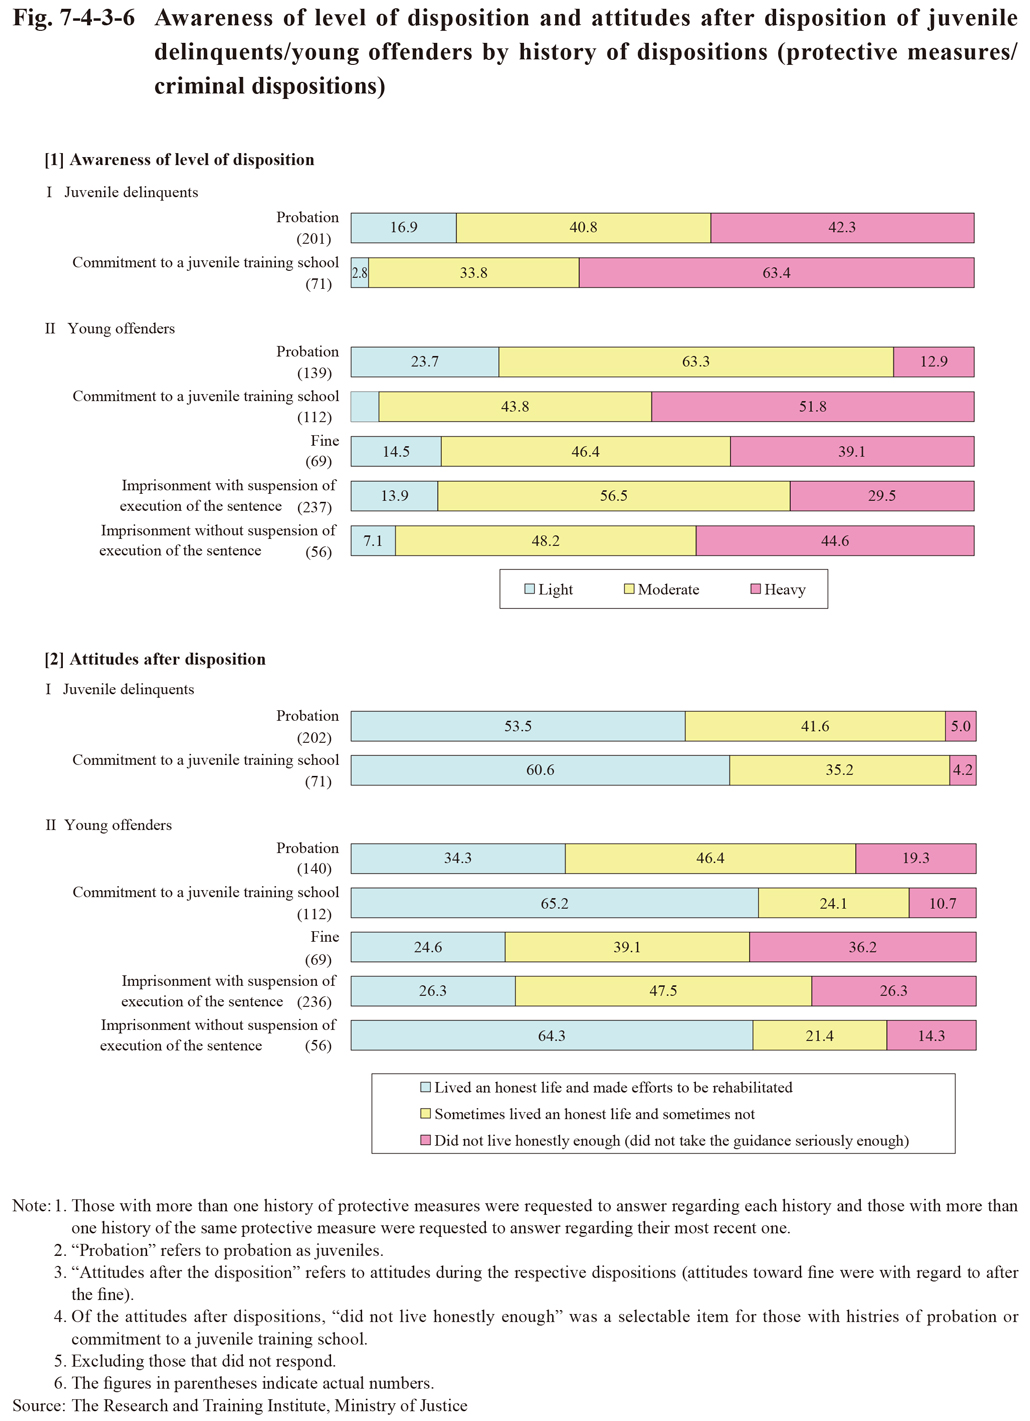
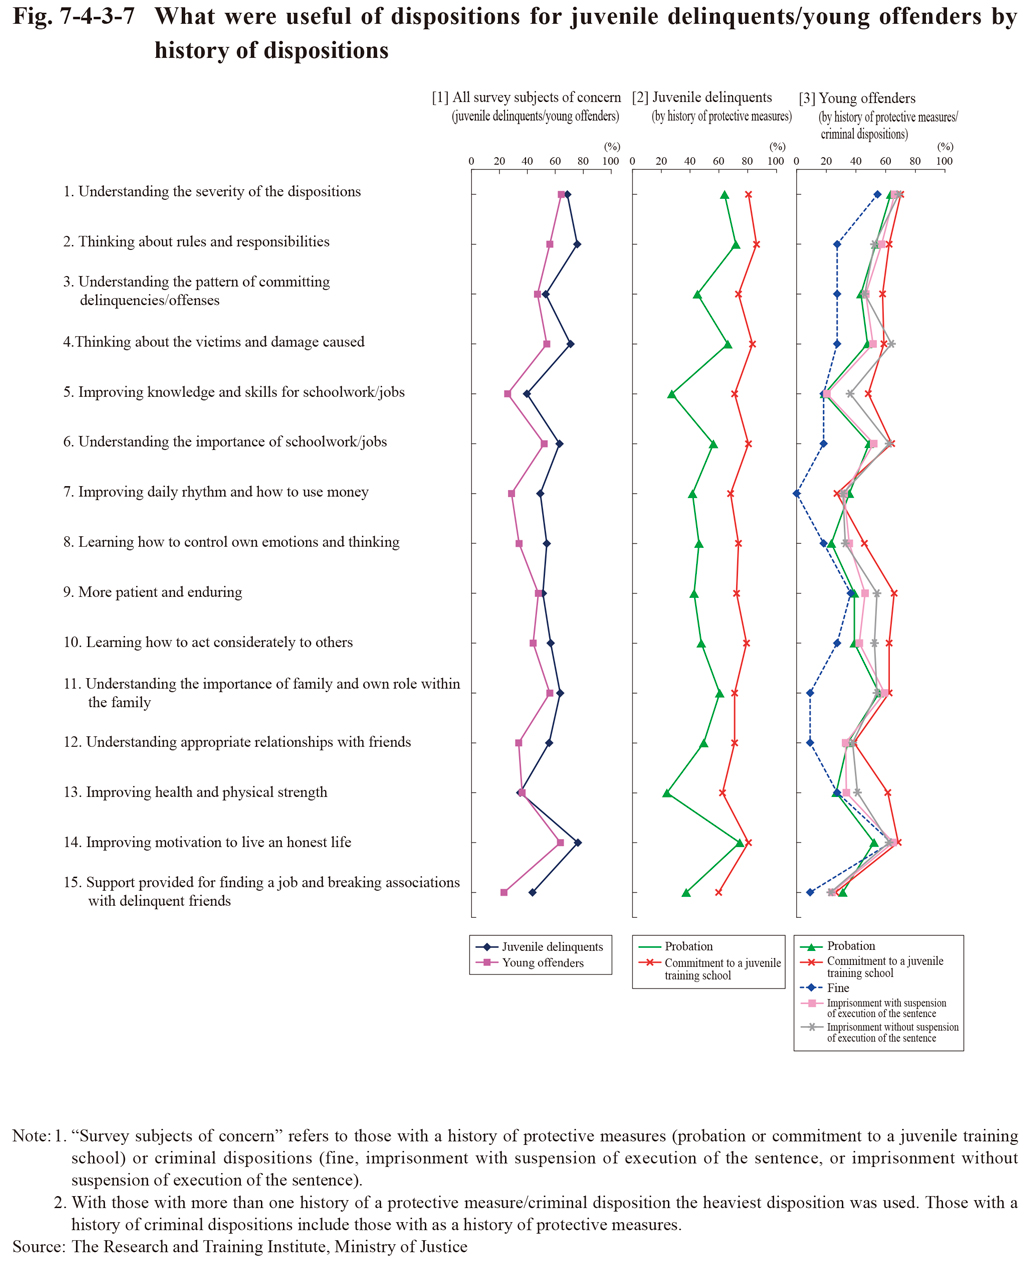
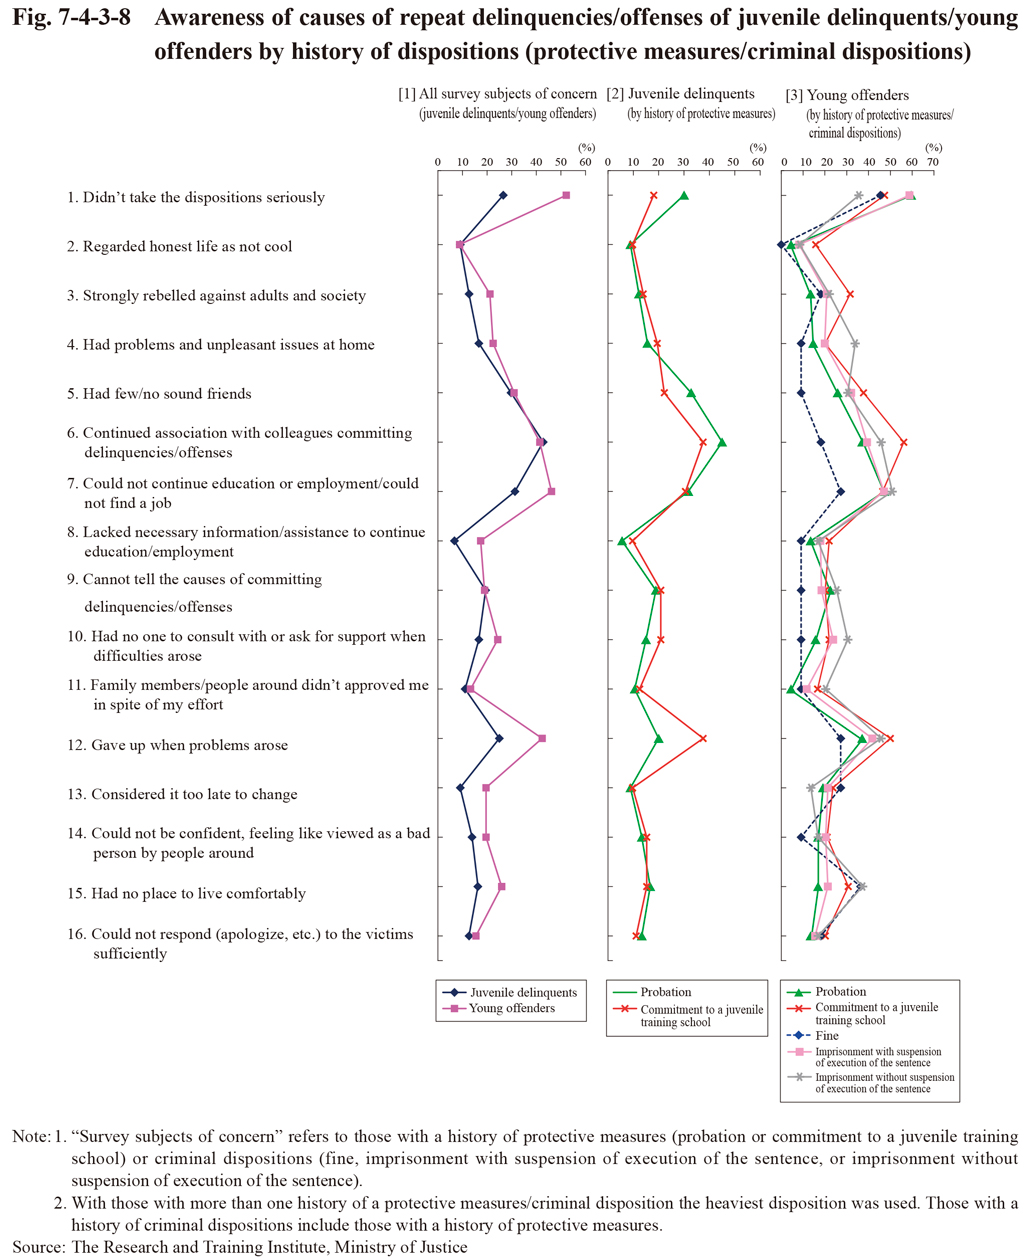
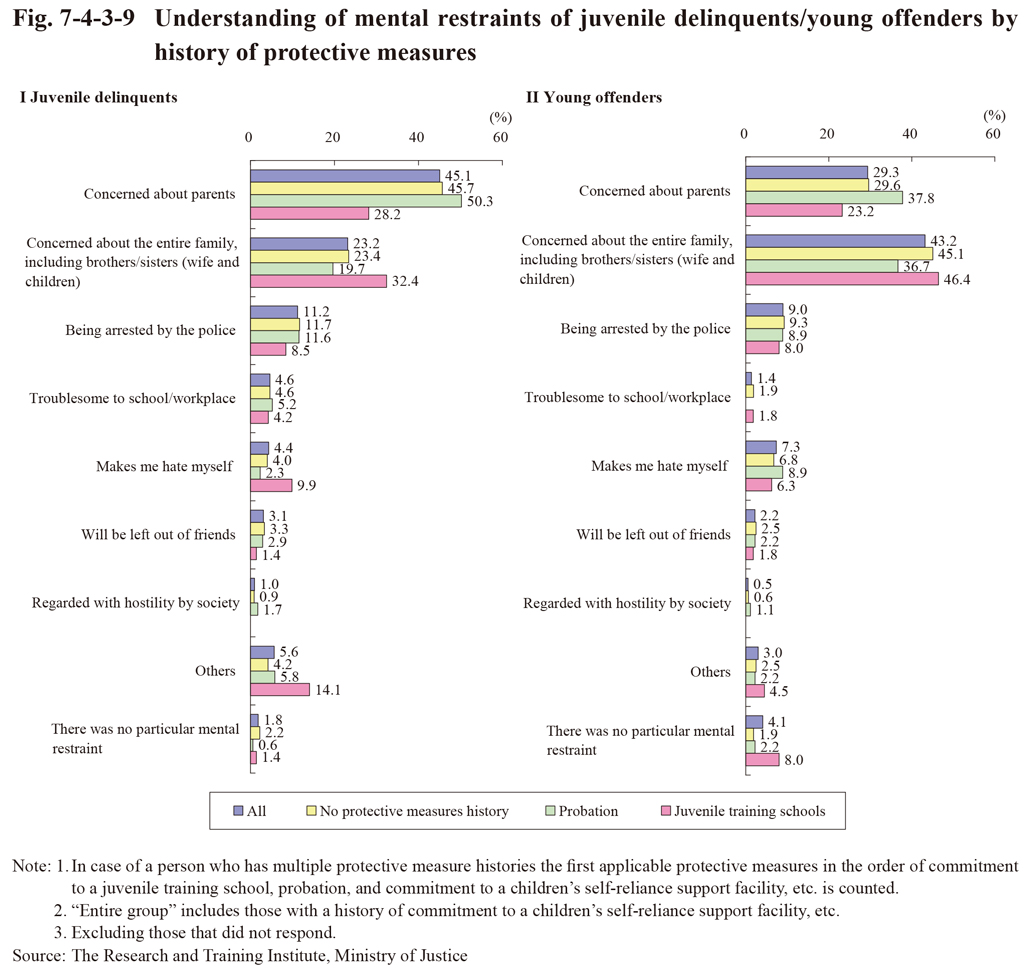
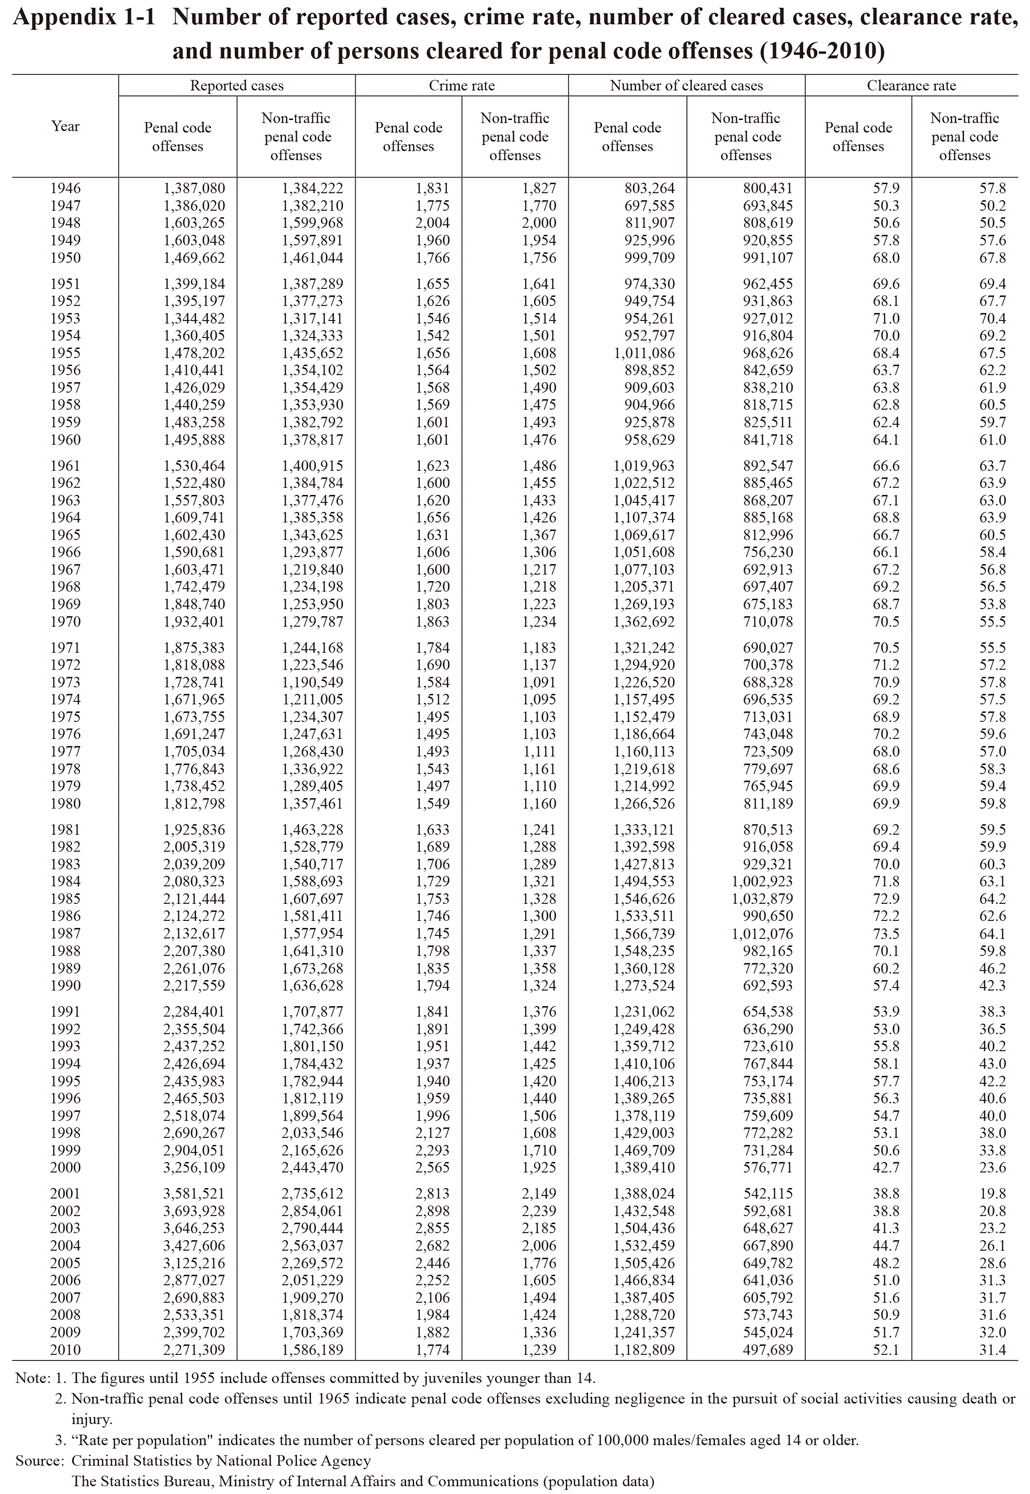
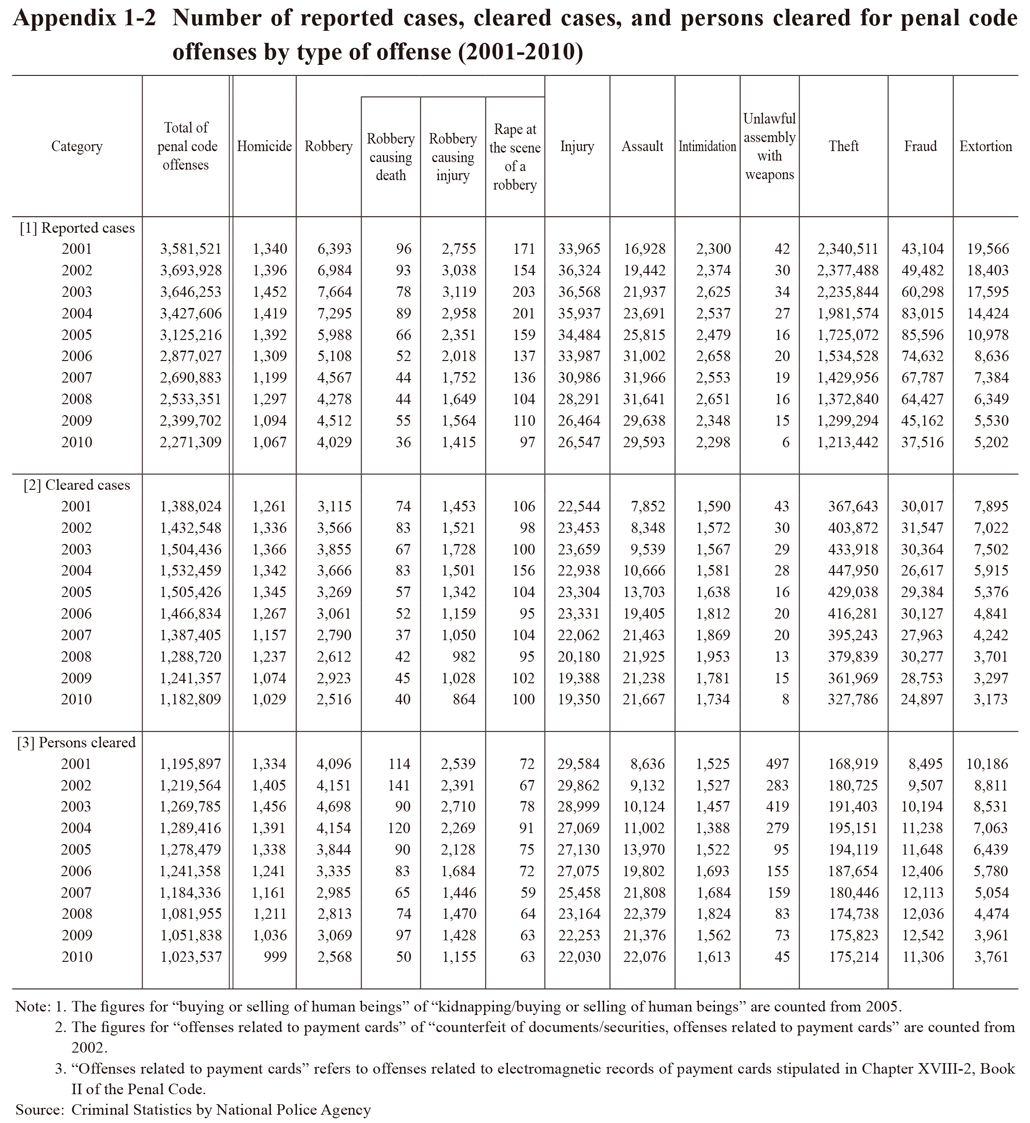
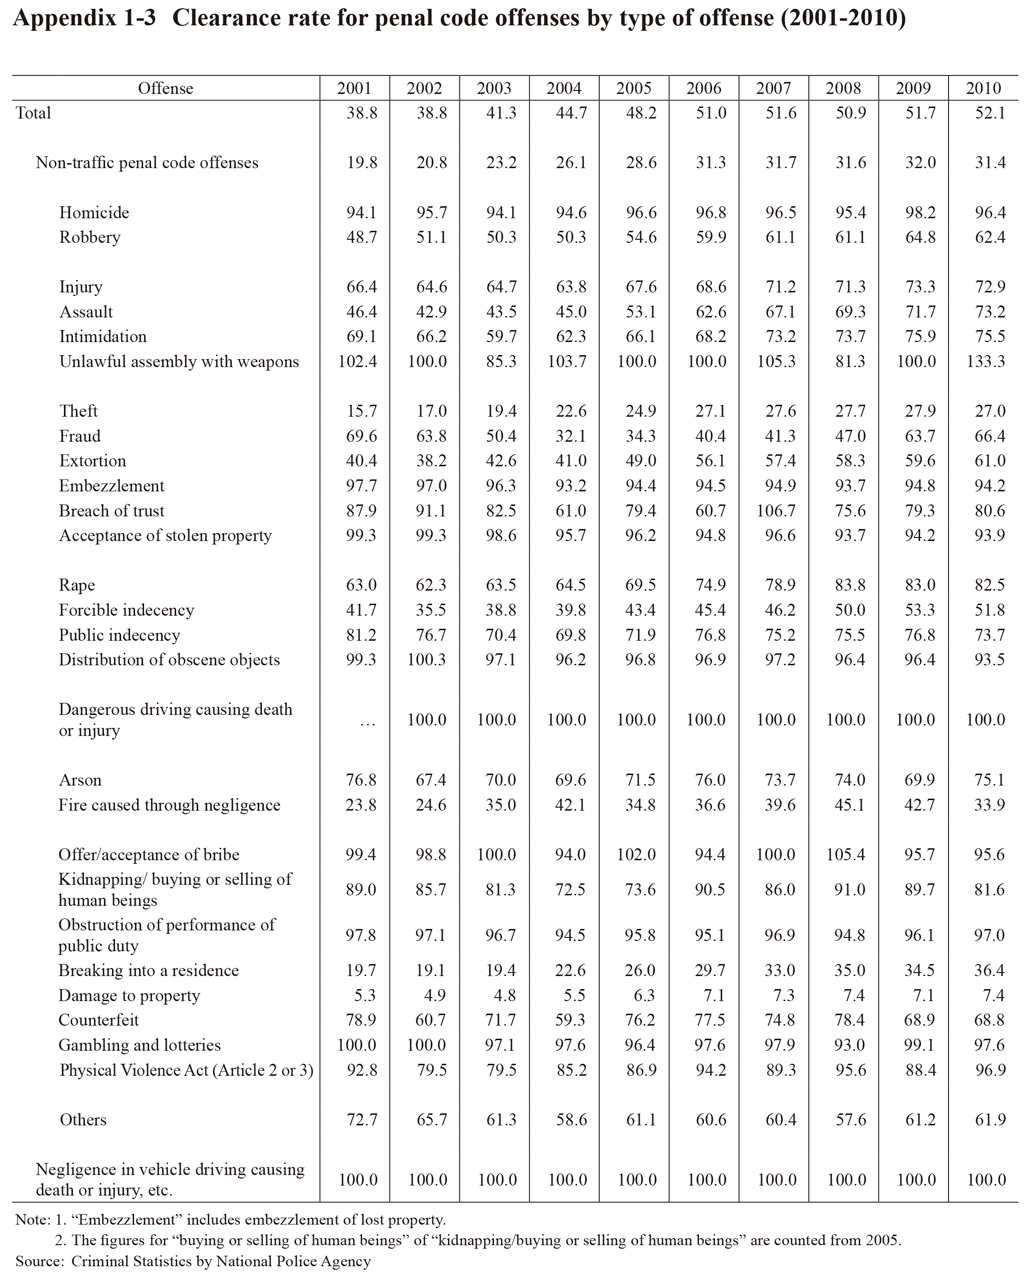 Appendix 1-3 Clearance rate for penal code offenses by type of offense (2001-2010)
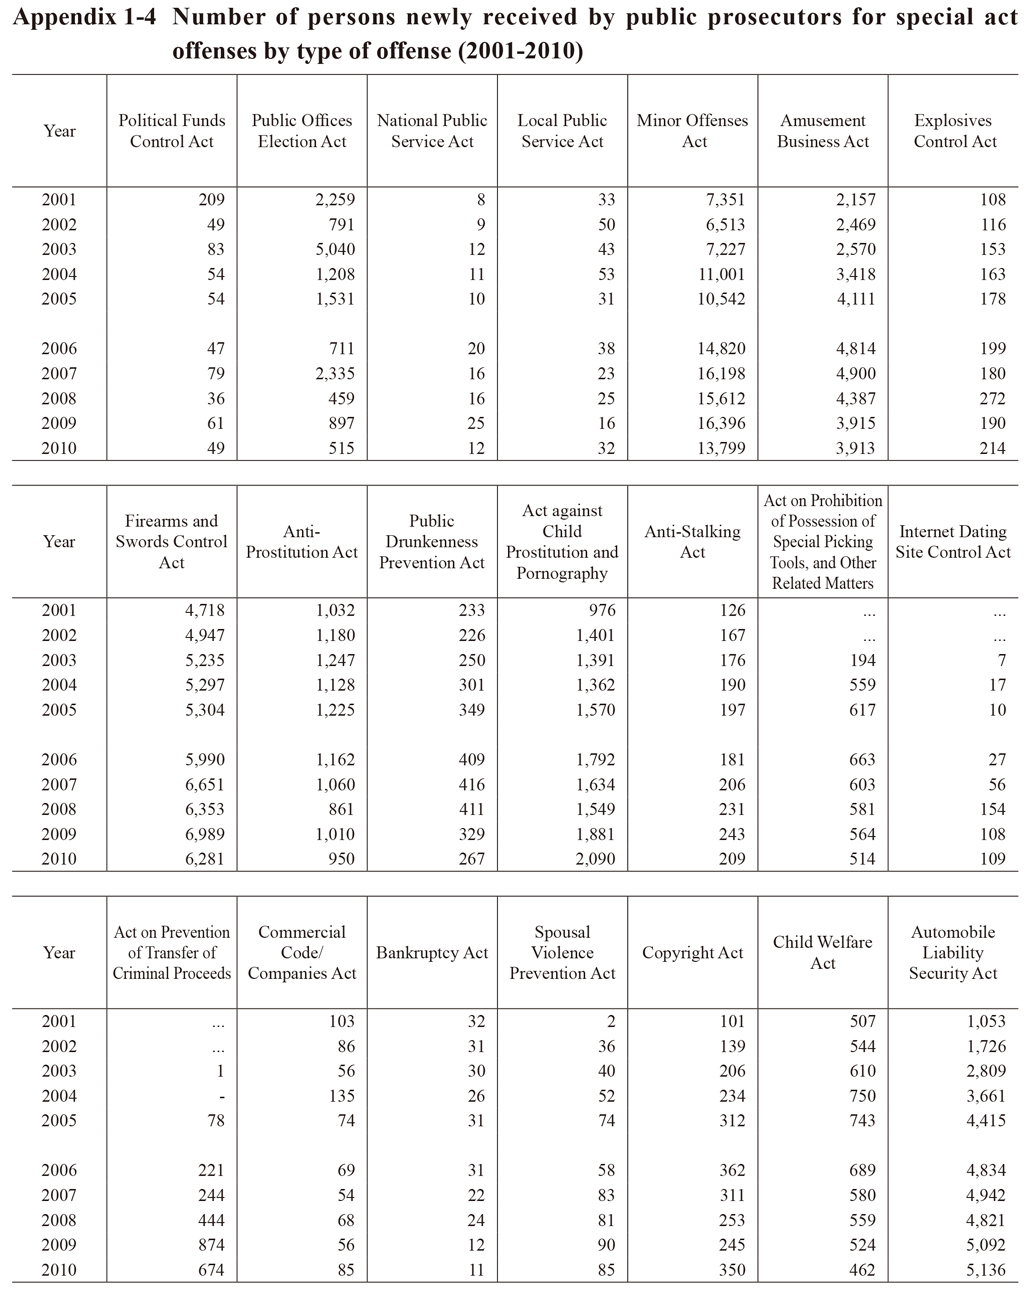
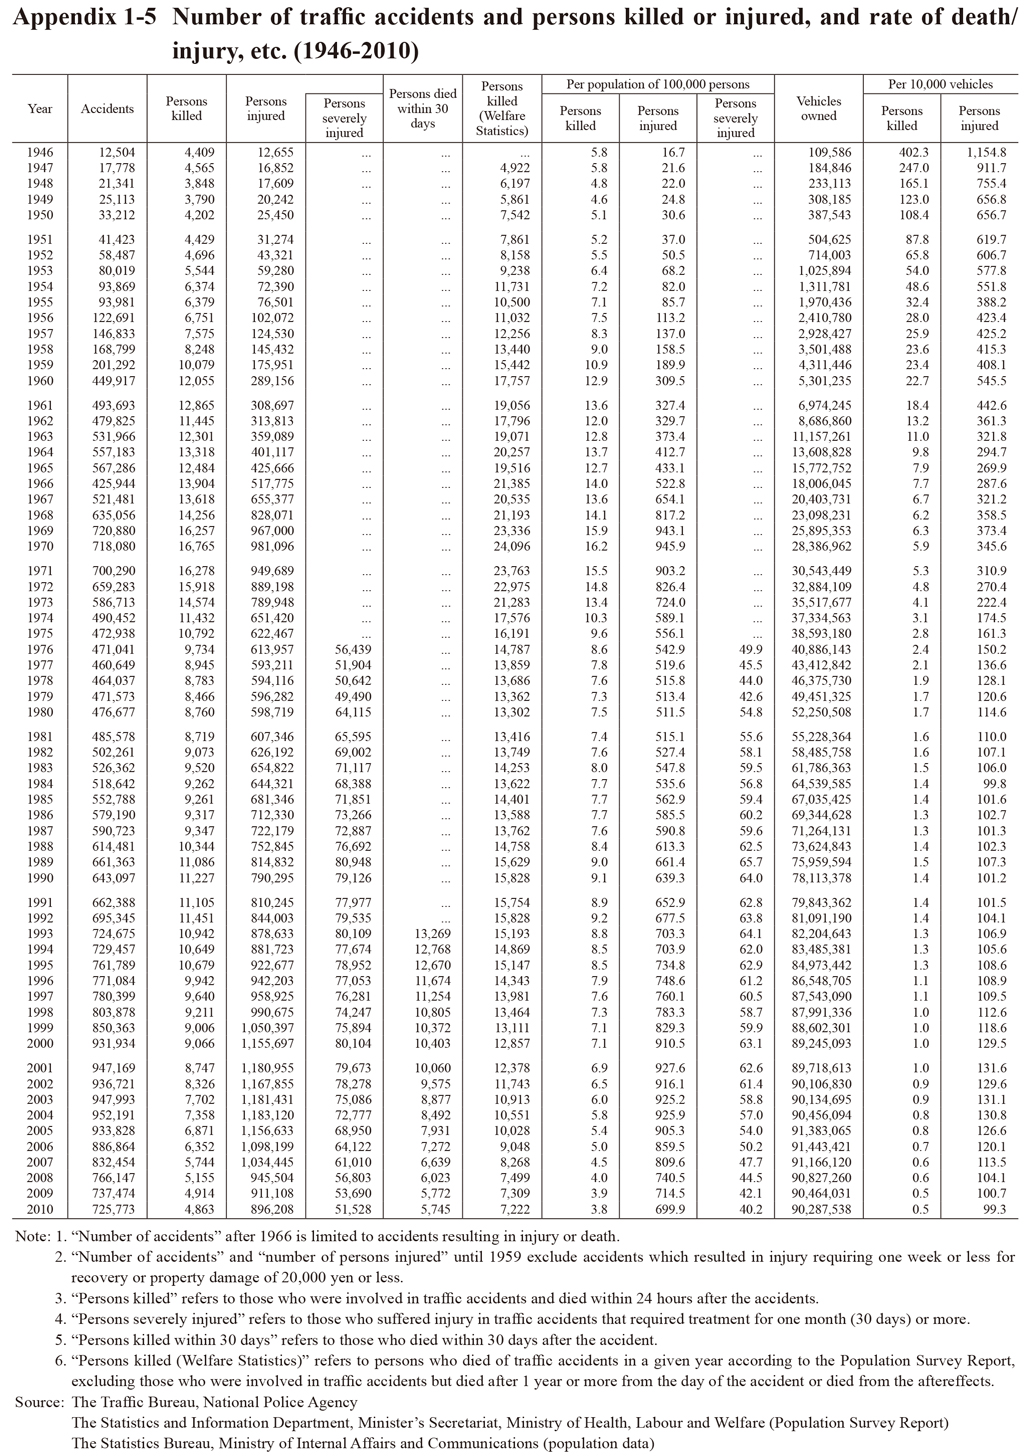
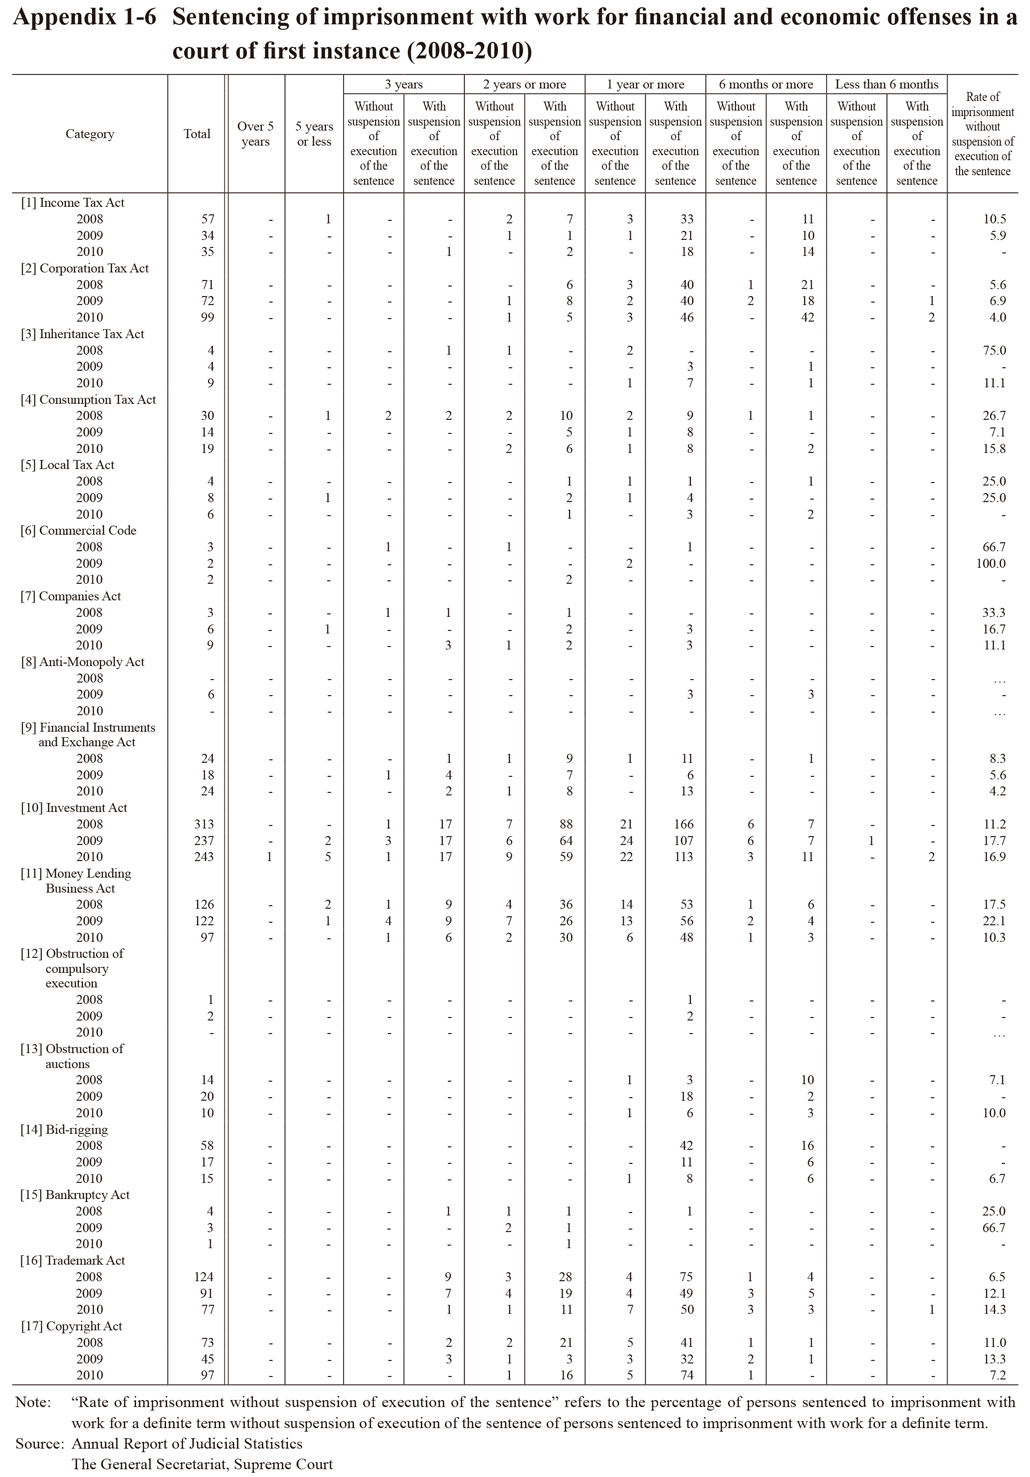
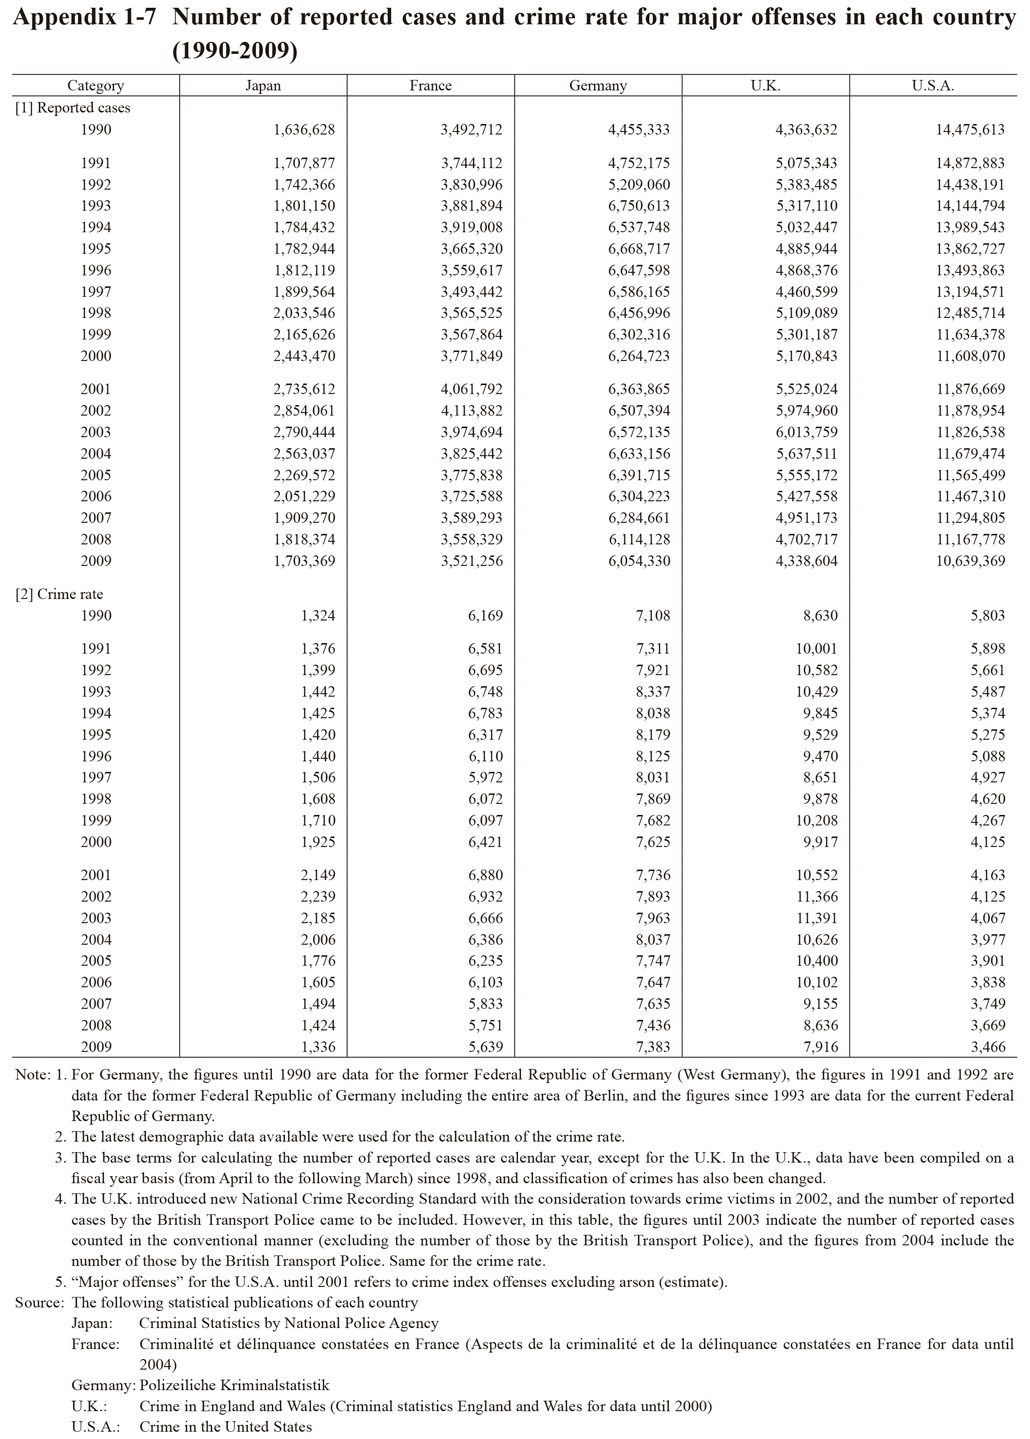 Appendix 1-7 Number of reported cases and crime rate for major offenses in each country (1990-2009)
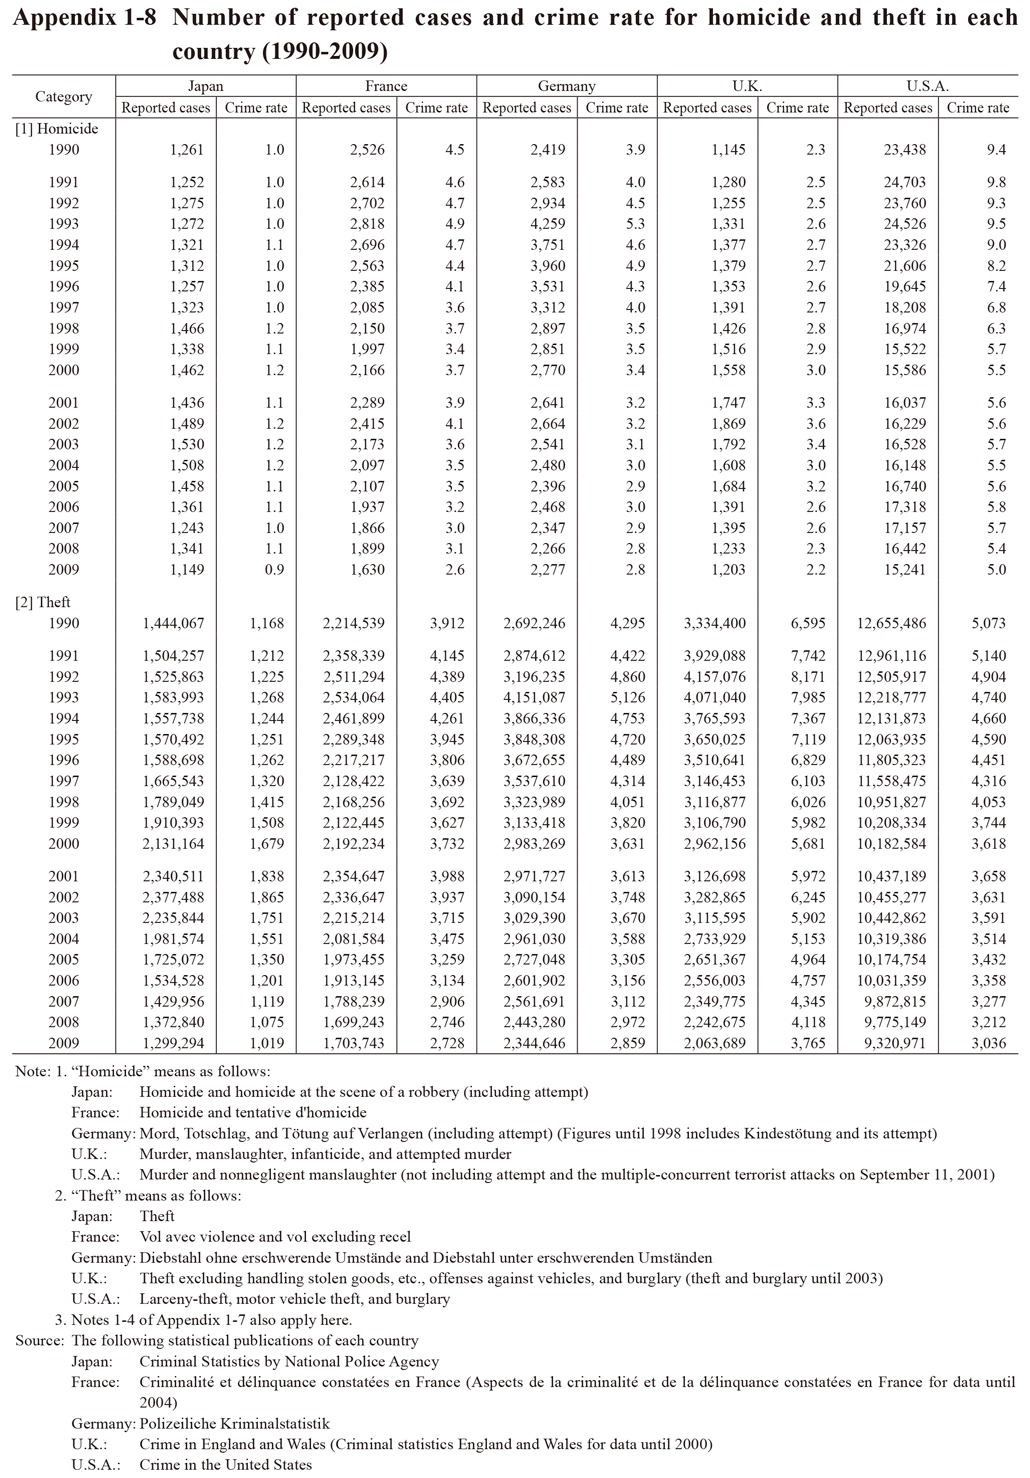
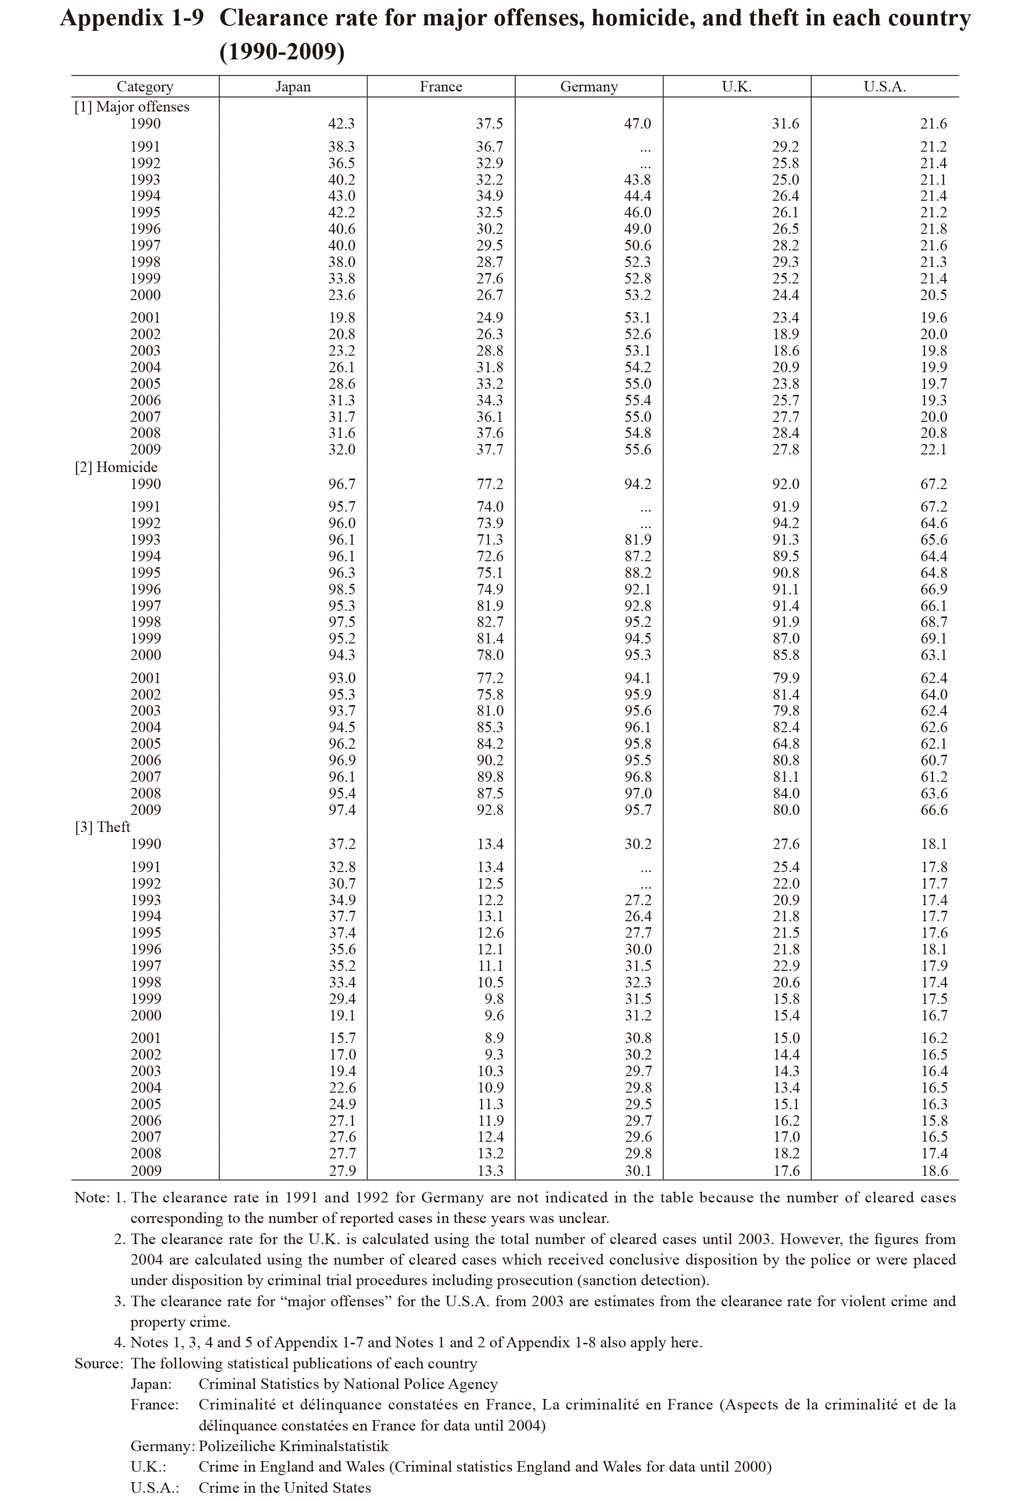 Appendix 1-9 Clearance rate for major offenses, homicide, and theft in each country
 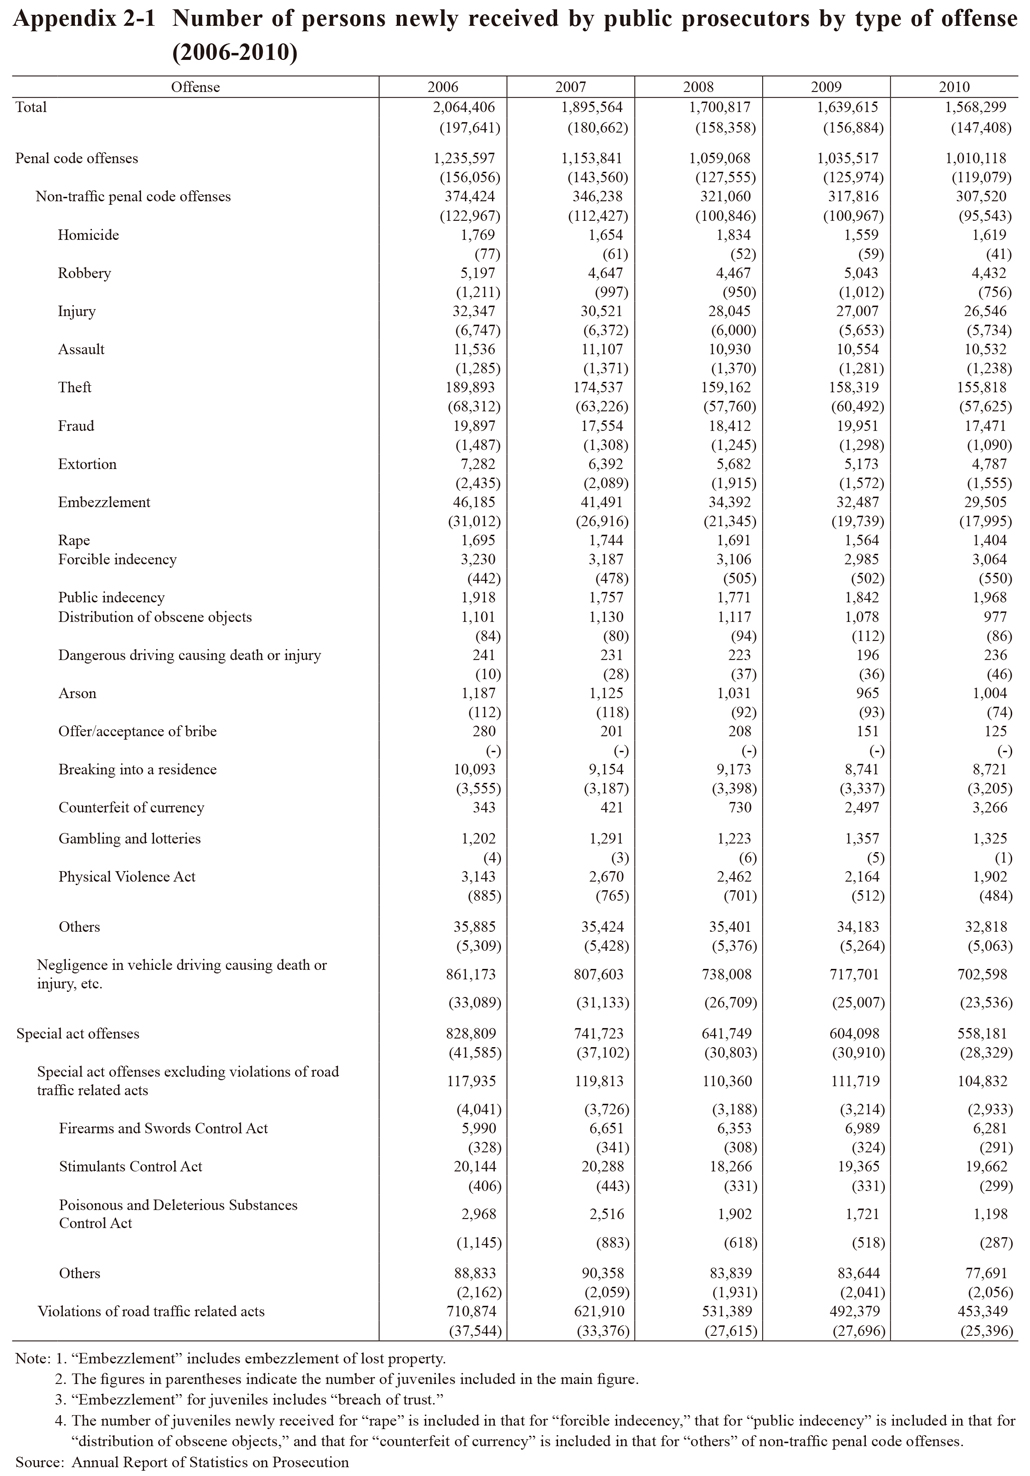 Appendix 2-1 Number of persons newly received by public prosecutors by type of offense (2006-2010)
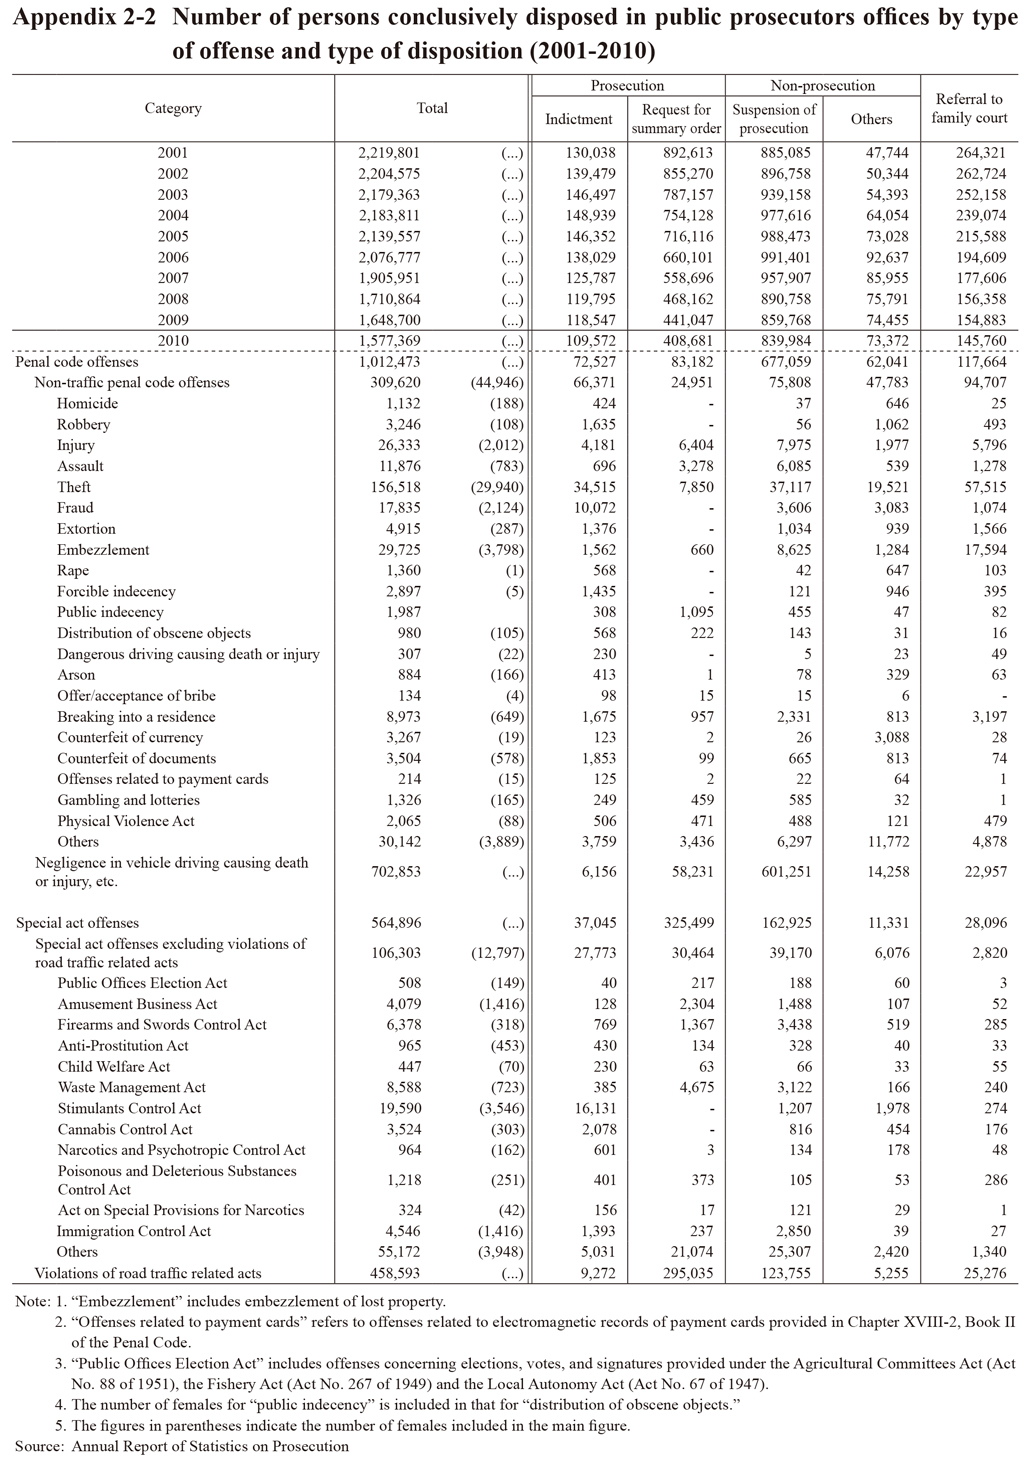
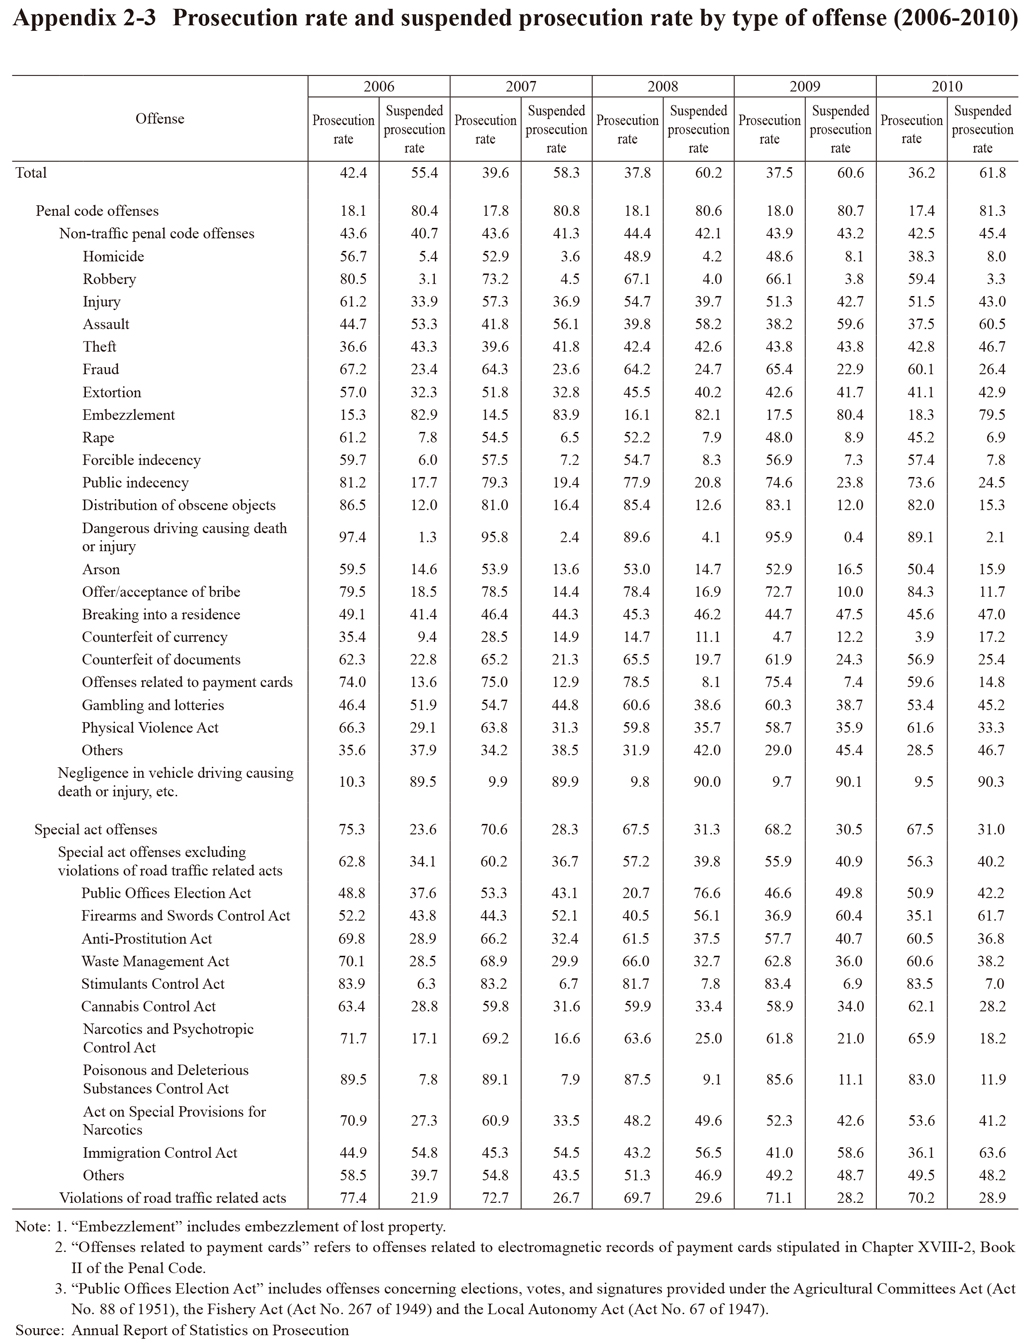 Appendix 2-3 Prosecution rate and suspended prosecution rate by type of offense (2006-2010)
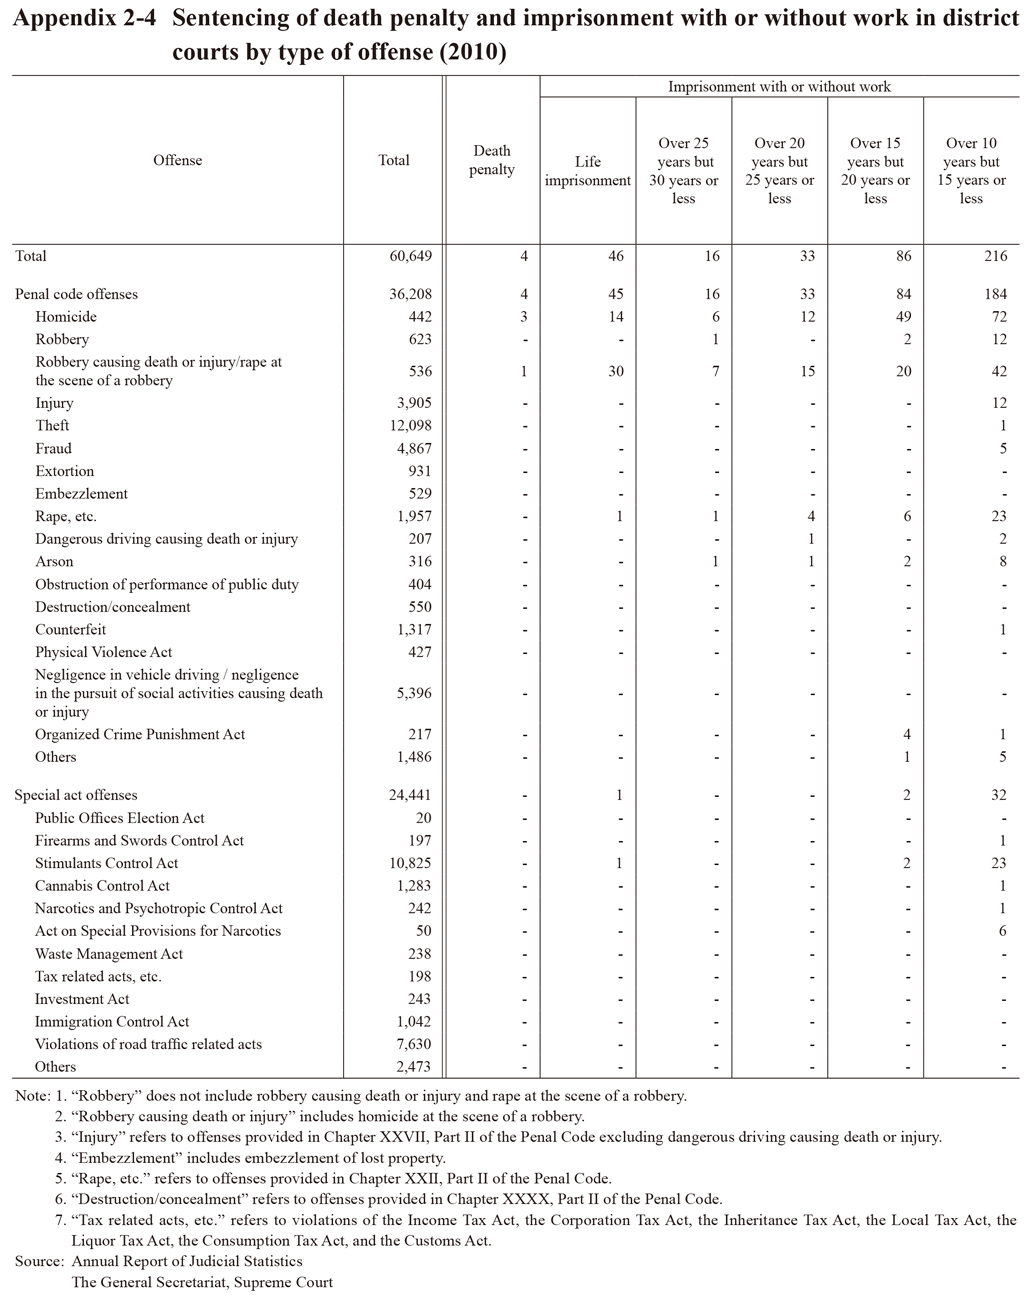
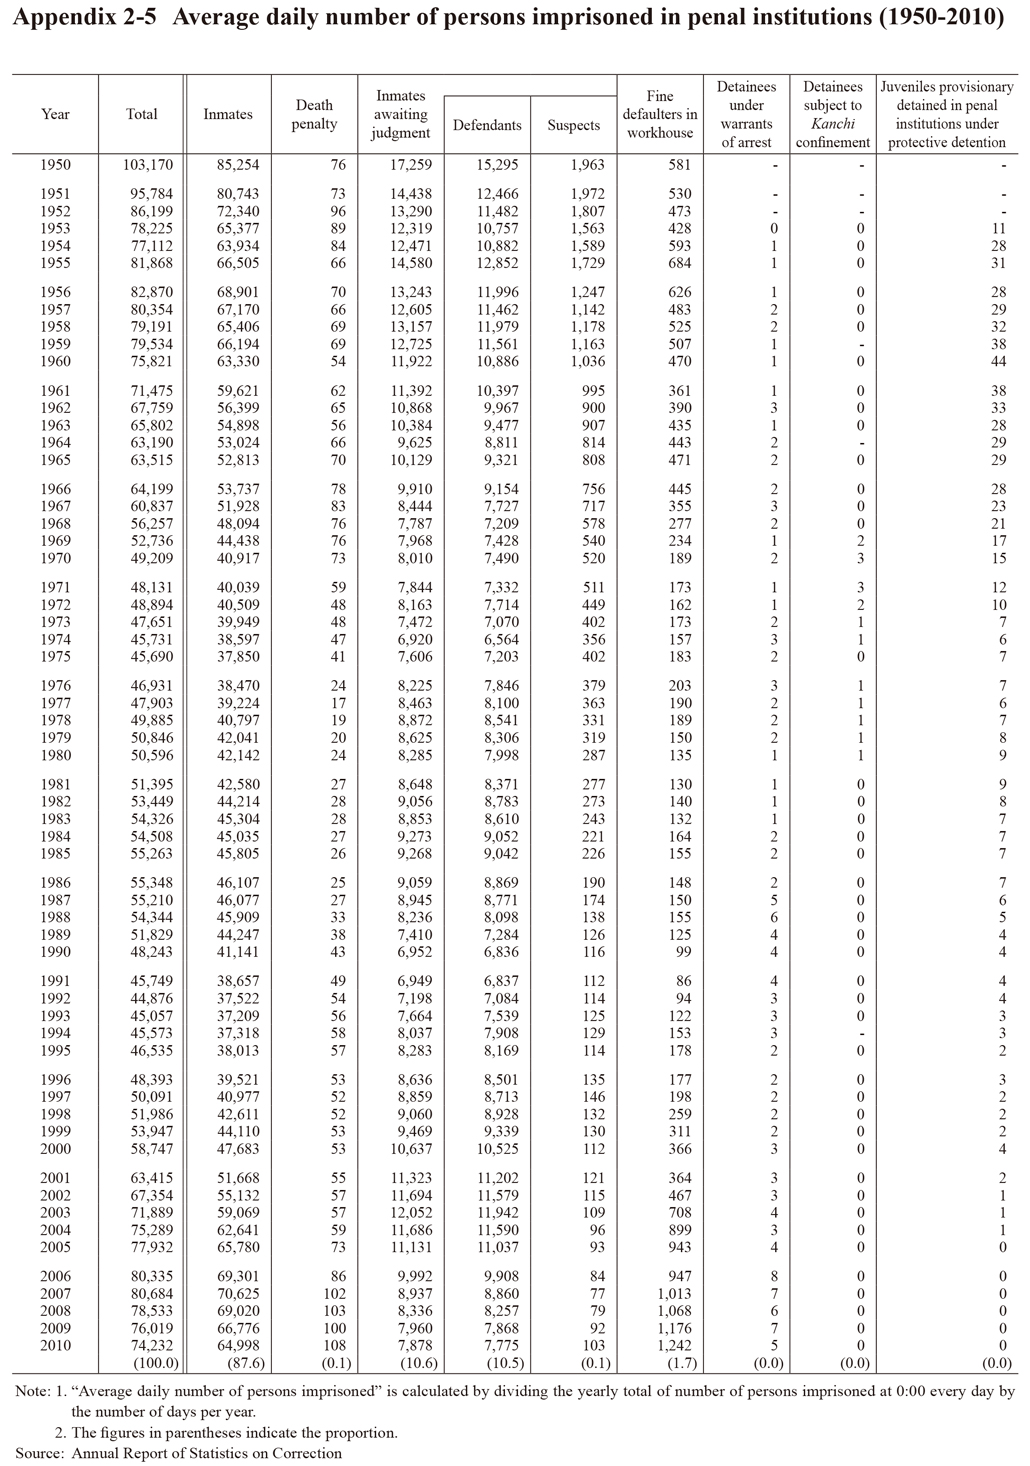 Appendix 2-5 Average daily number of persons imprisoned in penal institutions (1950-2010)
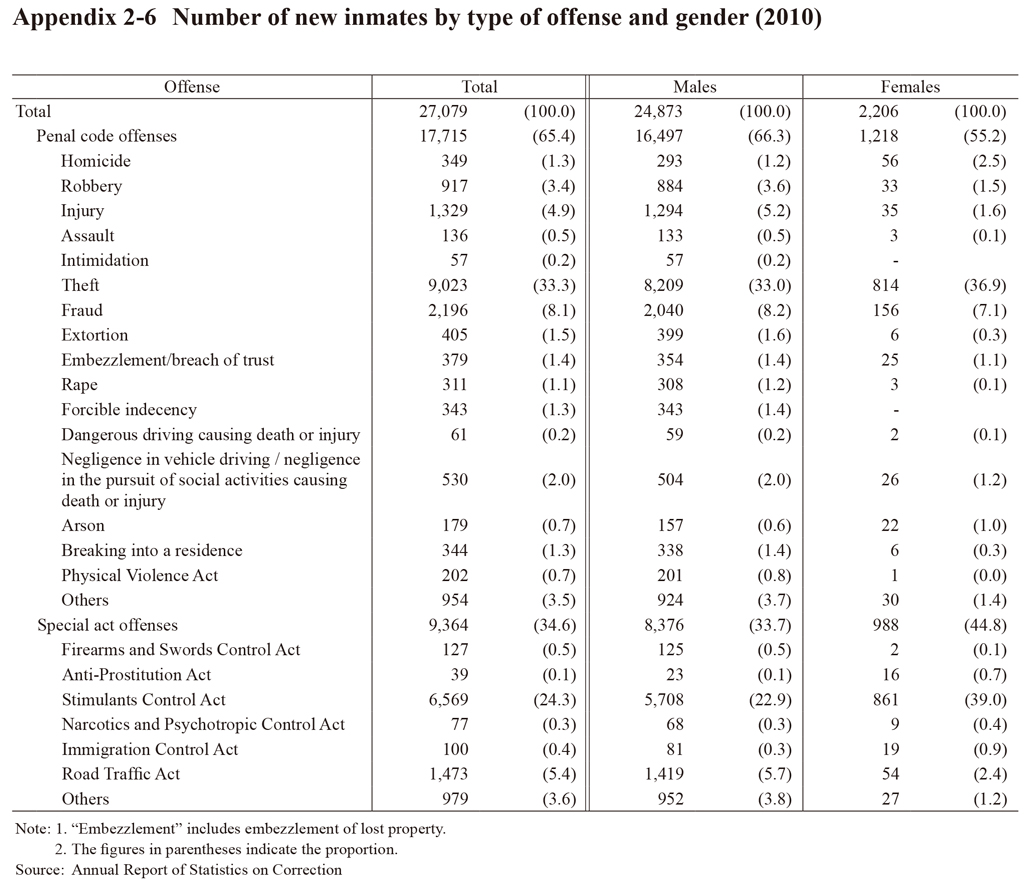 Appendix 2-6 Number of new inmates by type of offense and gender (2010)
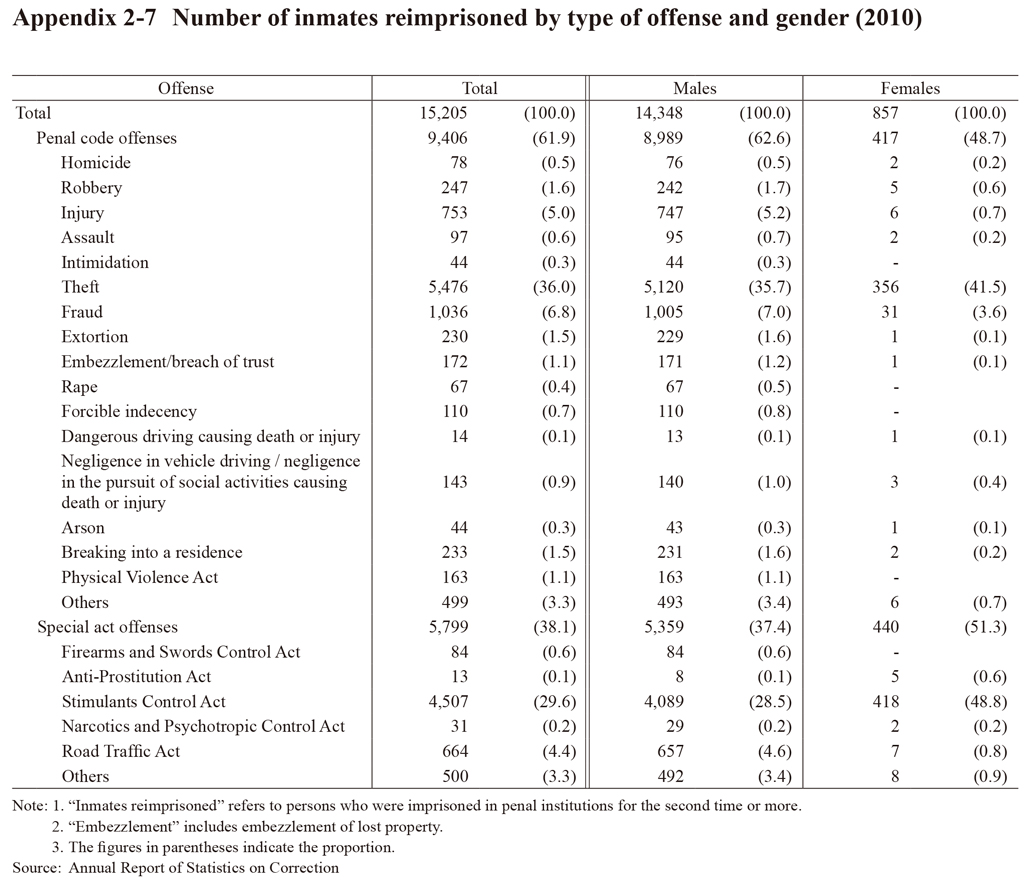 Appendix 2-7 Number of inmates reimprisoned by type of offense and gender (2010)
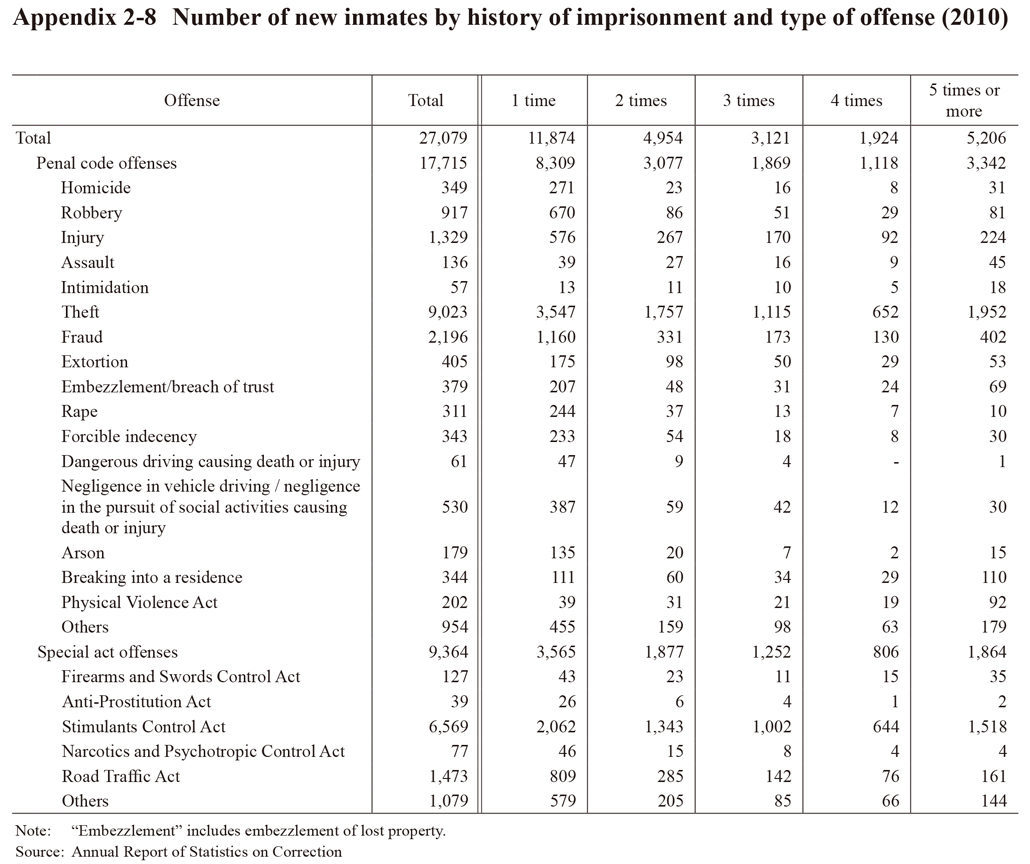 Appendix 2-8 Number of new inmates by history of imprisonment and type of offense (2010)
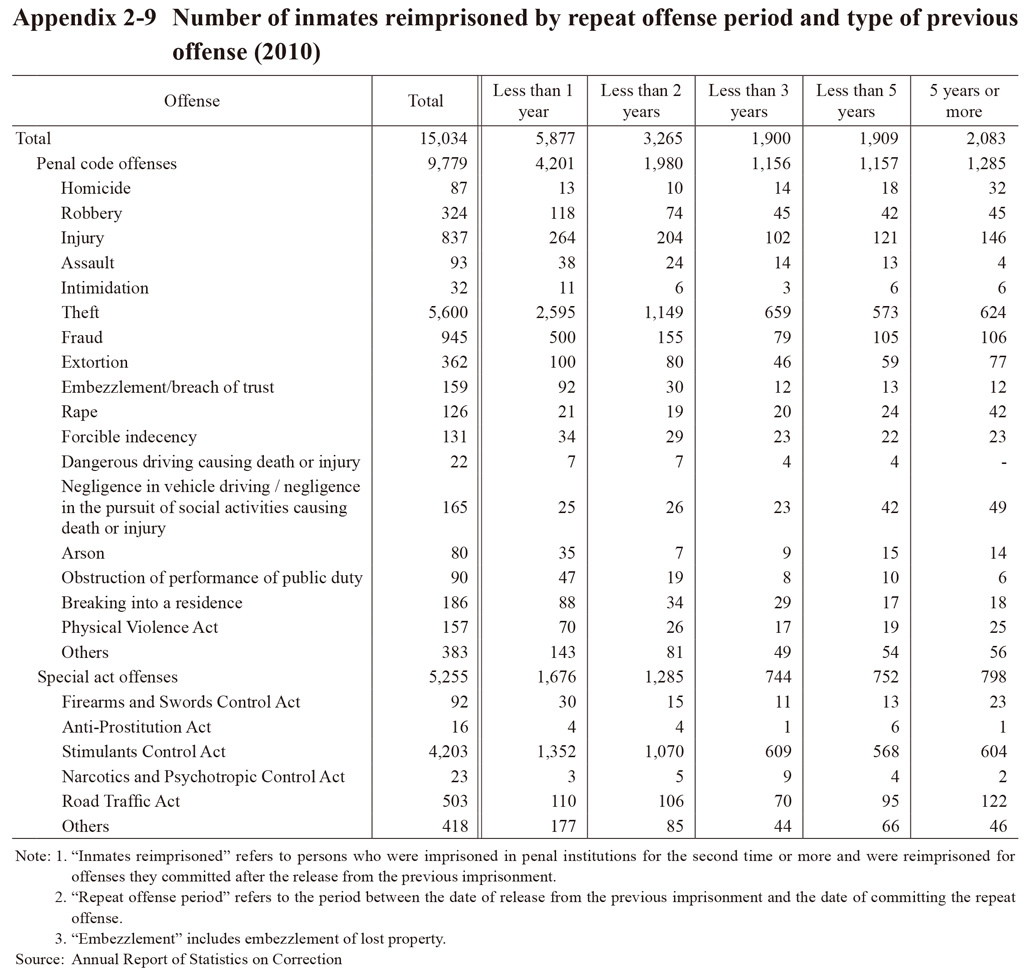

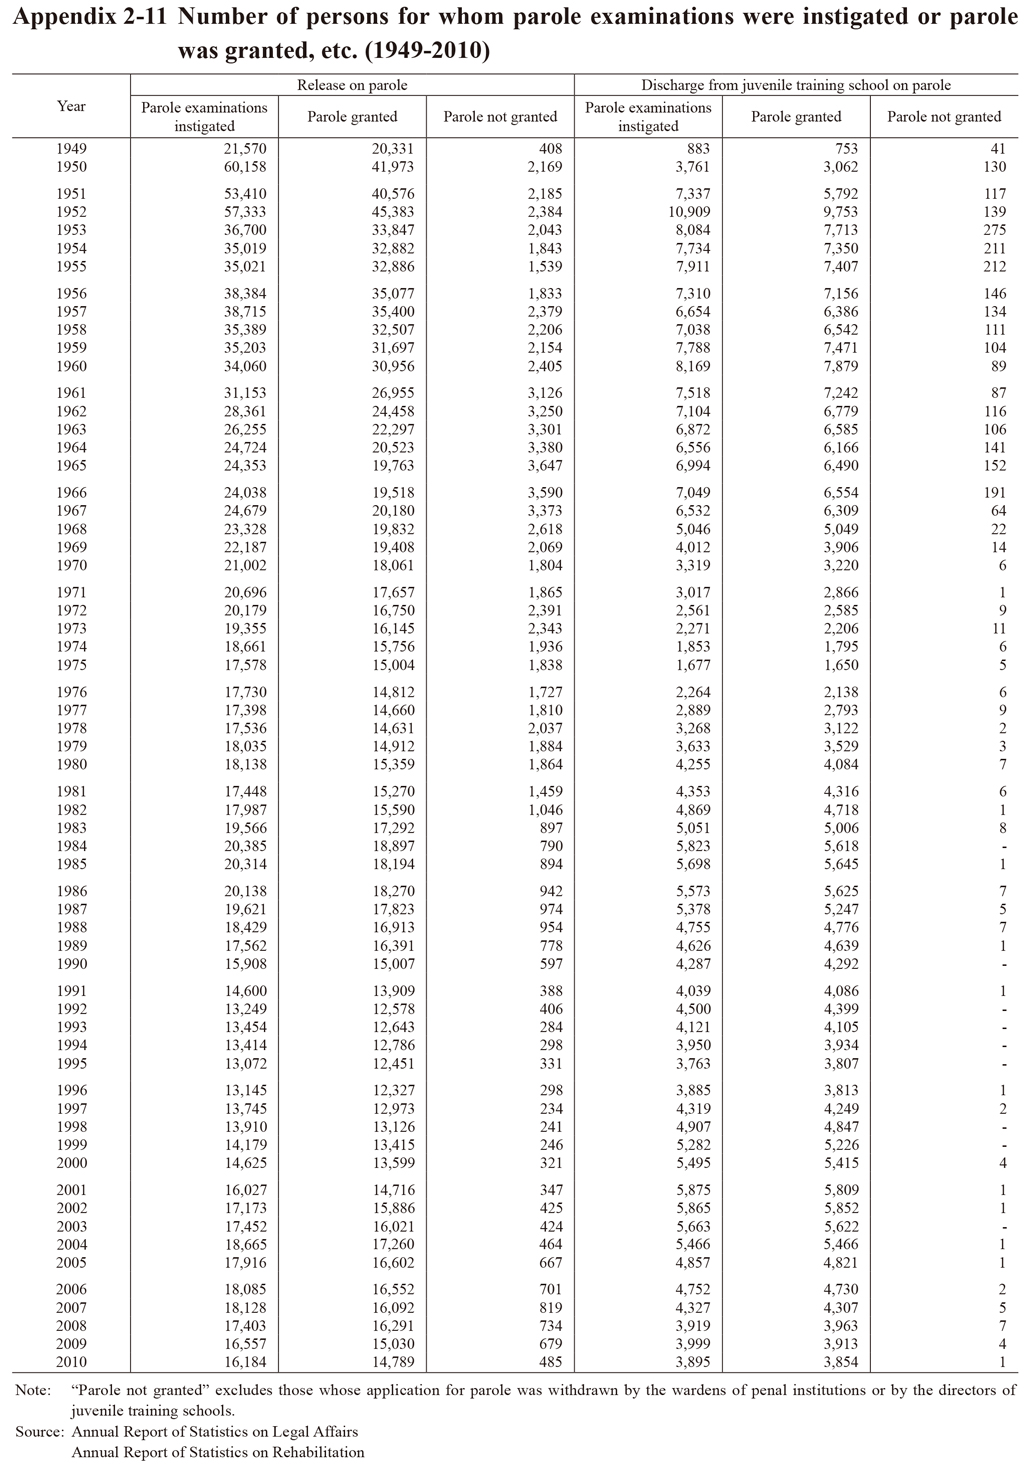
 Appendix 2-12 Number of persons newly placed under probation/parole supervision (1949-2010)
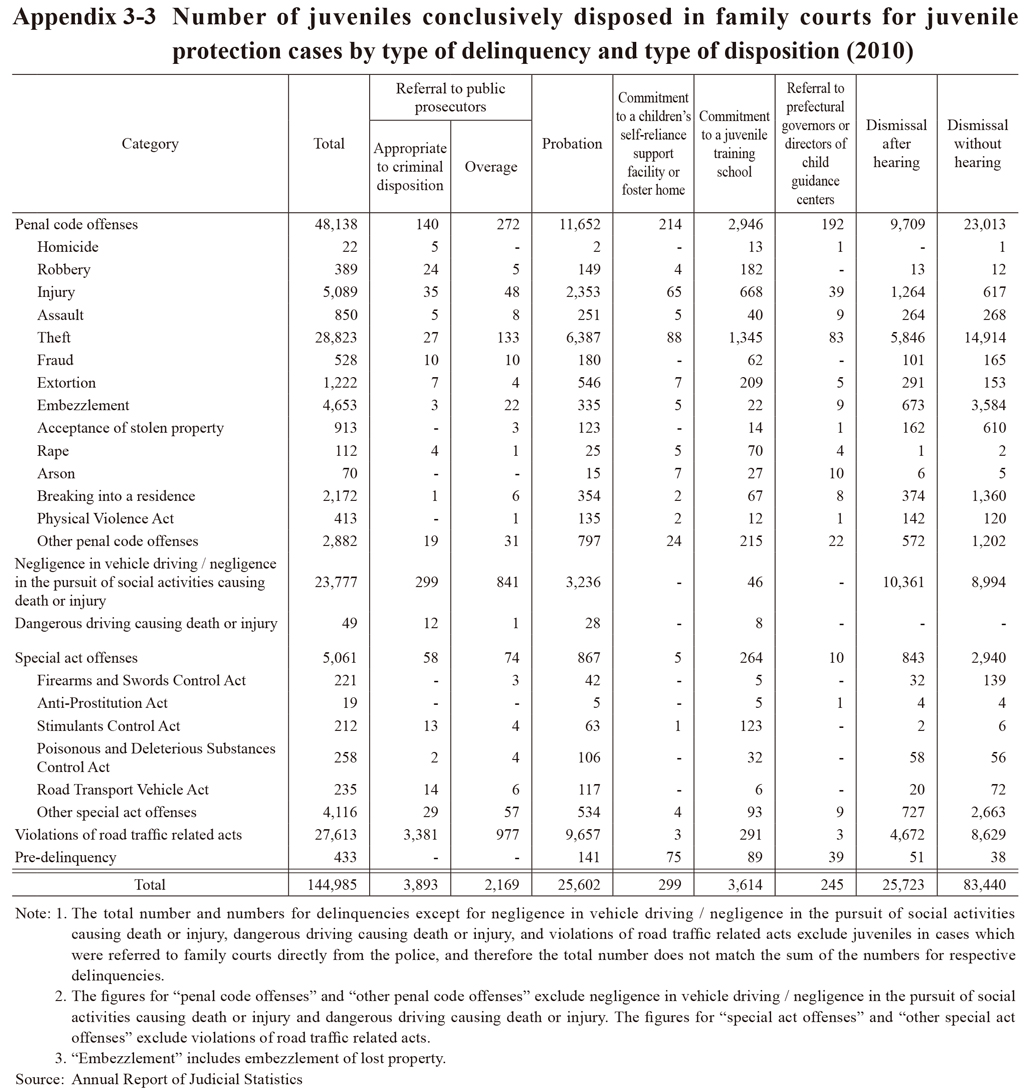
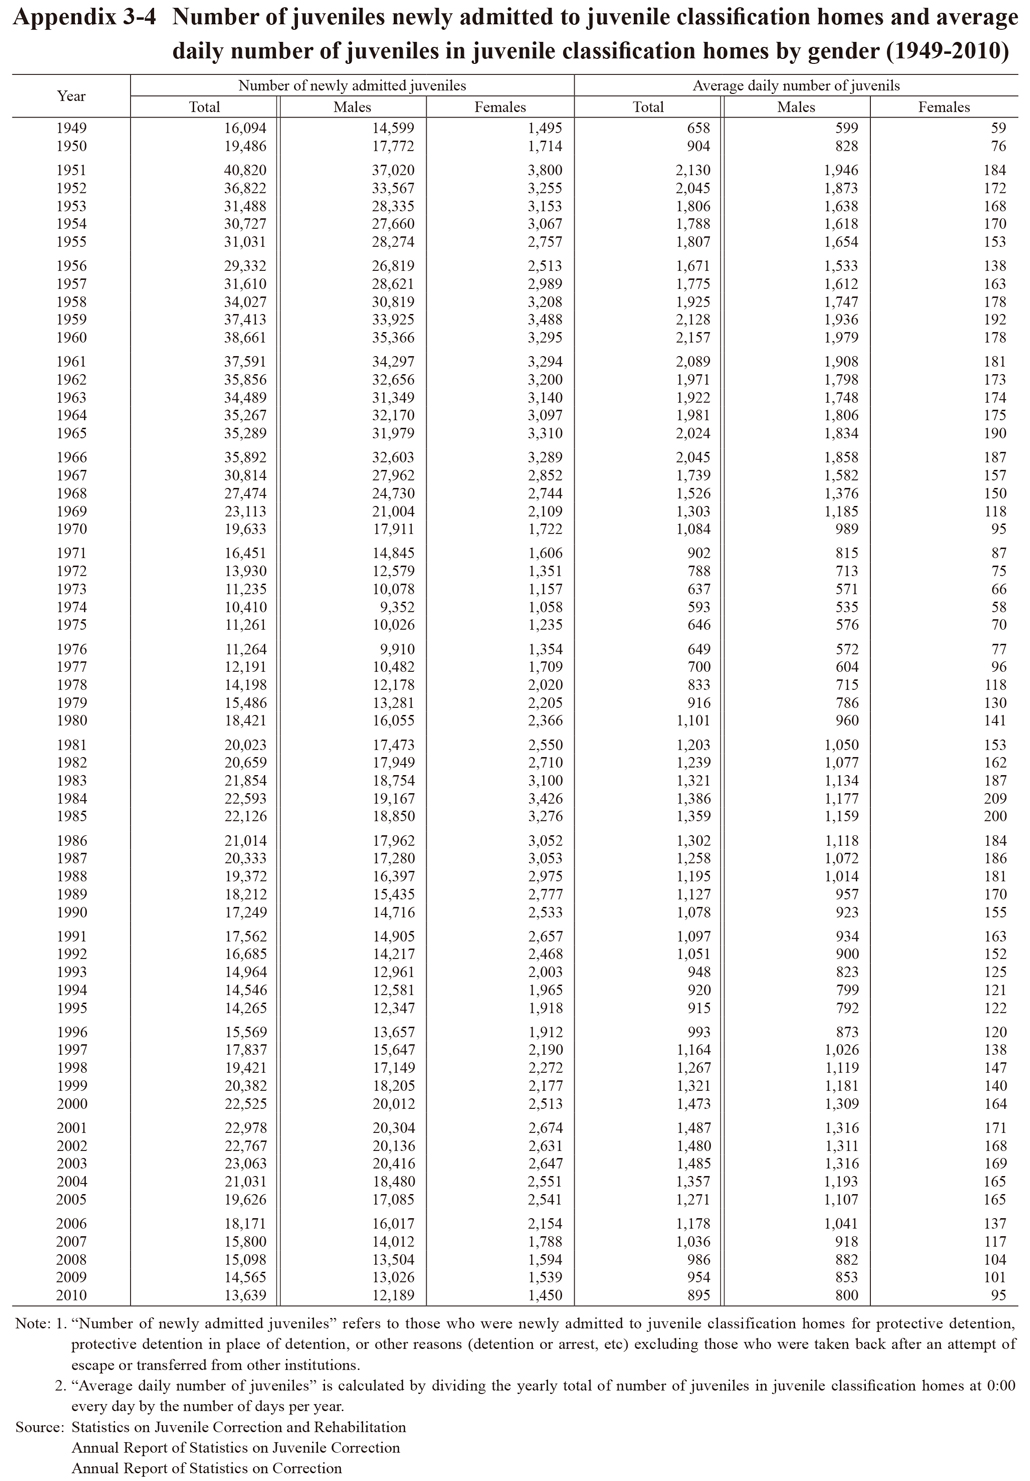
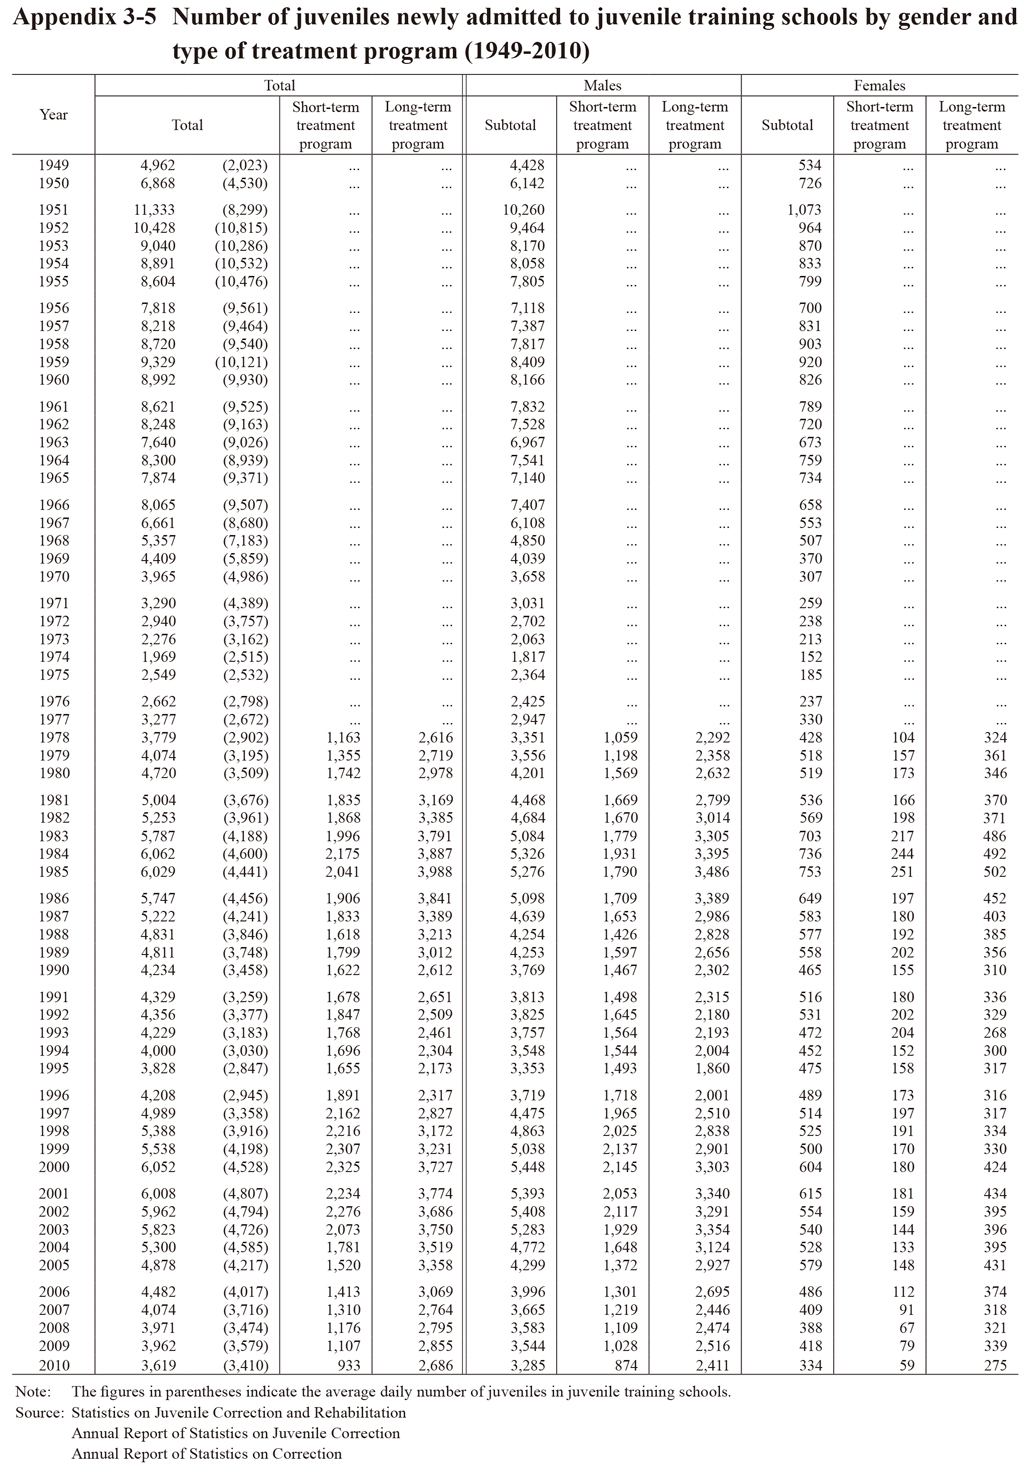
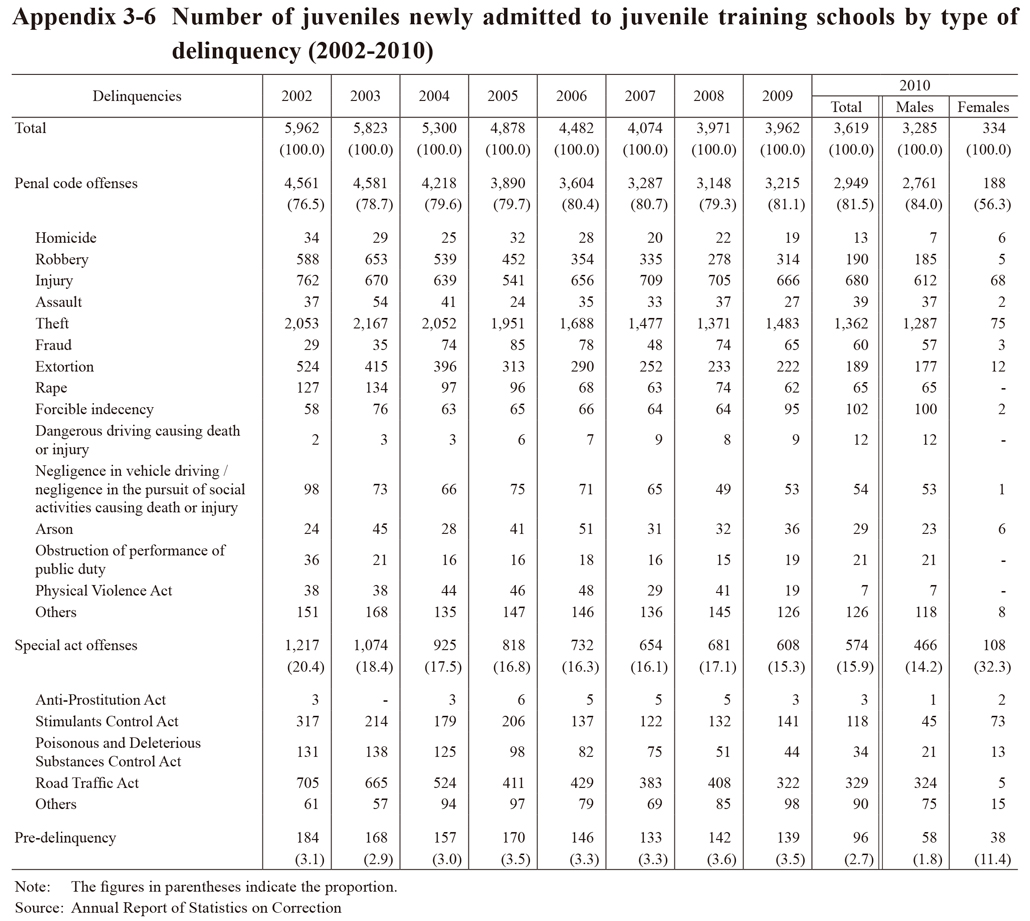
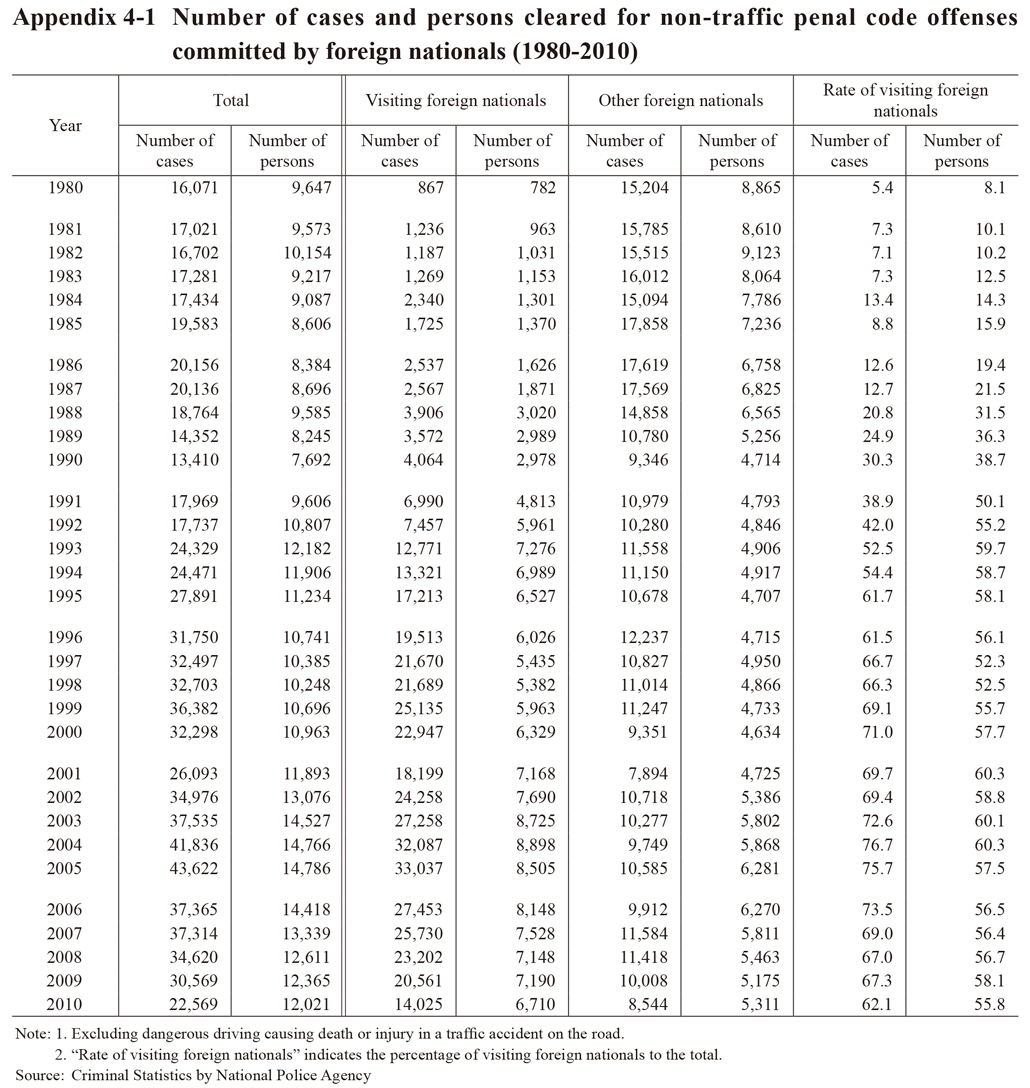
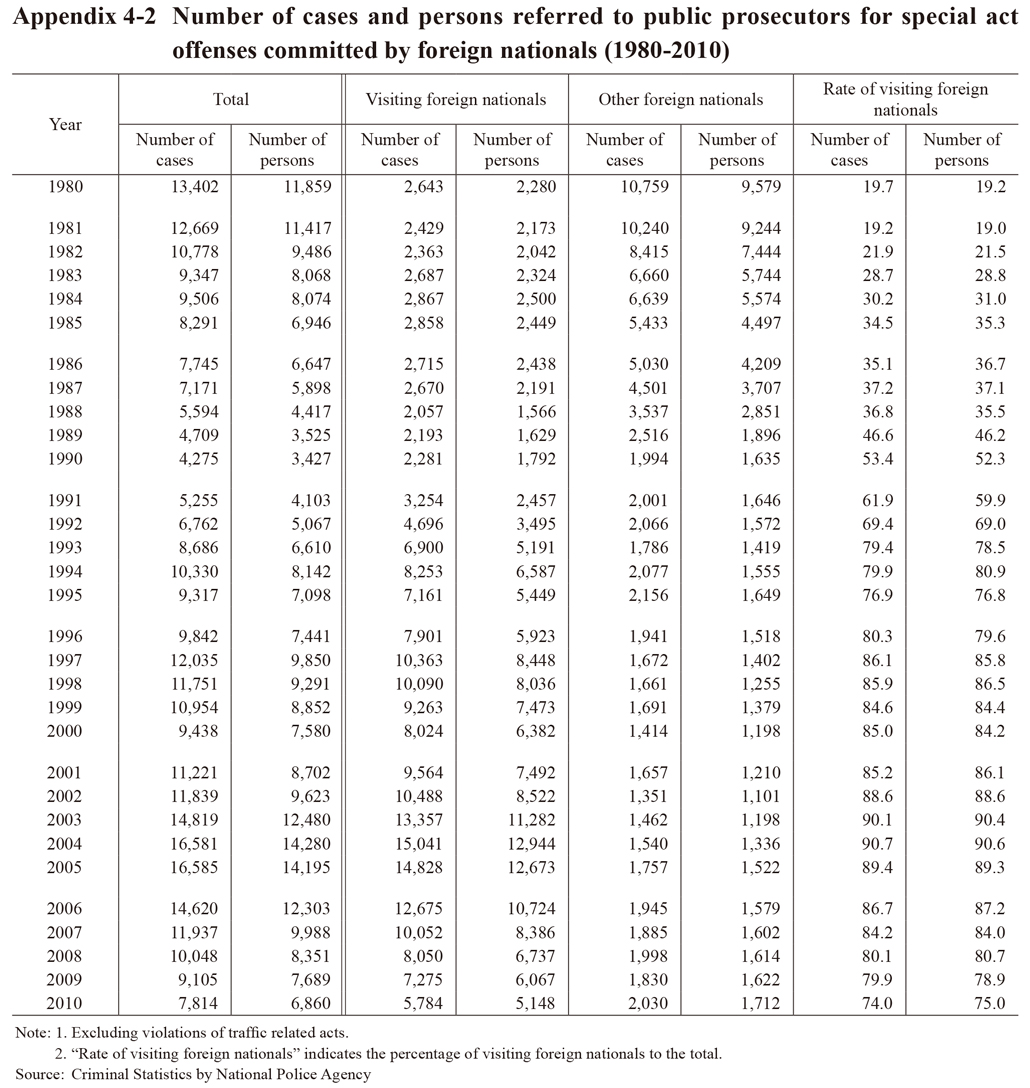
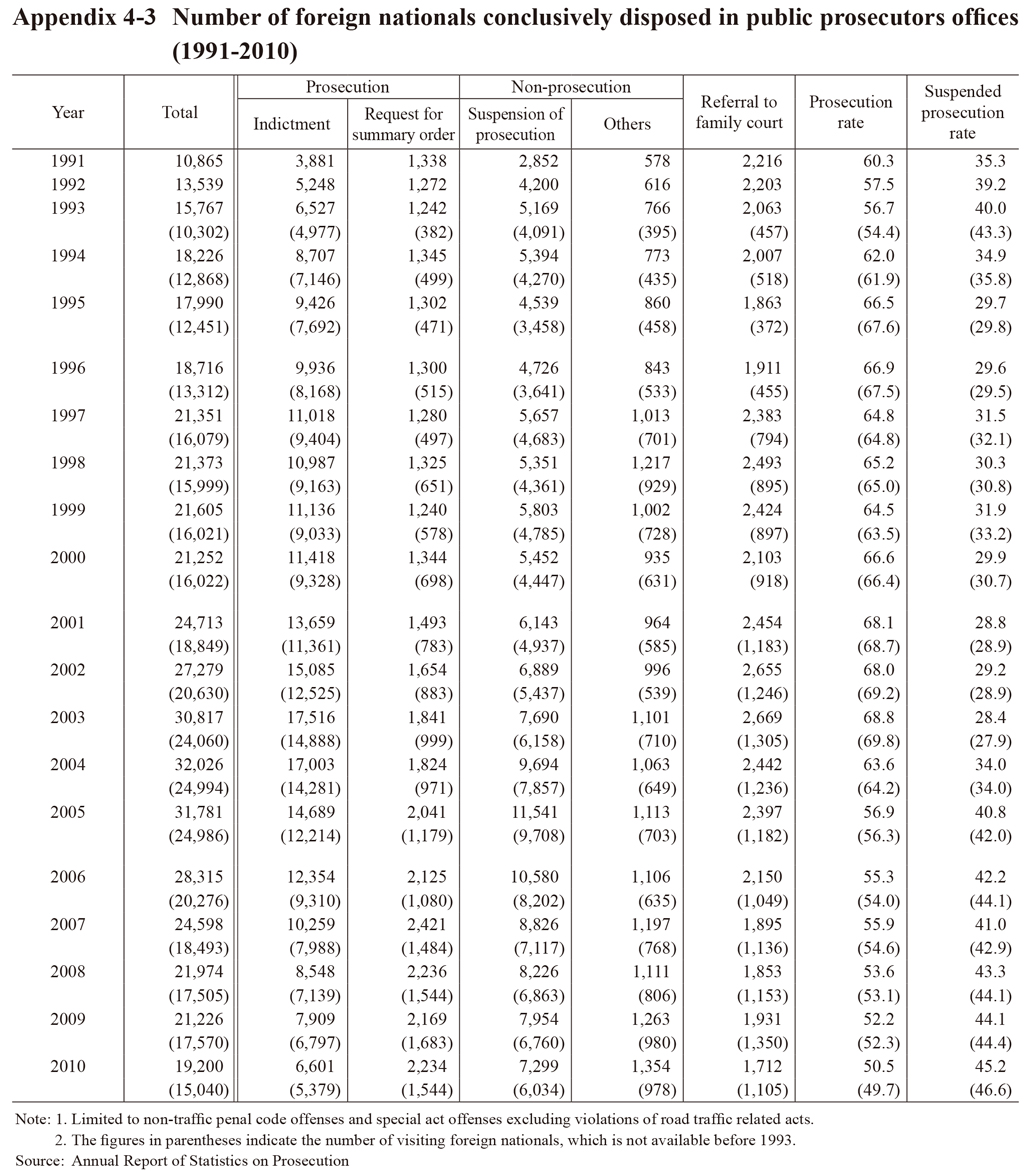
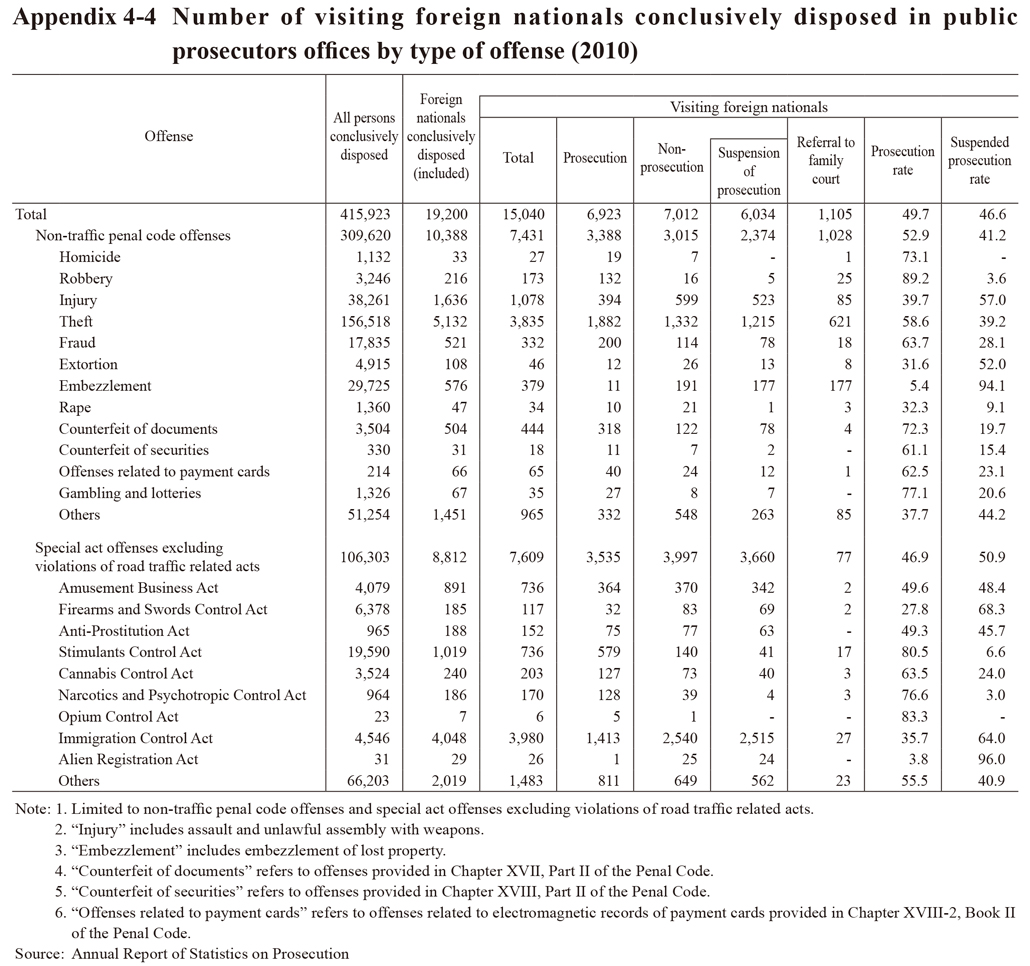
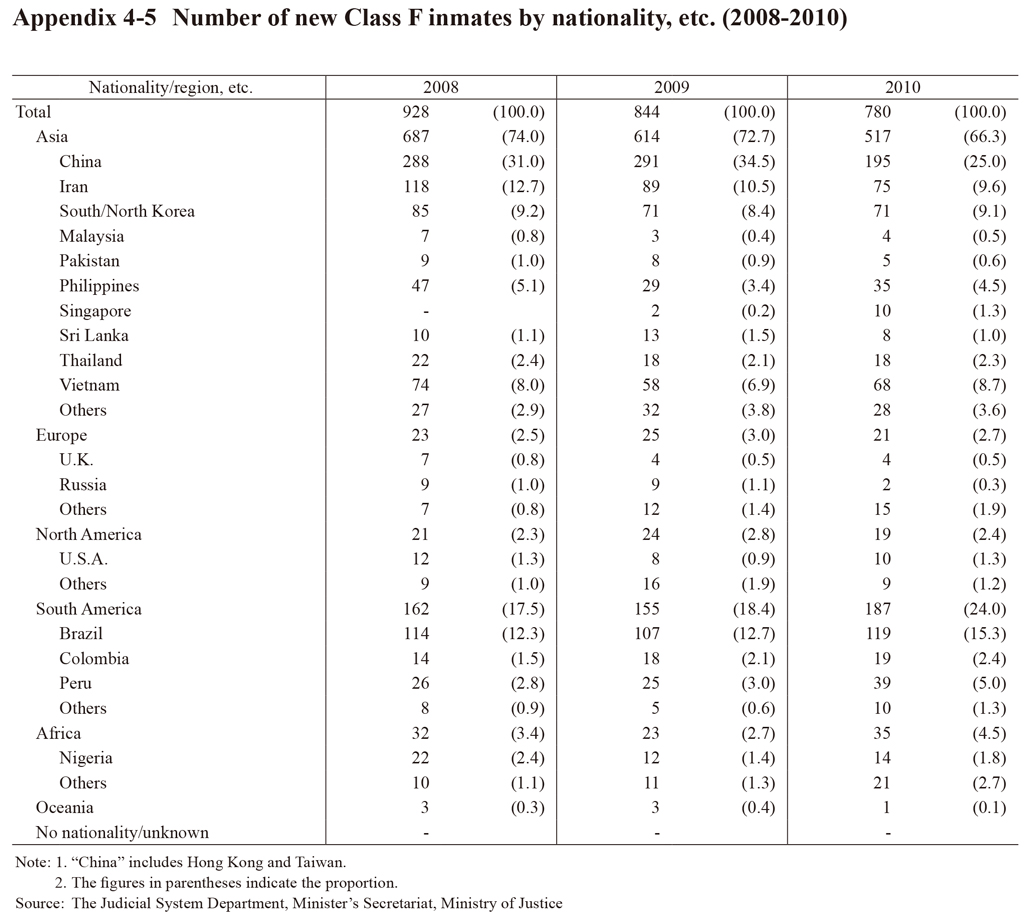 Appendix 4-5 Number of new Class F inmates by nationality, etc. (2008-2010)
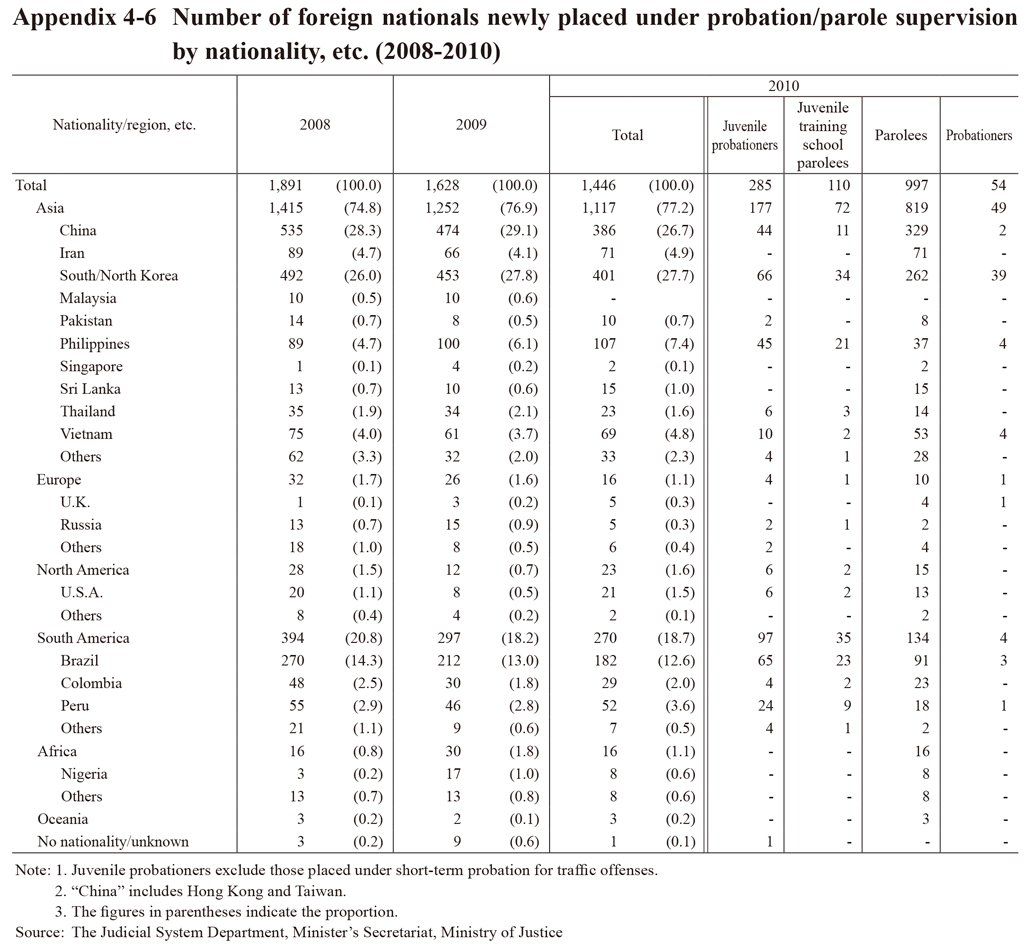
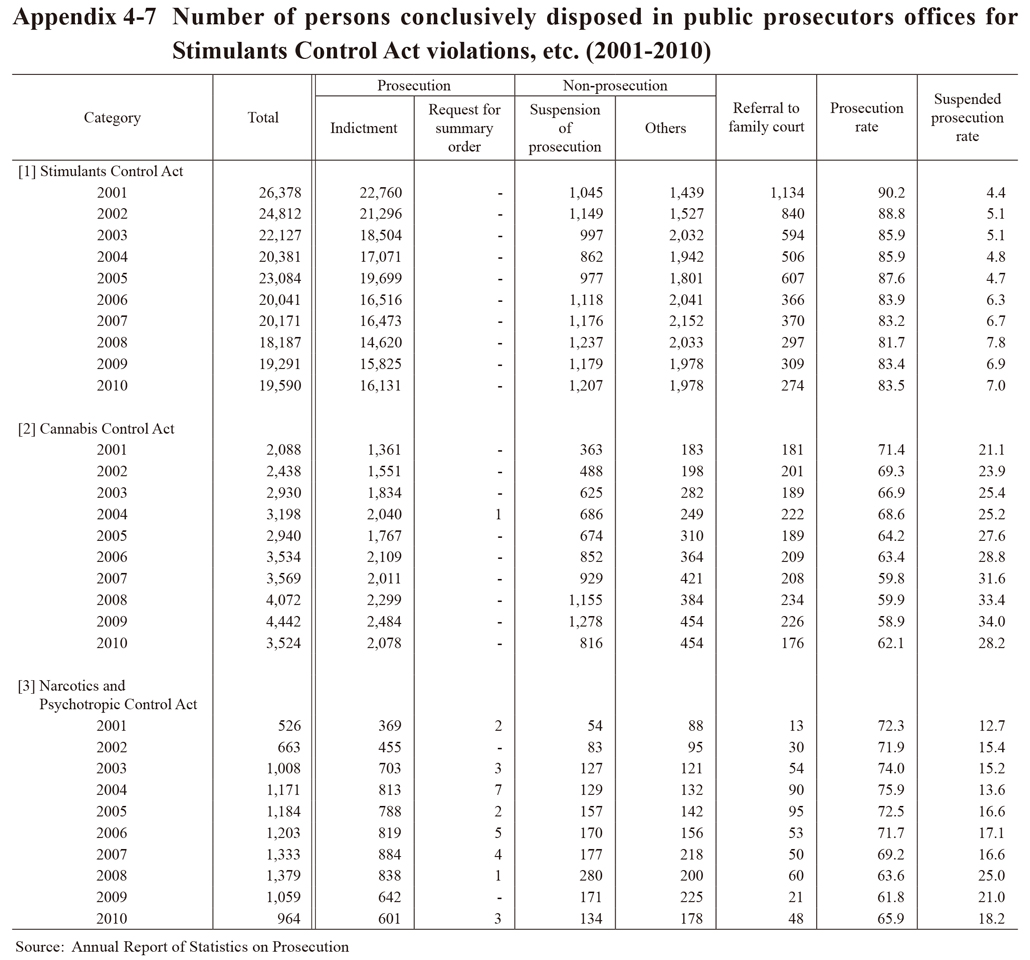
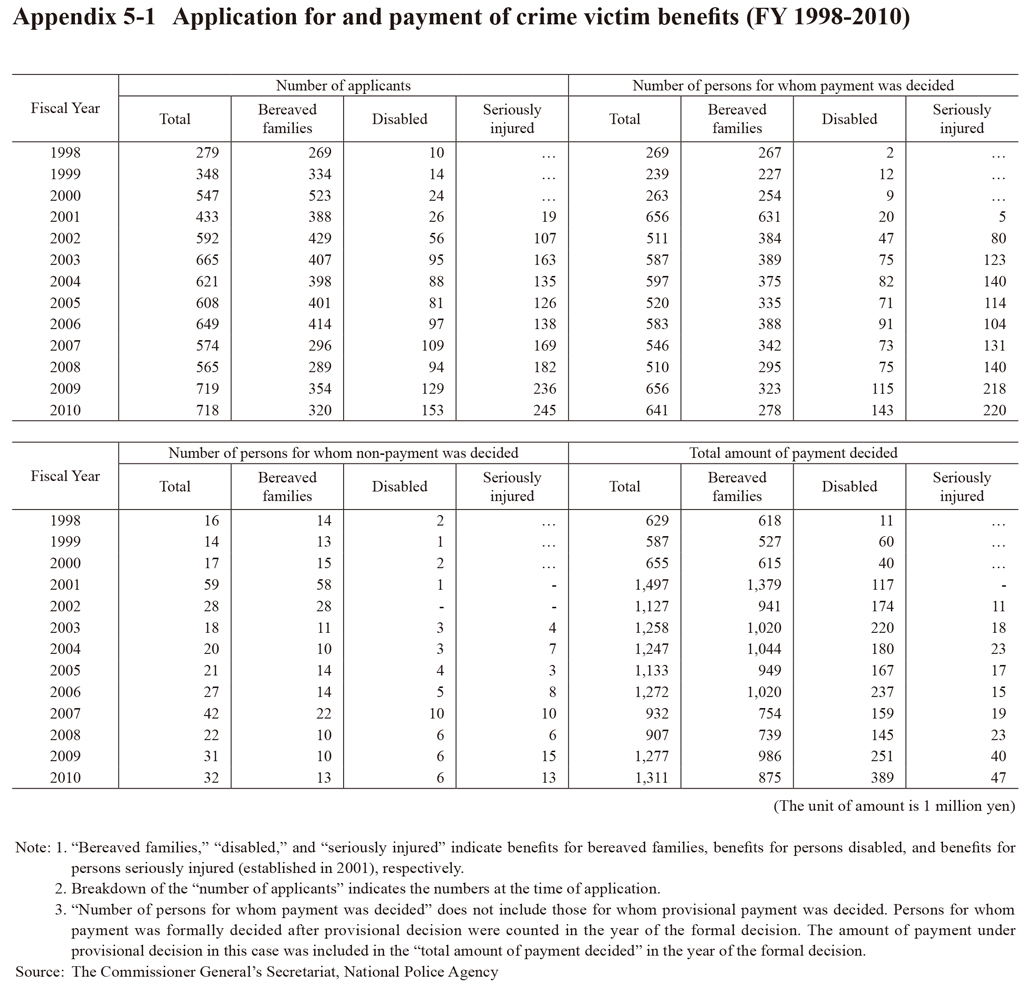 Appendix 5-1 Application for and payment of crime victim benefits (FY 1998-2010)
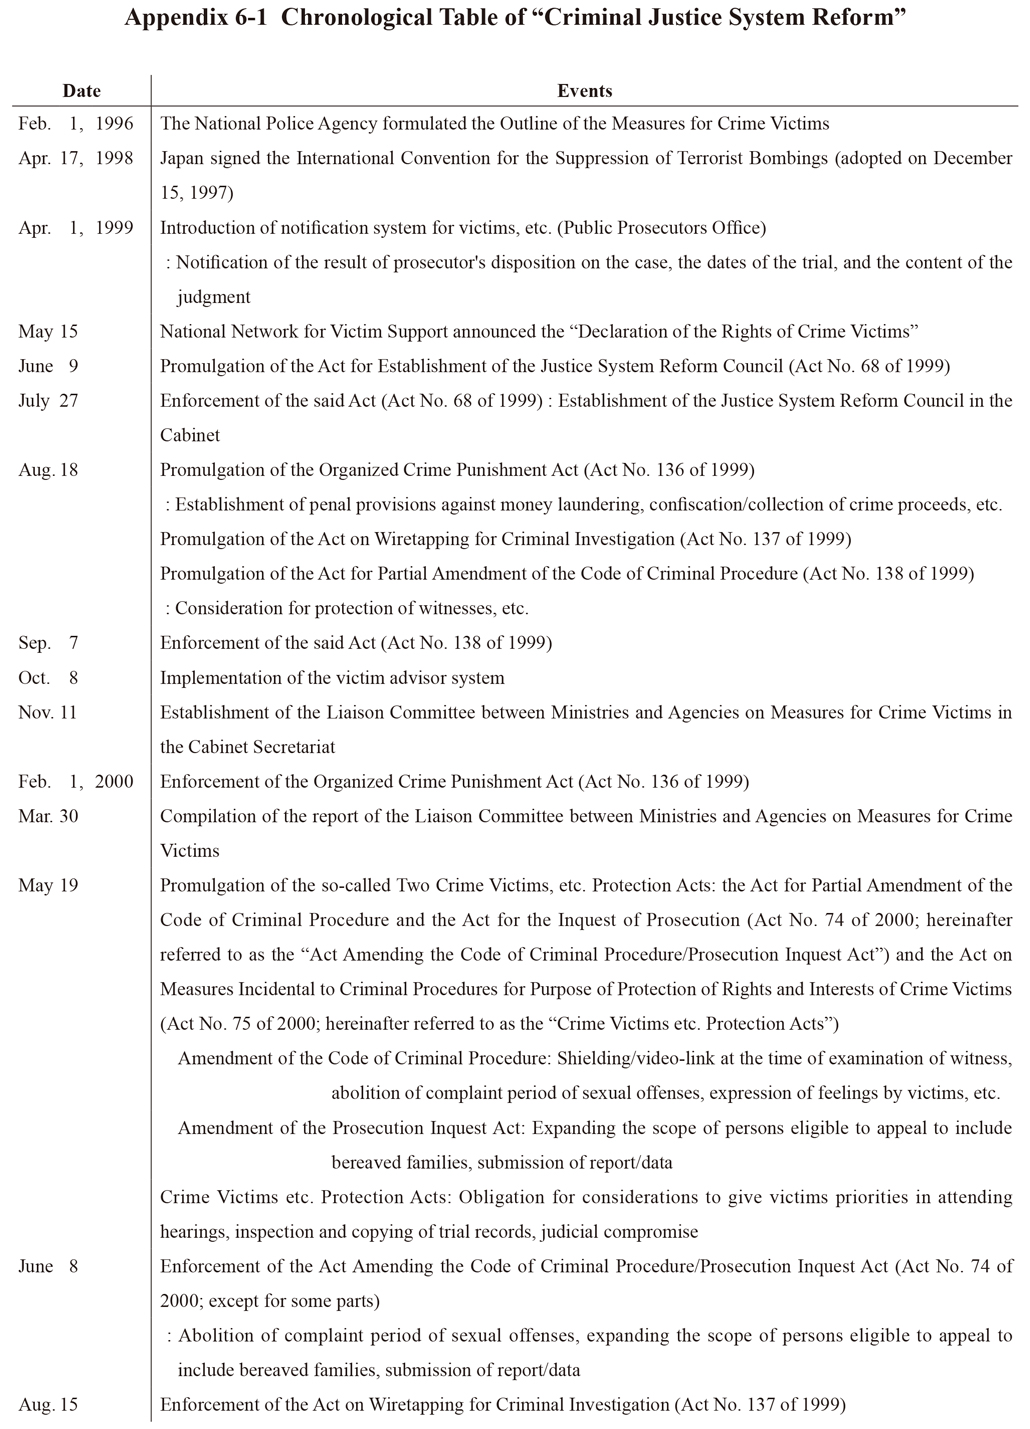 Appendix 6-1 Chronological Table of “Criminal Justice System Reform”
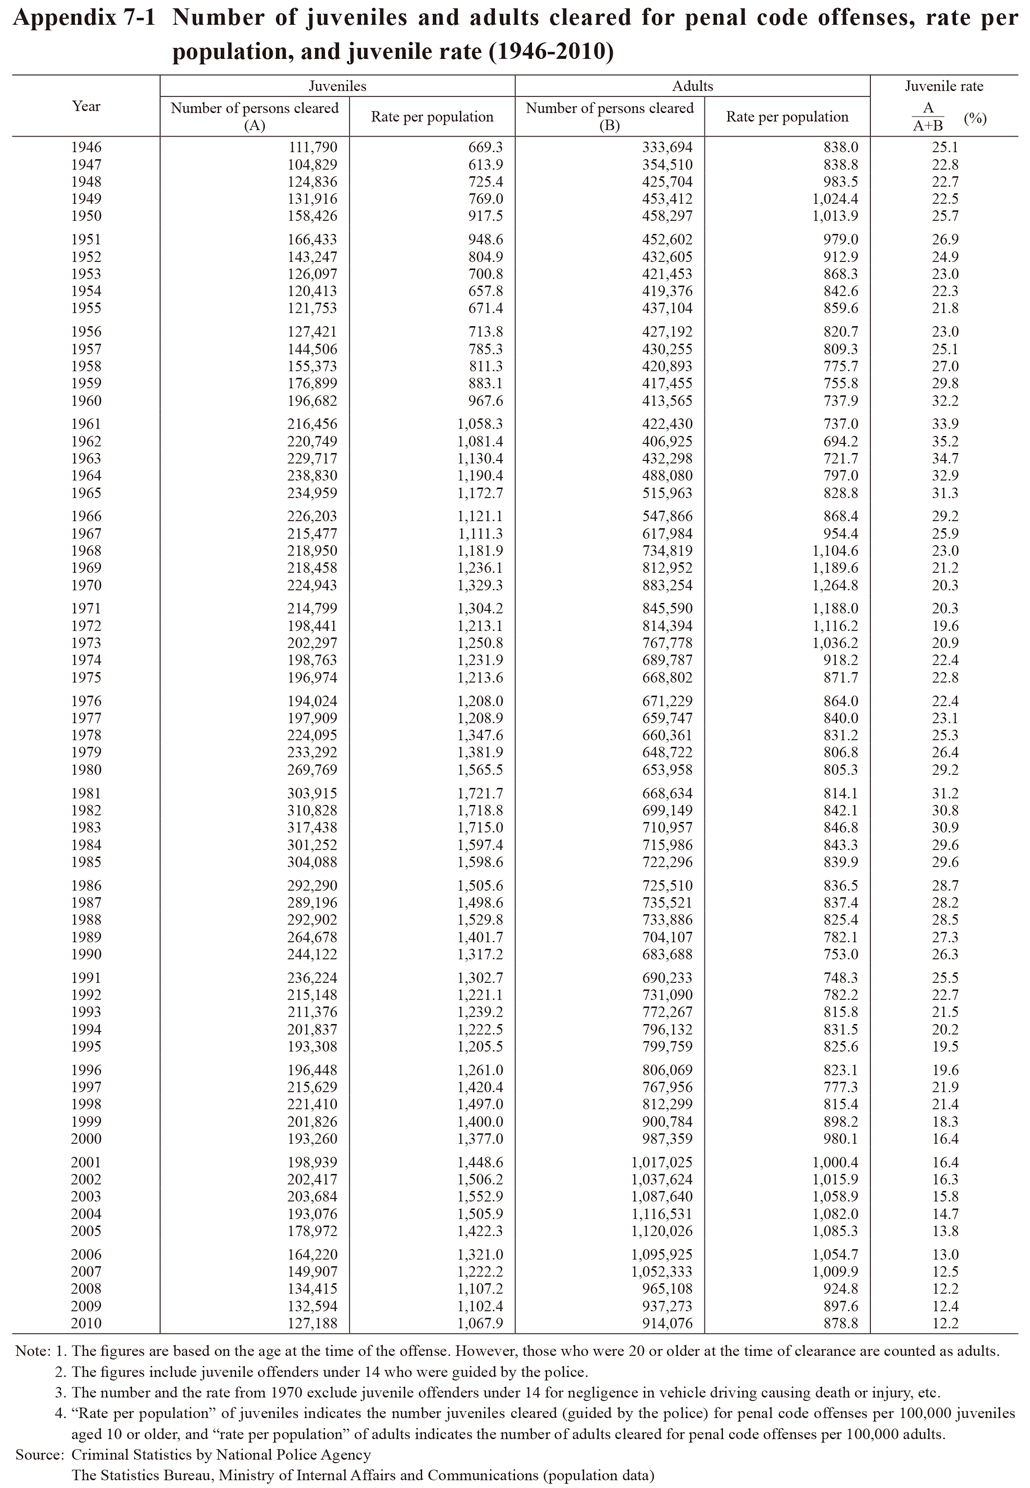
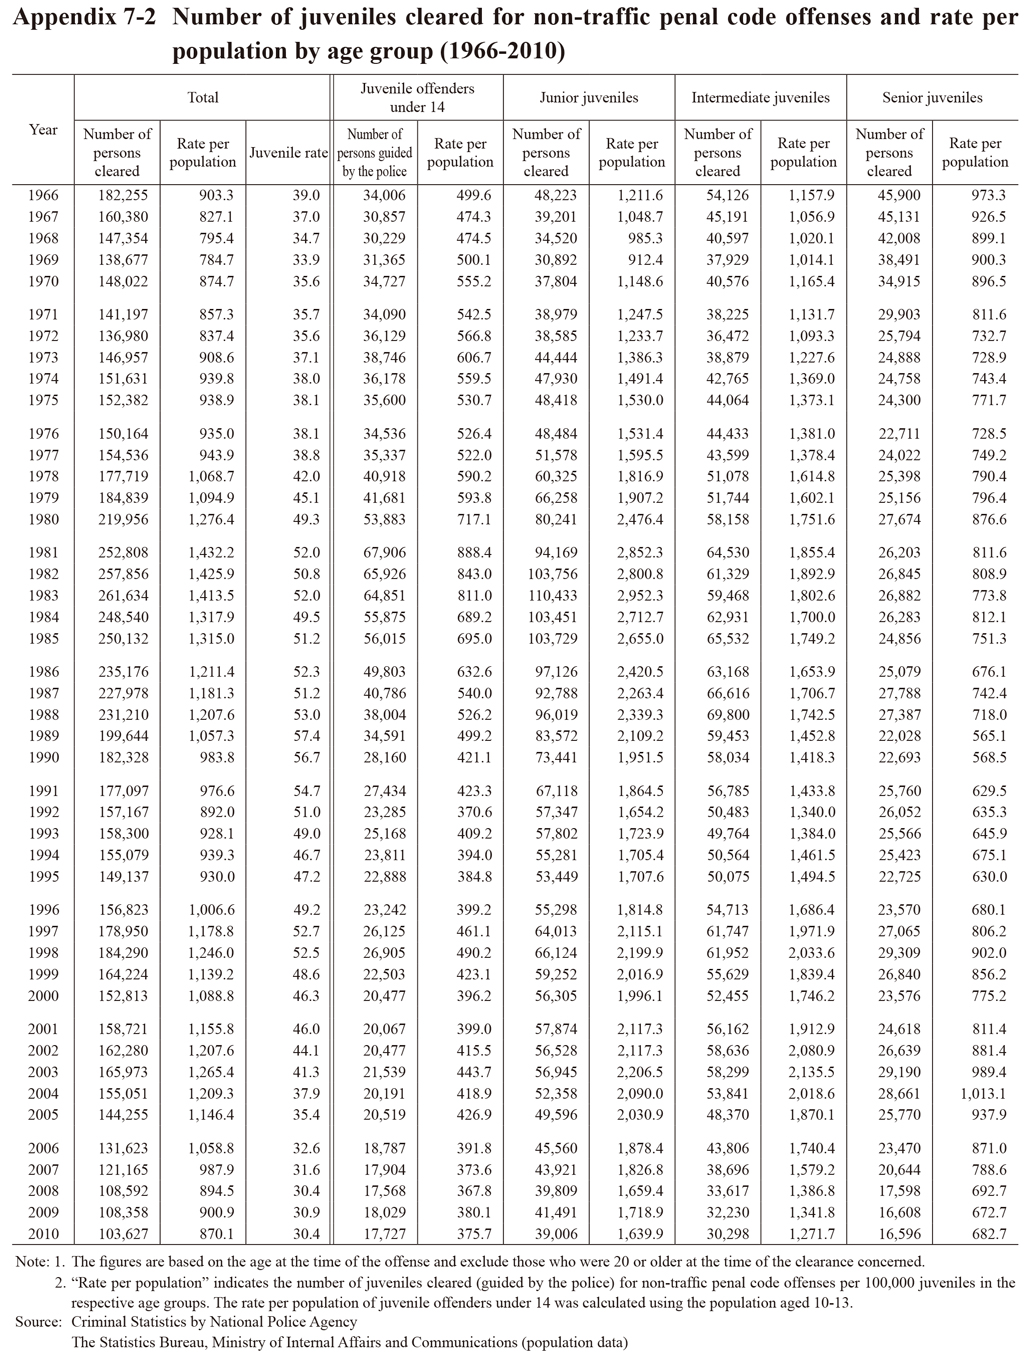
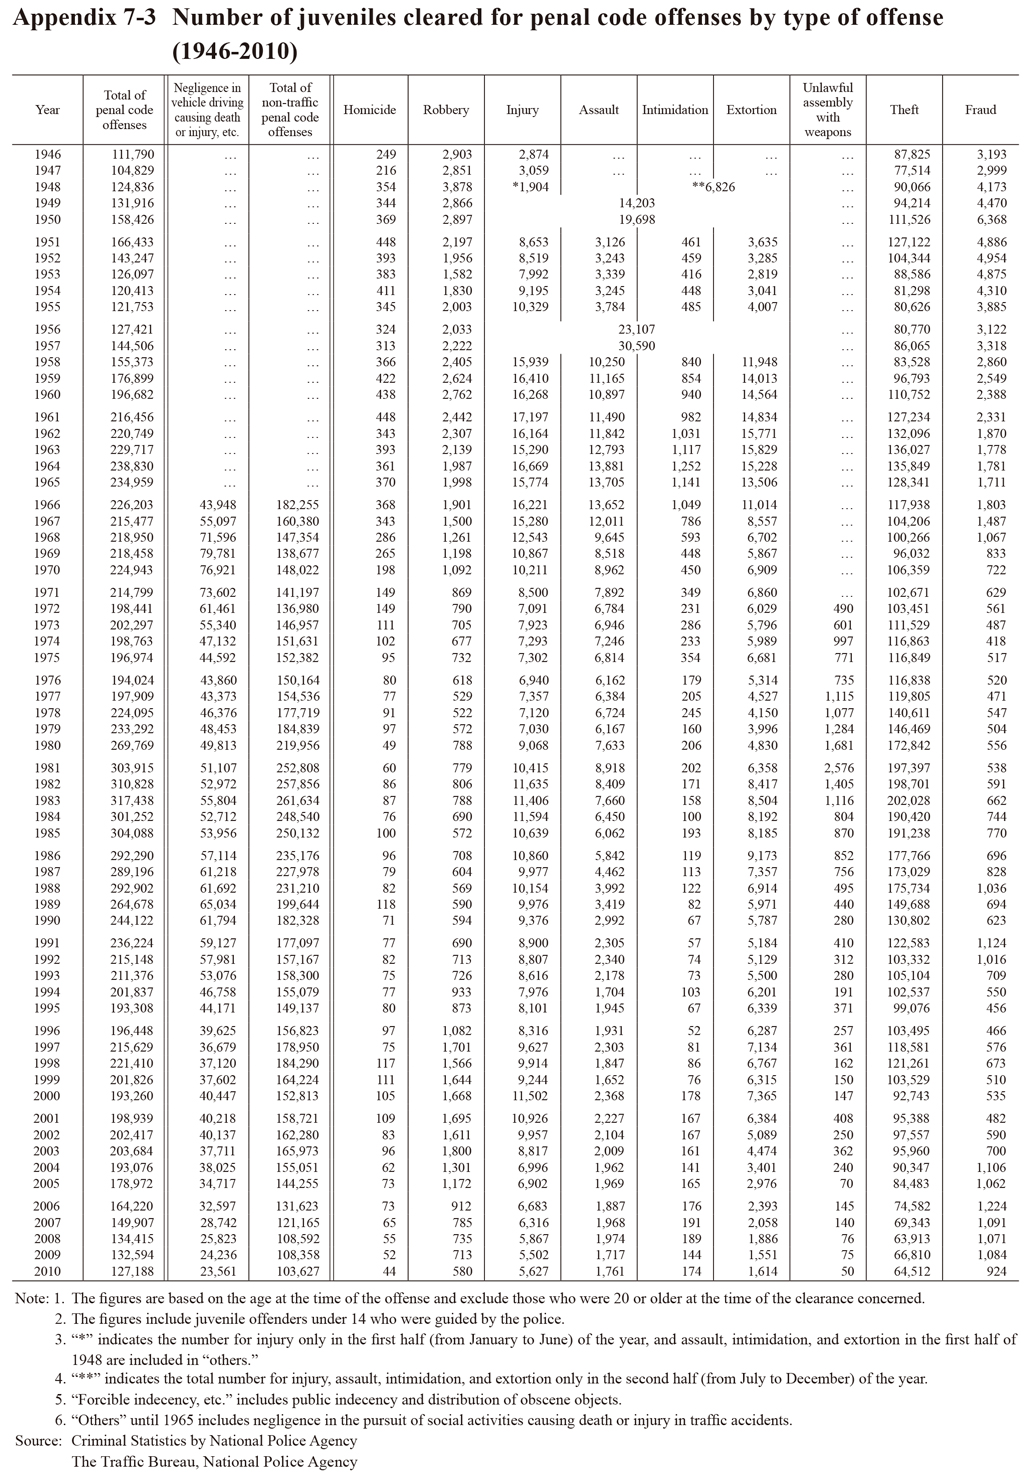 Appendix 7-3 Number of juveniles cleared for penal code offenses by type of offense