Section 5 Trends with Repeat Delinquencies/Offenses by Juveniles/Young People
1 Repeat delinquencies by juveniles
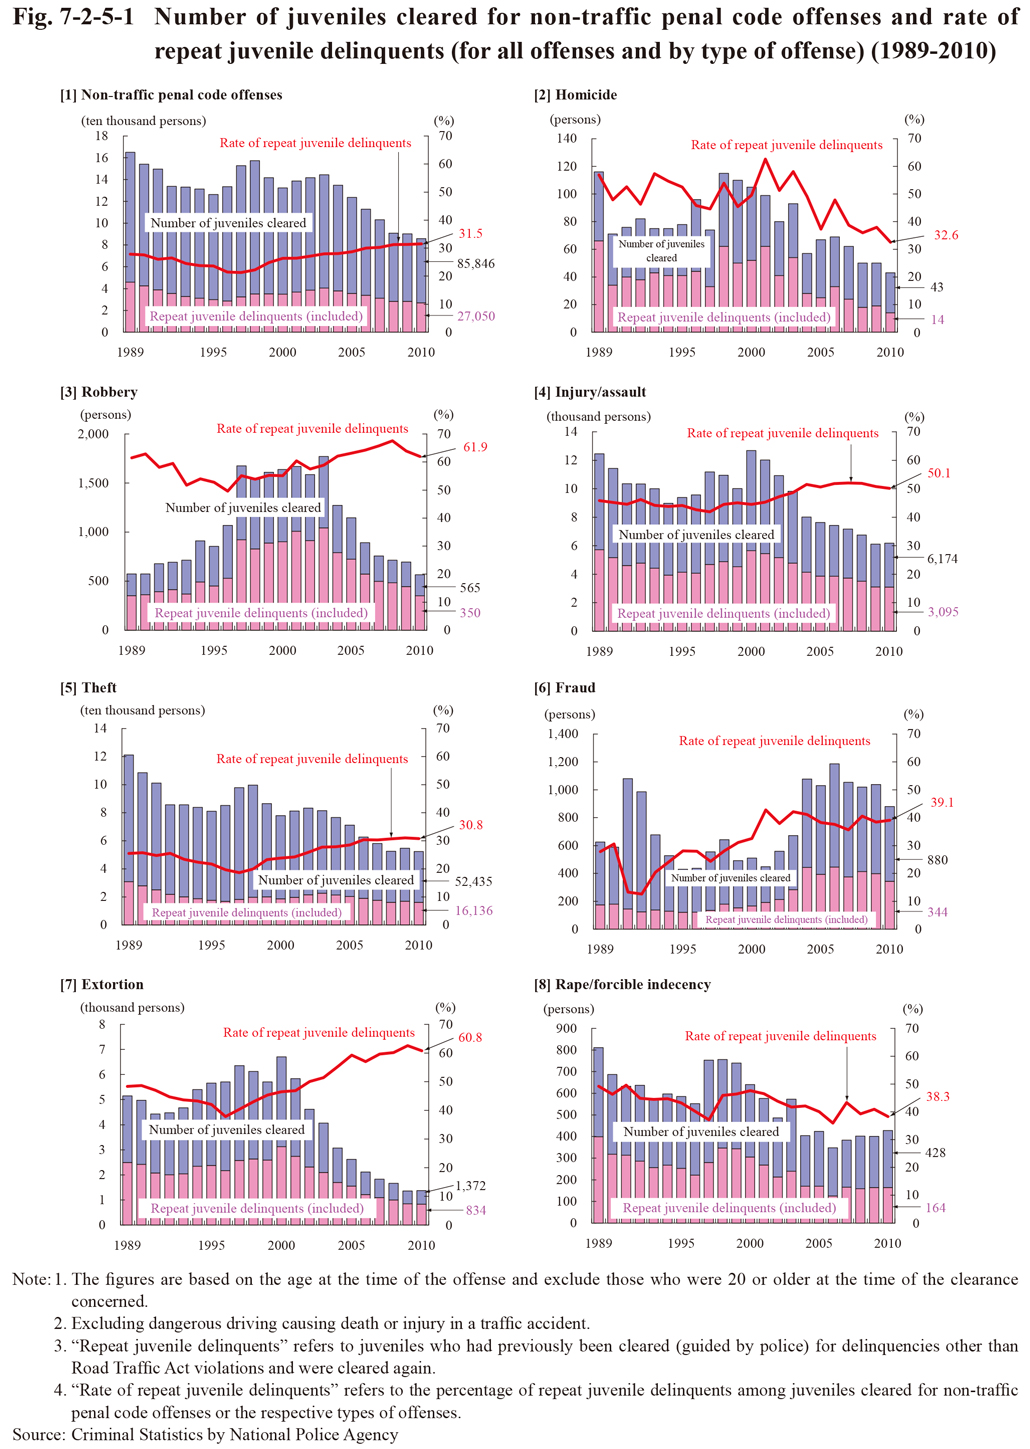
Fig. 7-2-5-1 shows the number of repeat juvenile delinquents (refers to juveniles who had previously been cleared (guided by the police) for delinquencies other than Road Traffic Act violations and who were then cleared again) cleared for non-traffic penal code offenses and the rate of repeat juvenile delinquents (refers to the percentage of repeat juvenile delinquents to total juveniles cleared for non-traffic penal code offenses) since 1989. With all non-traffic penal code offenses the number of repeat juvenile delinquents decreased every year from 2004 through to 2010, whereas the rate of repeat juvenile delinquents rose every year after reaching a minimum in 1997. A similar trend can be observed with theft, which accounted for the majority of non-traffic penal code offenses, although the rate of repeat juvenile delinquents was not particularly high when compared to other offenses. The rate of repeat juvenile delinquents was remarkably high for robbery when compared to all non-traffic penal code offenses, accounting for over 50% every year, although excluding1996. That for extortion was also high, having risen by 22.9 points from 37.9% in 1996 to 60.8% in 2010.
Fig. 7-2-5-1 Number of juveniles cleared for non-traffic penal code offenses and rate of repeat juvenile delinquents (for all offenses and by type of offense) (1989-2010)