3 Term of imprisonment
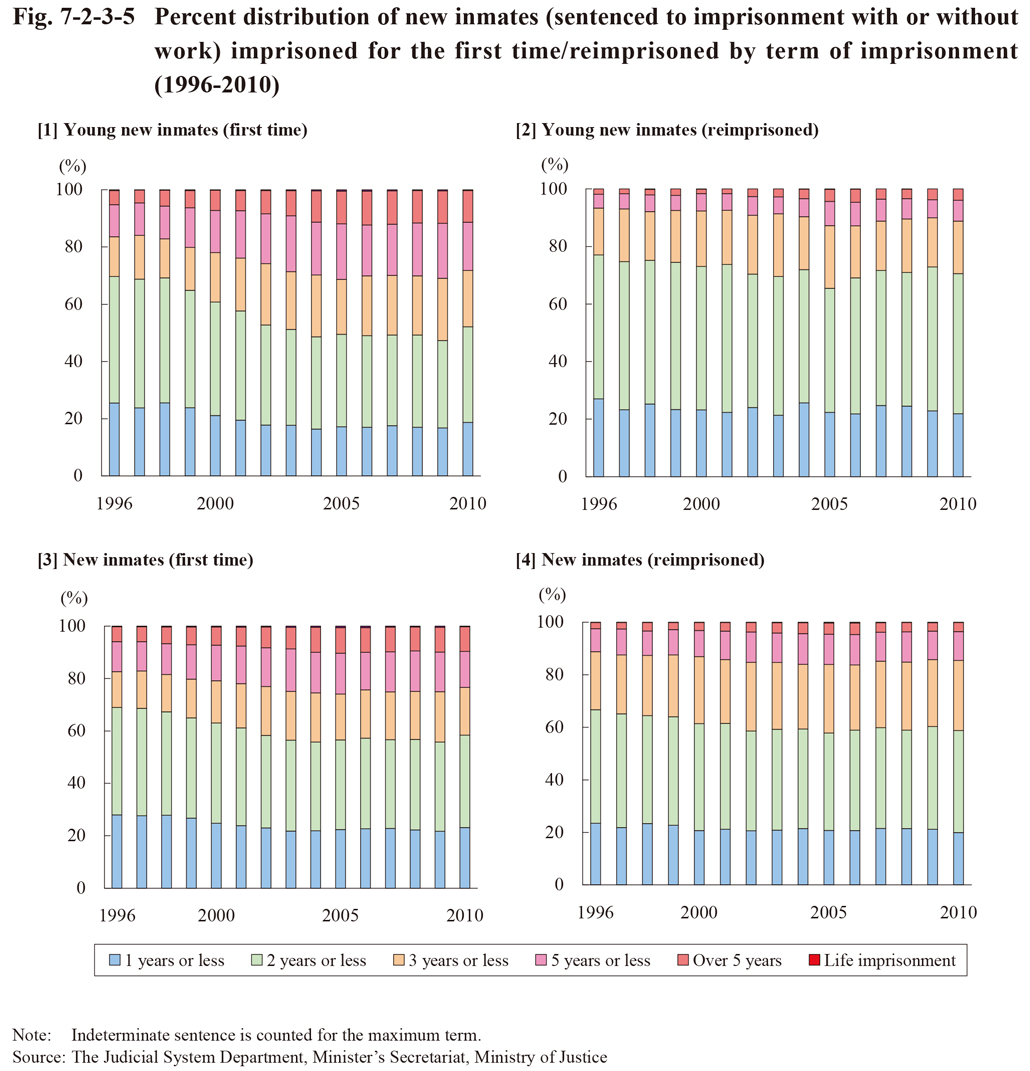
Fig. 7-2-3-5 shows the percent distribution of young new inmates and all new inmates (both are limited to those sentenced to imprisonment with or without work; hereinafter the same in this subsection) imprisoned for the first time/reimprisoned by term of imprisonment since 1996.
With those imprisoned for the first time the term of imprisonment of young new inmates was increasing from 1996 through to 2004, but then remained stable from 2005, whereas that of all new inmates showed similar trends. However, the percentage of those imprisoned for a longer term was slightly higher with young new inmates than with all new inmates.
With those reimprisoned no significant changes were observed in the percent distribution of young new inmates and the same with all new inmates. However, the percentage of those imprisoned for a shorter term was significantly higher with young new inmates than with all new inmates.
In 2010 the percentage of those imprisoned for two years or less was 70.6% with young new inmates reimprisoned, which was higher than that with young inmates newly imprisoned for the first time (52.1%), and that with all new inmates reimprisoned (58.8%), thus indicating a higher percentage of those imprisoned for a shorter term with young inmates reimprisoned (this is probably due to the fact that the percentage of those with a short period between the completion of the term of their imprisonment for a previous offense and the trial date for their repeat offense was higher with young new inmates reimprisoned and therefore they were not granted suspension of execution of the sentence and were sentenced to imprisonment for a short term).
Fig. 7-2-3-5 Percent distribution of new inmates (sentenced to imprisonment with or without work) imprisoned for the first time/reimprisoned by term of imprisonment (1996-2010)