5 Degree of satisfaction with family life
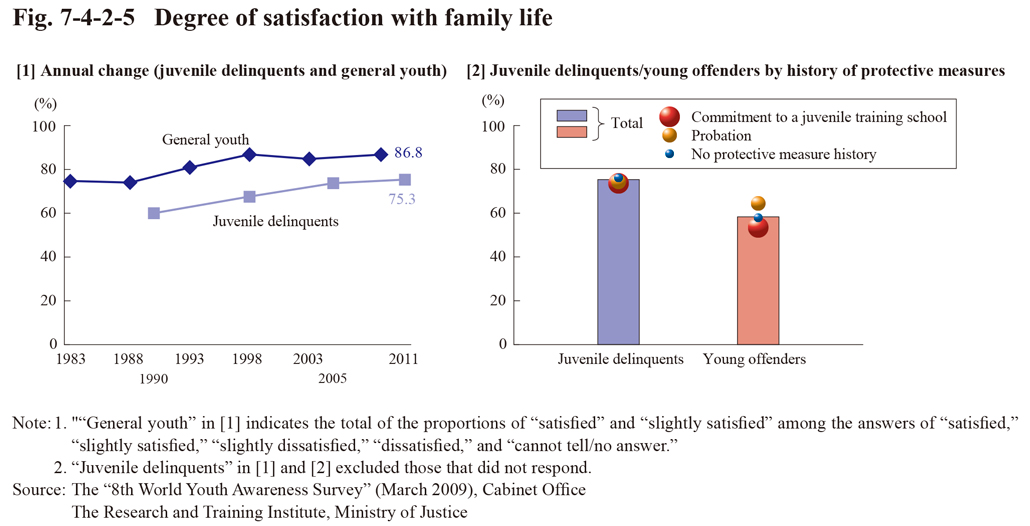
Fig. 7-4-2-5 shows the annual changes in degree of satisfaction with relationships with family life (of juvenile delinquents and general youth) of juvenile delinquents/young offenders by history of protective measures.
Examining annual changes revealed that the percentage of those that were satisfied with their family life was on a rising trend with both general youth (86.8% in 2009) and juvenile delinquents (75.3% in this survey), but that with juvenile delinquents it was more than 10 points lower than that with general youth. No significant difference was observed between juvenile delinquents with and without a history of protective measures.
With young offenders the percentage of those that were satisfied with their family life was 58.3%, which was more than 15 points lower than that with all juvenile delinquents.
Examining the major reasons of those that were “dissatisfied” with their family life revealed that many answered “low family income” (47.0% with juvenile delinquents and 59.0% with young offenders), “there are family quarrels” (32.5% and 50.8% (id.)), “my parents do not understand me” (42.2% and 49.2% (id.)), and “not enough affection from parents” (27.7% and 45.9% (id.)), thus indicating that the major causes of their dissatisfaction were financial dissatisfaction, conflict between family members, and unfulfilled desire for parents’ affection.
Fig. 7-4-2-5 Degree of satisfaction with family life