5 Educational/employment status
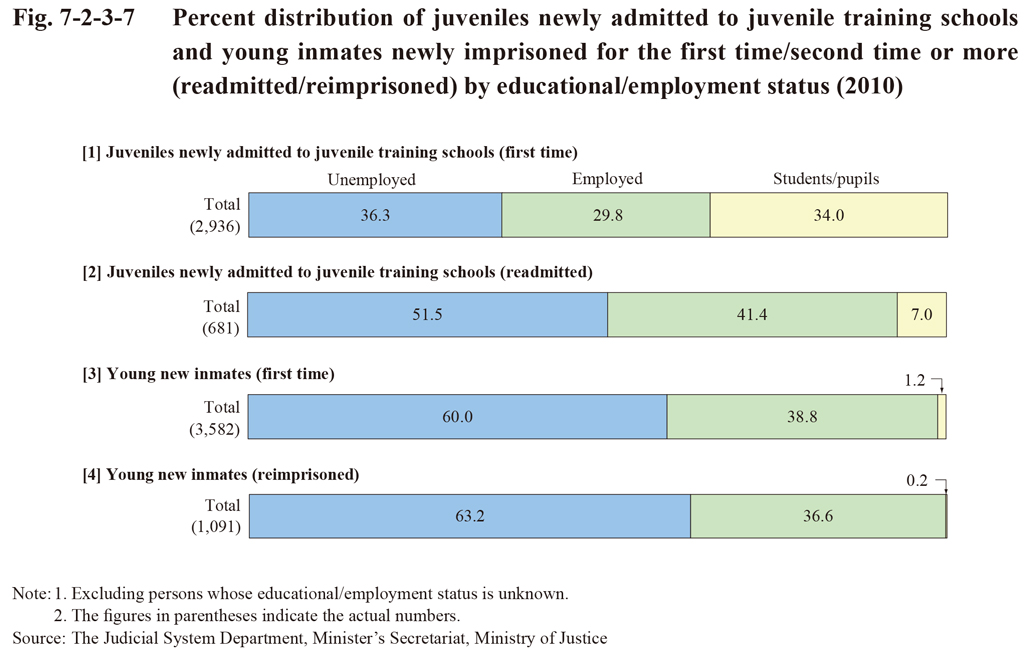
Fig. 7-2-3-7 shows the percent distribution of juveniles newly admitted to juvenile training schools and young inmates newly imprisoned for the first time/second time or more in 2010 by their educational/employment status at the time of the delinquency/offense.
The proportion of those unemployed was approximately 1/3 with juveniles newly admitted to juvenile training schools for the first time but over 50% with those readmitted (the difference in the proportion of students/pupils is considered to be affected by the fact that many of those readmitted were senior juveniles) whereas the proportion was over 60% with both young new inmates imprisoned for the first time and those reimprisoned.
Fig. 7-2-3-7 Percent distribution of juveniles newly admitted to juvenile training schools and young inmates newly imprisoned for the first time/second time or more (readmitted/reimprisoned) by educational/employment status (2010)