2 Non-traffic penal code offenses excluding theft
Fig. 1-1-2-4 shows the number of reported cases, number of cleared cases, and the clearance rate for non-traffic penal code offenses excluding theft over the last 30 years.
The number of reported cases increased rapidly from 2000, reaching a post WWII high level of 581,463 cases in 2004, but then continued to decrease from 2005. In 2010 it was 372,747 (down 31,328 or 7.8% from the previous year).
The number of cleared cases/persons remained stable from 2003, but then decreased for four consecutive years from 2007. In 2010 the number of cleared cases was 169,903 (down 13,152 or 7.2% from the previous year) and the number of cleared persons 147,742 (down 9,640 or 6.1% (id.)) (See also Fig. 1-1-1-1).
The clearance rate used to be at around 90%, but then sharply declined from 2000. It reached a post WWII low level of 37.8% in 2004, but then started to rise again from 2005. In 2010 it was 45.6% (up 0.3 points from the previous year).
Fig. 1-1-2-4 Number of reported/cleared cases and clearance rate for non-traffic penal code offenses excluding theft (1981-2010)
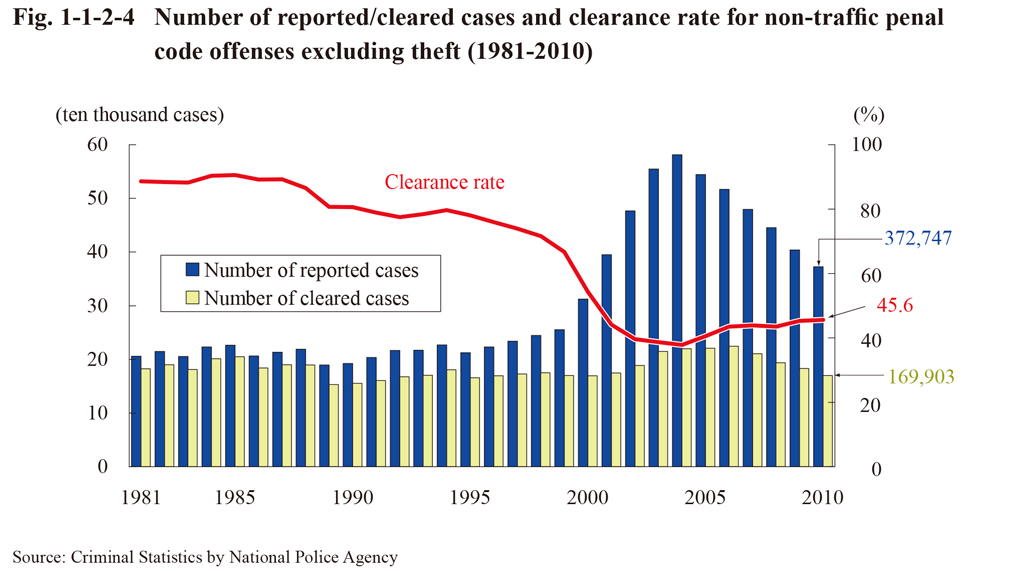
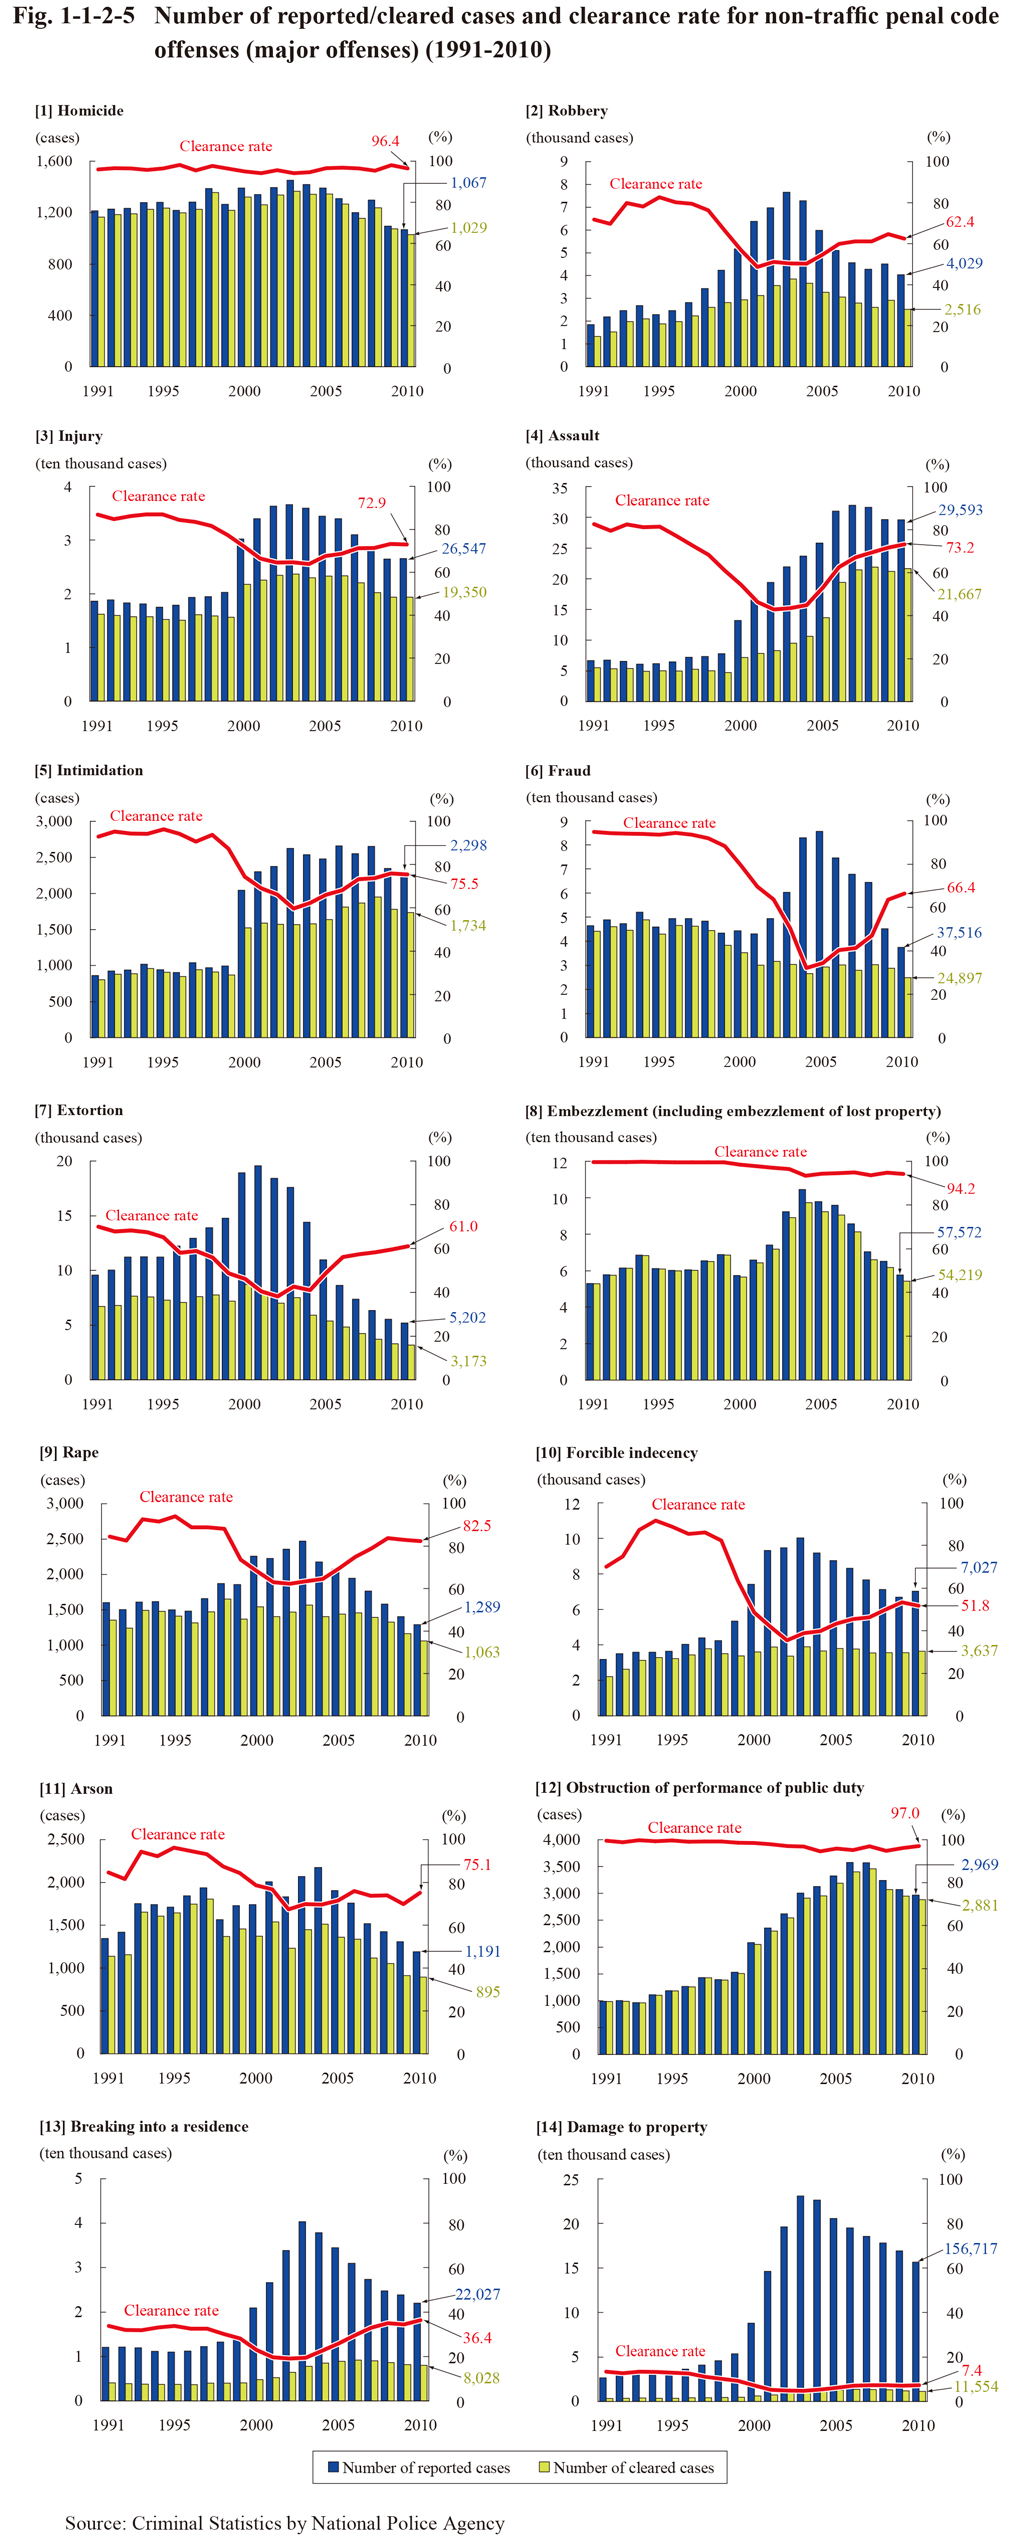
Fig. 1-1-2-5 shows the number of reported cases, number of cleared cases, and clearance rate for major offenses over the last 20 years (See Appendices 1-2 and 1-3). See the Appendices for acceptance of stolen property, etc., public indecency, distribution of obscene objects, etc., kidnapping/buying or selling of human beings, counterfeit of currency, counterfeit of documents, etc., and gambling and lotteries, etc.
Fig. 1-1-2-5 Number of reported/cleared cases and clearance rate for non-traffic penal code offenses (major offenses) (1991-2010)
(1) Homicide (See Fig. 1-1-2-5 [1])
Although the number of reported cases for homicide generally remained stable, it was slightly decreasing from 2004. It was 1,067 in 2010 (down 27 or 2.5% from the previous year). The clearance rate remained stable at a high level (96.4% in 2010).
The number of reported cases for random homicide (refers to cases where a random person was killed for no particular reason at a free space for the public, using weapons, etc.; including attempted homicide) was four in 2006, eight in 2007, 14 in 2008, four in 2009, and five in 2010. All the suspects were cleared in those cases (Source: The Criminal Investigation Bureau, National Police Agency).
(2) Robbery (See Fig. 1-1-2-5 [2])
The number of reported cases for robbery reached 7,664 in 2003, a record high level since 1950, but then continued to decrease from 2004, and was 4,029 in 2010 (down 483 or 10.7% from the previous year). The clearance rate continued to rise from 2005 through to 2009, but slightly declined to 62.4% in 2010 (down 2.3 points (id.)).
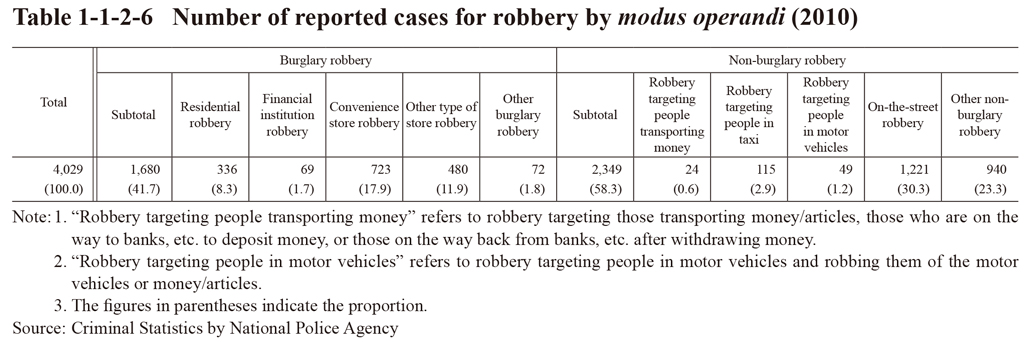
Table 1-1-2-6 shows the number of reported cases for robbery by modus operandi in 2010.
Table 1-1-2-6 Number of reported cases for robbery by modus operandi (2010)
(3) Injury/assault/intimidation (See Fig. 1-1-2-5 [3]-[5])
The number of reported cases for injury, assault, and intimidation all sharply increased in 2000. The number of reported cases for injury subsequently continued to increase to reach the highest level since 1975 in 2003, but was on a decreasing trend from 2004, and was 26,547 in 2010 (up 83 or 0.3% from the previous year). The number of reported cases for assault continued to increase until 2007, but then slightly decreased from 2008, and was 29,593 in 2010 (down 45 or 0.2% (id.)). The number of reported cases for intimidation was generally on an increasing trend up to 2008, but then turned to a decreasing trend from 2009, and was 2,298 in 2010 (down 50 or 2.1% (id.)). The clearance rates for these offenses all significantly declined due to a sharp increase in number of reported cases, but then turned to a rising trend in around 2004.
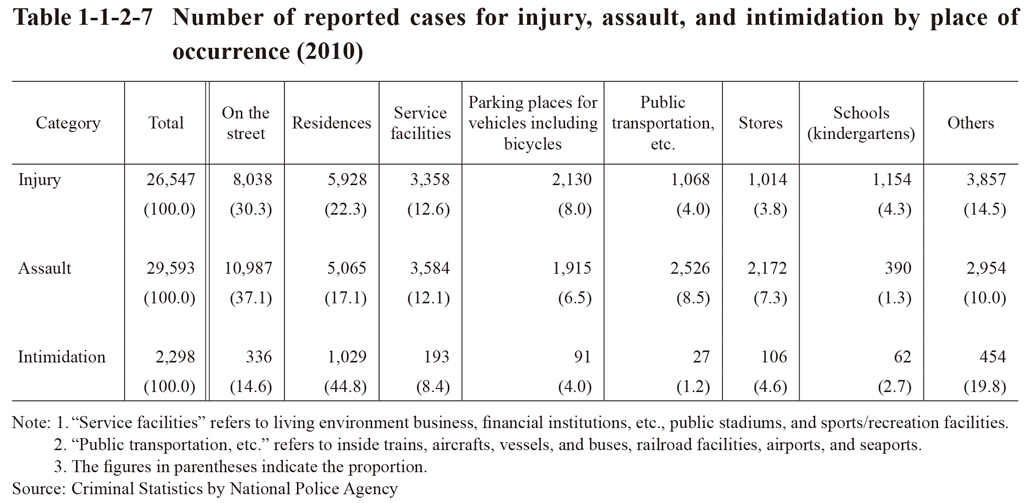
Table 1-1-2-7 shows the number of reported cases for injury, assault, and intimidation by place of occurrence in 2010.
Table 1-1-2-7 Number of reported cases for injury, assault, and intimidation by place of occurrence (2010)
(4) Fraud (See Fig. 1-1-2-5 [6])
The number of reported cases for fraud increased significantly from 2002, reaching a record high level since 1960 of 85,596 cases in 2005. It then turned to a decreasing trend from 2006, and was 37,516 in 2010 (down 7,646 or 16.9% from the previous year). The clearance rate continued to drastically decline from 1997, reaching a post WWII low level of 32.1% in 2004, but then turned to a rising trend in 2005, and was 66.4% in 2010 (up 2.7 points (id.)).
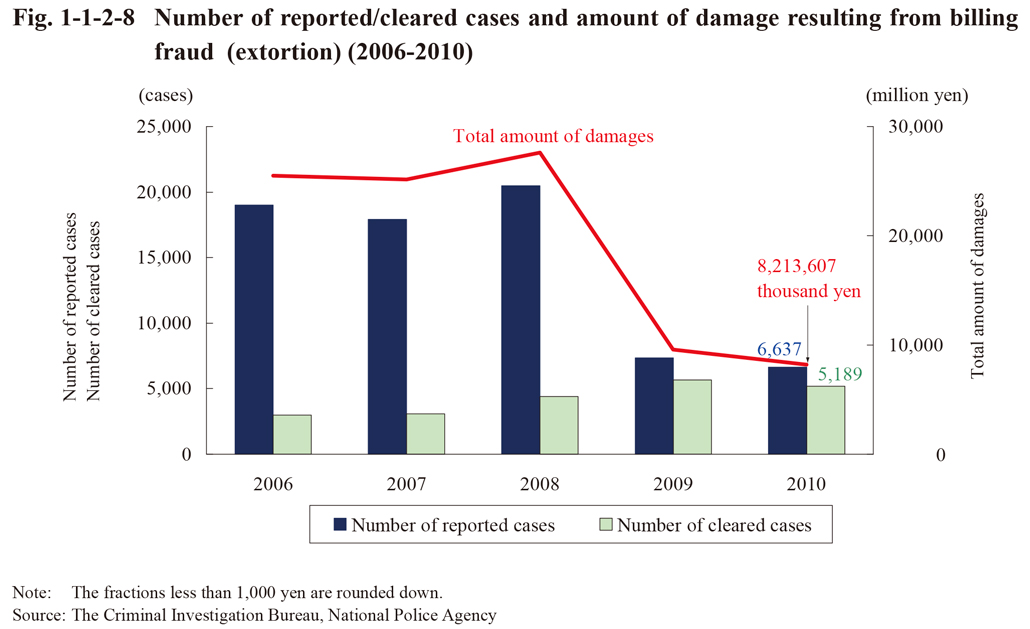
One of the major factors in the recent sharp increase in number of reported cases for fraud is the frequent occurrence of billing fraud. Fig. 1-1-2-8 shows the number of reported/cleared cases and amount of damage resulting from billing fraud (extortion) over the last five years. In 2009, however, the number of reported cases and amount of damage both significantly decreased (down 64.2% and 65.3%, respectively, from the previous year) whereas the number of cleared cases increased (up 28.8% (id.)), with the clearance rate therefore significantly rising. In 2010 the number of reported cases and amount of damages both decreased, as it did the previous year, by 9.6% and 14.3%, respectively, whereas the clearance rate slightly increased (up 0.9 points (id.)). Various measures, including the “Action Plan to Wipe out Billing Fraud” that was published in July 2008, etc., are considered to have had a positive effect on the trends observed from 2009, and thus will need to be implemented in the future too.
Fig. 1-1-2-8 Number of reported/cleared cases and amount of damage resulting from billing fraud (extortion) (2006-2010)
(5) Rape/forcible indecency (See Fig. 1-1-2-5 [9][10])
The number of reported cases for rape was on an increasing trend from 1997, reaching 2,472 cases in 2003, but then started to decrease from 2004, and was 1,289 in 2010 (down 113 or 8.1% from the previous year). The clearance rate consistently declined from 1998, reaching a post WWII low level of 62.3% in 2002, but then rose from 2003 through to 2008, and was 82.5% in 2010 (down 0.5 points (id.)).
The number of reported cases for forcible indecency sharply increased from 1999, reaching a post WWII high level of 10,029 cases in 2003, but then continued to decrease from 2004 through to 2009, and was 7,027 in 2010 (up 339 or 5.1% from the previous year). The clearance rate sharply declined from 1999, reaching a post WWII low level of 35.5% in 2002, but then started to rise from 2003 through to 2009, and was 51.8% in 2010 (down 1.5 points (id.)).
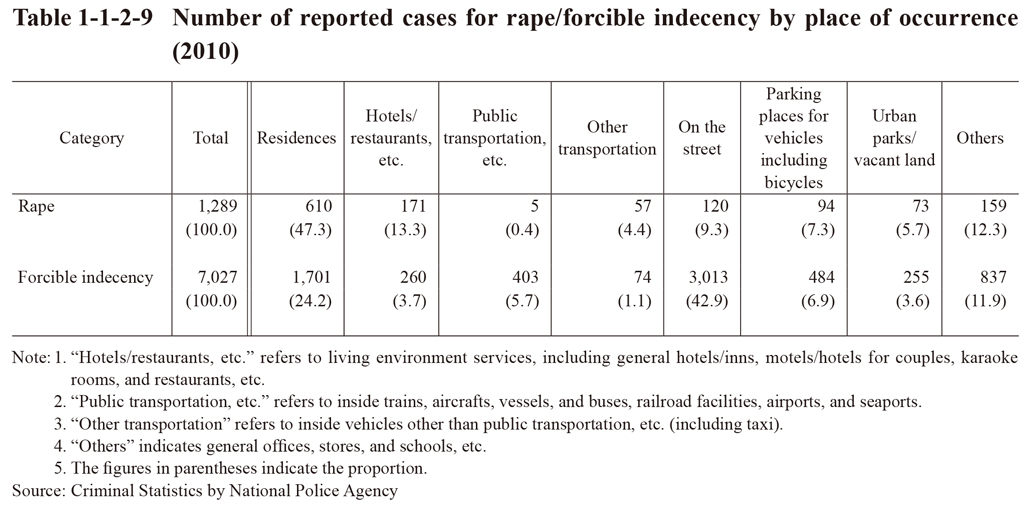
Table 1-1-2-9 shows the number of reported cases for rape/forcible indecency by place of occurrence in 2010.
Table 1-1-2-9 Number of reported cases for rape/forcible indecency by place of occurrence (2010)
(6) Obstruction of performance of public duty (See Fig. 1-1-2-5 [12])
The number of reported cases for obstruction of performance of public duty naturally remained at basically the same level as the number of cleared cases. It was on a significant increasing trend from 1994, reaching a post WWII high level of 3,576 cases in 2006, but then started decreasing from 2007. However, it remained at a high level and was 2,969 in 2010 (down 102 or 3.3% from the previous year).
(7) Damage to property (See Fig. 1-1-2-5 [14])
The number of reported cases for damage to property significantly increased from 2000, reaching 230,743 cases in 2003. It then, however, continued decreasing from 2004, although it did remain at a high level, and was 156,717 in 2010 (down 12,575 or 7.4% from the previous year). The clearance rate was generally on a declining trend until 2003, it then turned to a slightly rising trend from 2004, and was 7.4% in 2010. It remained low when compared to total non-traffic penal code offenses.
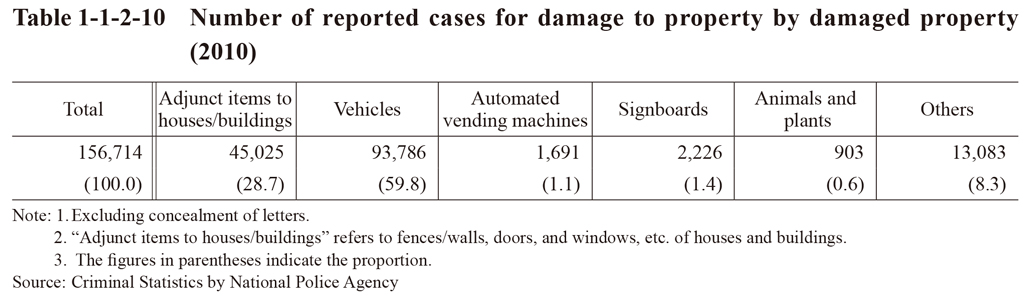
Table 1-1-2-10 shows the number of reported cases for damage to property by damaged property in 2010.
Table 1-1-2-10 Number of reported cases for damage to property by damaged property (2010)
(8) Acceptance of bribe, etc.
Table 1-1-2-11 shows the number of persons newly received and conclusively disposed in public prosecutors offices for acceptance of bribe in 2010.
Table 1-1-2-11 Number of persons newly received and conclusively disposed in public prosecutors offices for acceptance of bribe (2010)
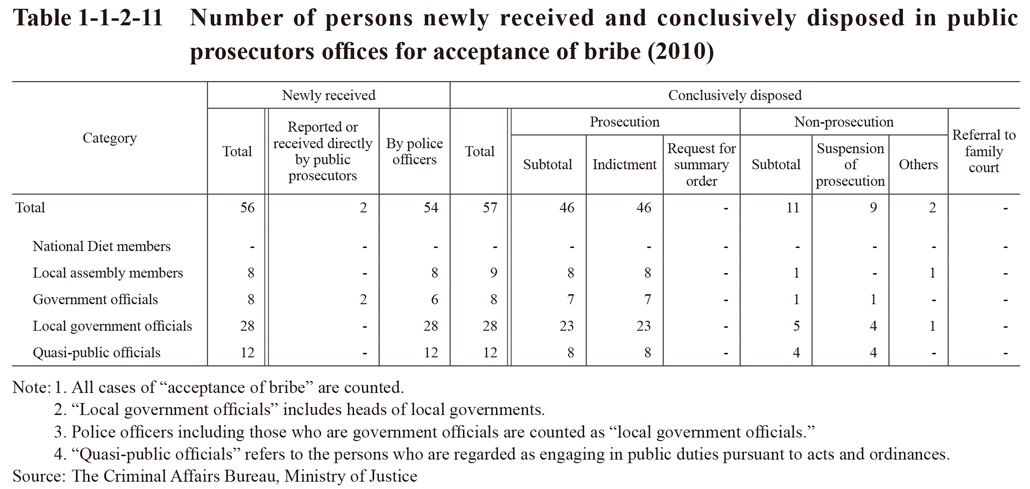
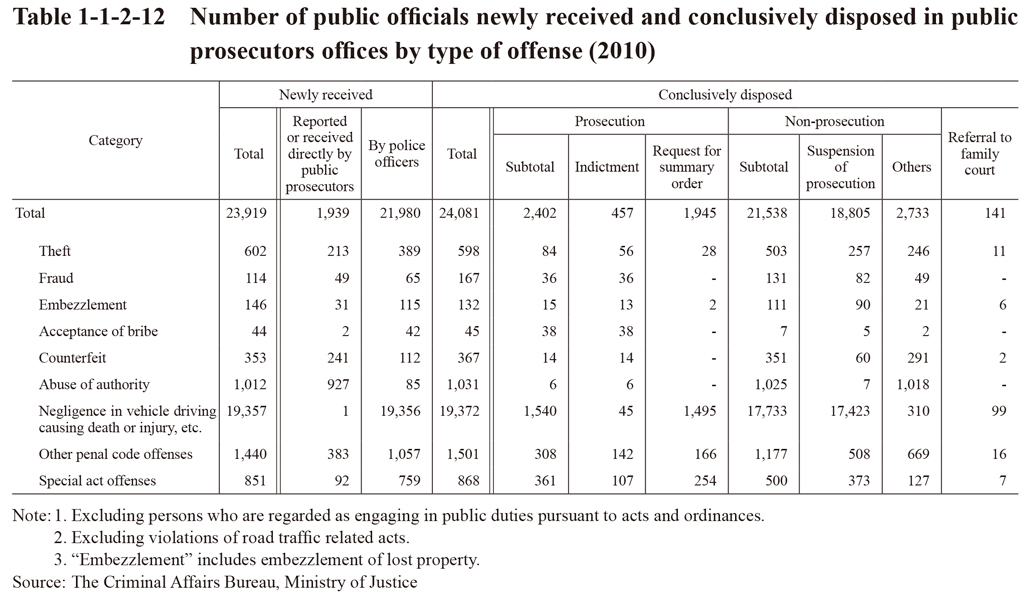
Table 1-1-2-12 shows the number of public officers newly received and conclusively disposed in public prosecutors offices by type of offense in 2010. By type of offense, the number of persons newly received for negligence in vehicle driving causing death or injury, etc. accounted for 80.9%.
Table 1-1-2-12 Number of public officials newly received and conclusively disposed in public prosecutors offices by type of offense (2010)
(9) Organized crime
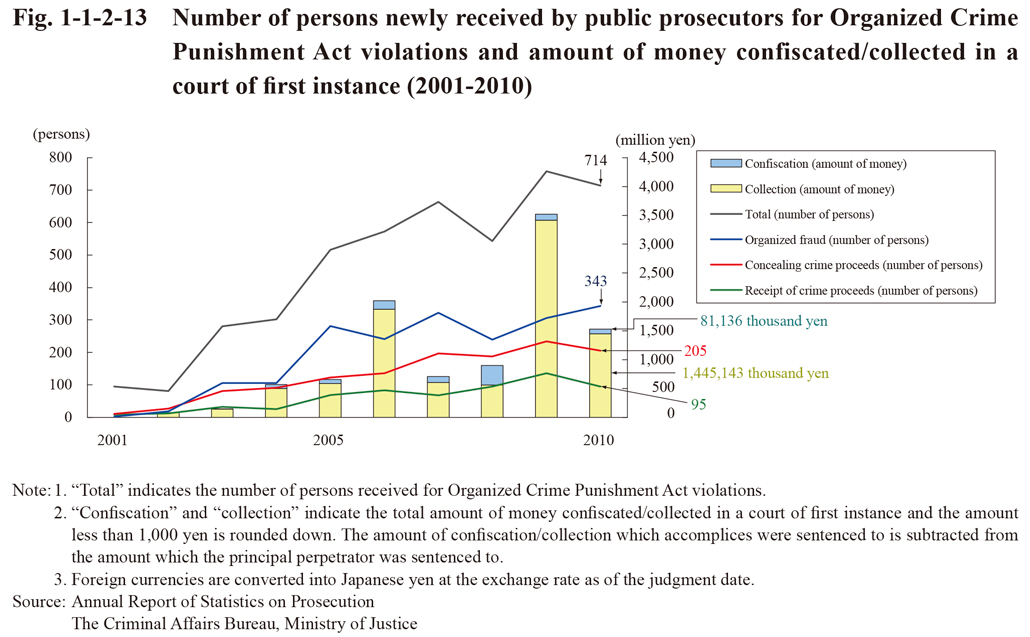
Fig. 1-1-2-13 shows the number of persons newly received by public prosecutors for Organized Crime Punishment Act violations and the amount of money confiscated/collected in a court of first instance over the last 10 years. The number of persons newly received was on an increasing trend from the enforcement of the said Act in 2000, but decreased by 44 from the previous year to 714 in 2010. The amount of money confiscated/collected remained within the range of 0.5 to 2 billion yen from 2004, and then exceeded 3.5 billion yen in 2009, but decreased by 56.6% from the previous year to approximately 1,526.28 million yen in 2010.
Fig. 1-1-2-13 Number of persons newly received by public prosecutors for Organized Crime Punishment Act violations and amount of money confiscated/collected in a court of first instance (2001-2010)