2 Type of delinquency/offense
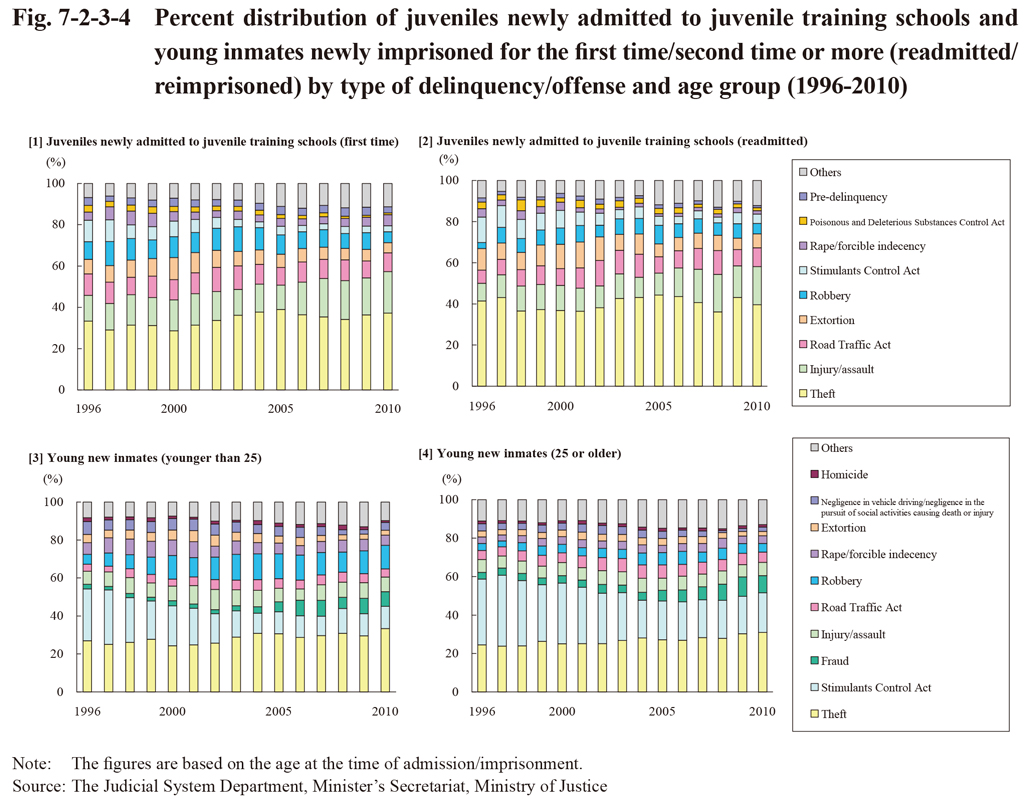
Fig. 7-2-3-4 shows the percent distribution of juveniles newly admitted to juvenile training schools and young inmates newly imprisoned for the first time/second time or more by type of delinquency/offense and age group since 1996.
Examining the percent distribution by type of delinquency of juveniles newly admitted to juvenile training schools in 2010 revealed that theft accounted for the highest proportion, followed by injury/assault, and then Road Traffic Act violations. Examining the percent distribution since 1996 revealed that the proportion of Stimulants Control Act violations was declining while that of injury/assault generally rising. However, no significant difference was observed in the percent distribution by type of delinquency of juveniles newly admitted to juvenile training schools between those admitted for the first time and those readmitted.
Examining the percent distribution by type of offense of young new inmates in 2010 revealed that theft accounted for the highest proportion with both those younger than 25 and those aged 25 or older. It was then followed by robbery, Stimulants Control Act violations, and injury/assault and fraud (same number) with those younger than 25, and by Stimulants Control Act violations, fraud, and injury/assault with those aged 25 or older. Examining the percent distribution since 1996 revealed that the proportion of Stimulants Control Act violations was declining (more remarkable with those younger than 25) while that of fraud rising.
Although theft accounted for the highest proportion with both juveniles newly admitted to juvenile training schools and young new inmates, the proportion was lower with young new inmates younger than 25 than with juveniles newly admitted to juvenile training schools and lower with young new inmates aged 25 or older than with young new inmates younger than 25. That trend was reversed with Stimulants Control Act violations and fraud, with the proportion of these offenses being higher with young new inmates younger than 25 and even higher with young new inmates aged 25 or older, thus indicating the diversity of offenses with those at higher age.
Fig. 7-2-3-4 Percent distribution of juveniles newly admitted to juvenile training schools and young inmates newly imprisoned for the first time/second time or more (readmitted/reimprisoned) by type of delinquency/offense and age group (1996-2010)