Section 2 Prosecution/Trial
1 Reception and disposition in public prosecutors offices
Fig. 7-2-2-1 shows the number and rate per population of juvenile offenders newly received by public prosecutors for major offenses since 1989.
The number and rate per population of juvenile offenders newly received by public prosecutors for all offenses were generally decreasing/declining from 1999 (See [1] of the Fig.). With violations of road traffic related acts that accounted for the largest number, the number and rate per population were generally on a decreasing/declining trend from 1991 ([8] of the Fig.). With non-traffic penal code offenses, the number of juvenile offenders was large for theft but was generally on a decreasing trend from 1999, while the amount of the decline in the rate per population for theft was not significantly large (See [4] of the Fig.). The number and rate per population for robbery and injury/assault all continued to increase/rise until reaching a peak in 2003 for robbery and 2000 for injury/assault, but were subsequently on a decreasing/declining trend (See [2] and [3] of the Fig.; See also Fig. 7-2-1-1-9 [2] and [3], which show similar trends with these offenses). The number and rate per population for breaking into a residence and fraud all significantly increased/rose over the last 10 years, with the rate per population in 2010 being 44.6 (21.8 in 2001) for breaking into a residence and 15.2 (6.1 in 2001) for fraud (See Fig. 7-2-2-1 [5] and [6]; See also Fig. 7-2-1-1-9 [5], which shows similar trends with fraud).
Fig. 7-2-2-1 Number and rate per population of juvenile offenders newly received by public prosecutors by type of offense (1989-2010)
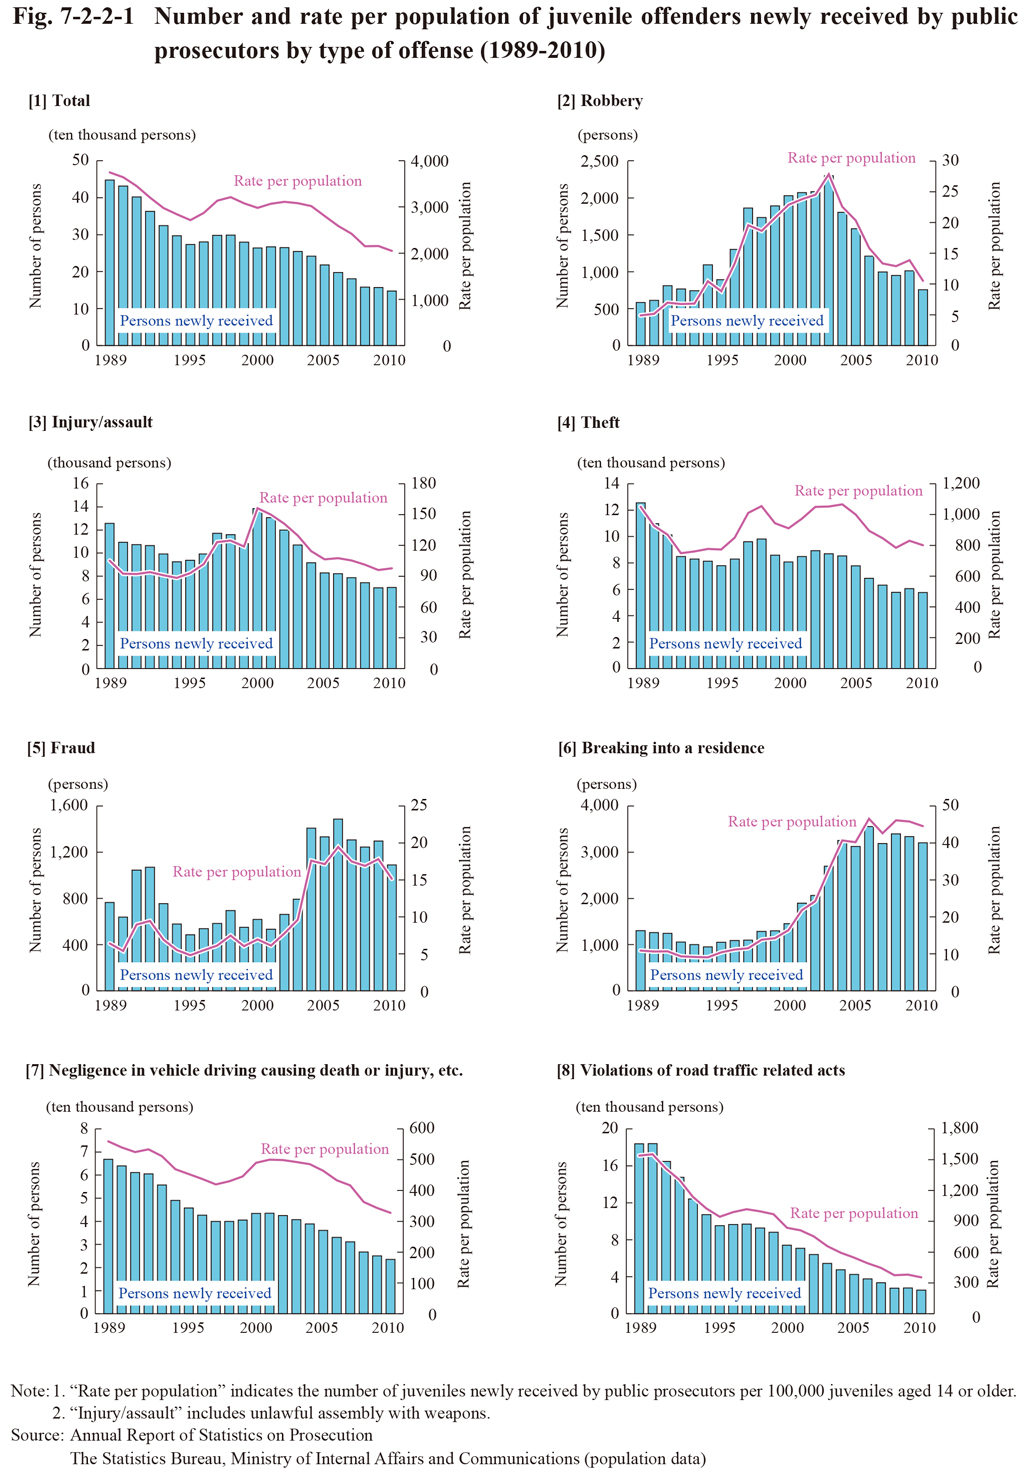
Table 7-2-2-2 shows the number of persons disposed by public prosecutors for non-traffic penal code offenses and special act offenses excluding violations of road traffic related acts by type of offense and age group in 2010.
Examining the percent distribution by type of offense of the respective age groups revealed that theft accounted for over 60% of those aged 17 or younger but lower than 50% of those aged 18-19. The proportion was lower with those aged 20-24, and even lower again with those aged 25-29. In addition, with young people aged 20-29 the proportion of injury/assault (10.2%), fraud (5.6%), Stimulants Control Act violations (5.3%), and Cannabis Control Act violations (2.5%) was significantly higher than those younger than 20 (the proportions were higher of those aged 25-29 than those aged 20-24), thus indicating greater diversity and dispersive trends with offenses of the higher age group.
Table 7-2-2-2 Number of persons disposed by public prosecutors by type of offense and age group (2010)
