3 Correction
Fig. 4-3-3-3 shows the number of new inmates for Stimulants Control Act violations over the last 20 years. The number in 2010 was basically at the same level as that of 1991, although with females it increased in 2010 to approximately 1.7 times that of 1991.
Fig. 4-3-3-3 Number of new inmates for Stimulants Control Act violations (1991-2010)
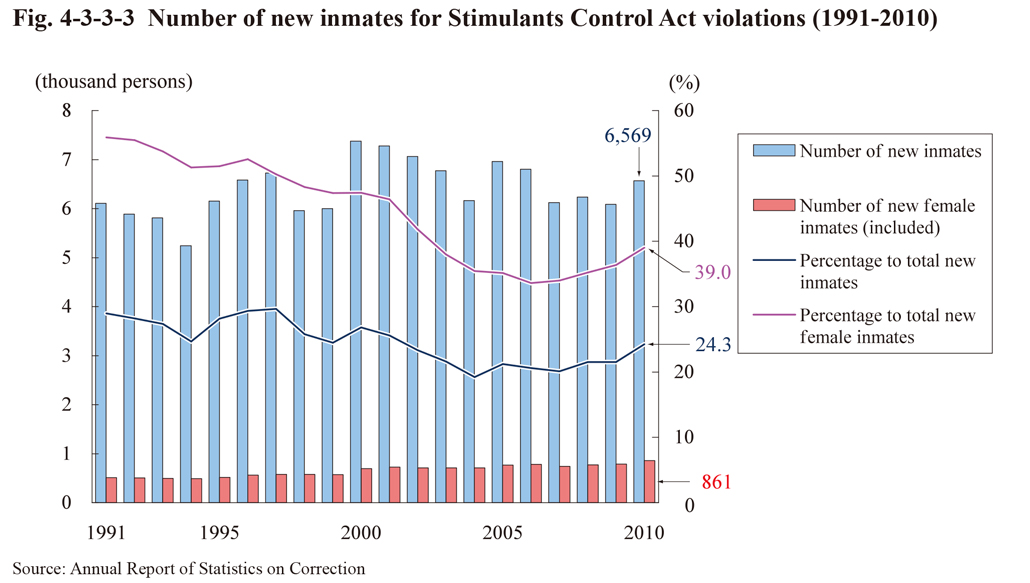
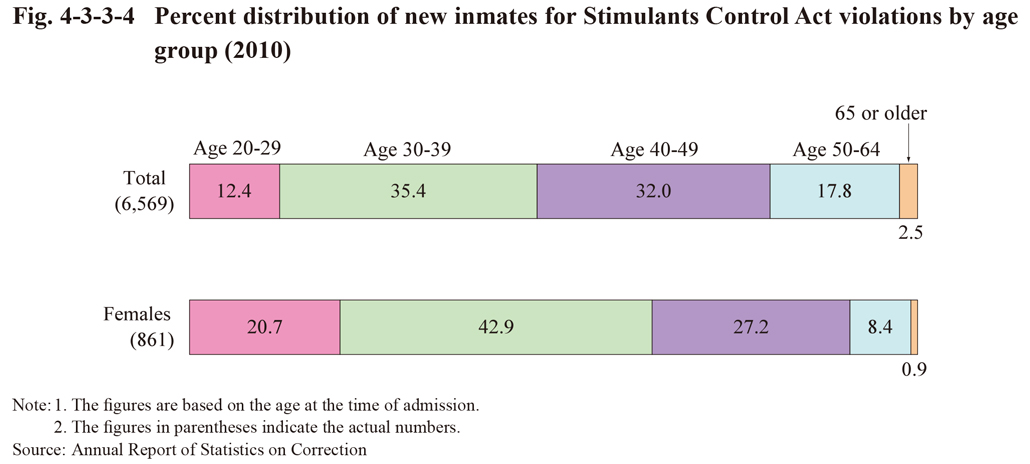
Fig. 4-3-3-4 shows the percent distribution of new inmates for Stimulants Control Act violations by age group in 2010. Those aged 30-49 accounted for approximately 70%, with the proportion of females younger than 40 being higher than that of males.
Fig. 4-3-3-4 Percent distribution of new inmates for Stimulants Control Act violations by age group (2010)