Section 3 Correction
1 Juveniles newly admitted to juvenile training schools and new inmates in penal institutions
Fig. 7-2-3-1 shows the number and rate per population of juveniles newly admitted to juvenile training schools and inmates newly imprisoned for the first time/second time or more in 2010 by age.
The number of juveniles newly admitted to juvenile training schools remained at the level of around 700 with those respectively aged 16 to 19. The number of juveniles readmitted was higher as the age of the juveniles rose, with the percentage of those readmitted to total juveniles newly admitted to juvenile training schools being 2.6% with junior juveniles, 15.4% with intermediate juveniles, and 30.6% with senior juveniles.
By age of new inmates, the number of new inmates increased as the age of the inmates rose, peaking at around age 40. The increasing trend in the number of new inmates associated with the rise in age was particularly remarkable with young new inmates (refers to inmates younger than 30 years old at the time of imprisonment; hereinafter the same), and the number reached a high level by age 30, even compared to the peak age. When limited to first time new inmates (those imprisoned in a penal institution for the first time) the number reached a peak at age 26 and then decreased as the age rose (the percentage of first time young new inmates to total first time new inmates was 30.2%). In contrast to this, the proportion of new inmates reimprisoned (those imprisoned in a penal institution for the second time or more) rose as their age rose and with those aged around 25 or older the proportion was rather high. This indicates that quite a few of those imprisoned in penal institutions at a young age are subsequently reimprisoned.
The number of young new inmates in 2010 was 4,673, accounting for 17.3% of total new inmates (27,079) (See Fig. 2-4-1-3 for the number and rate per population of all new inmates).
Fig. 7-2-3-1 Number of juveniles newly admitted to juvenile training schools and inmates newly imprisoned for the first time/second time or more (readmitted/reimprisoned) by age group (2010)
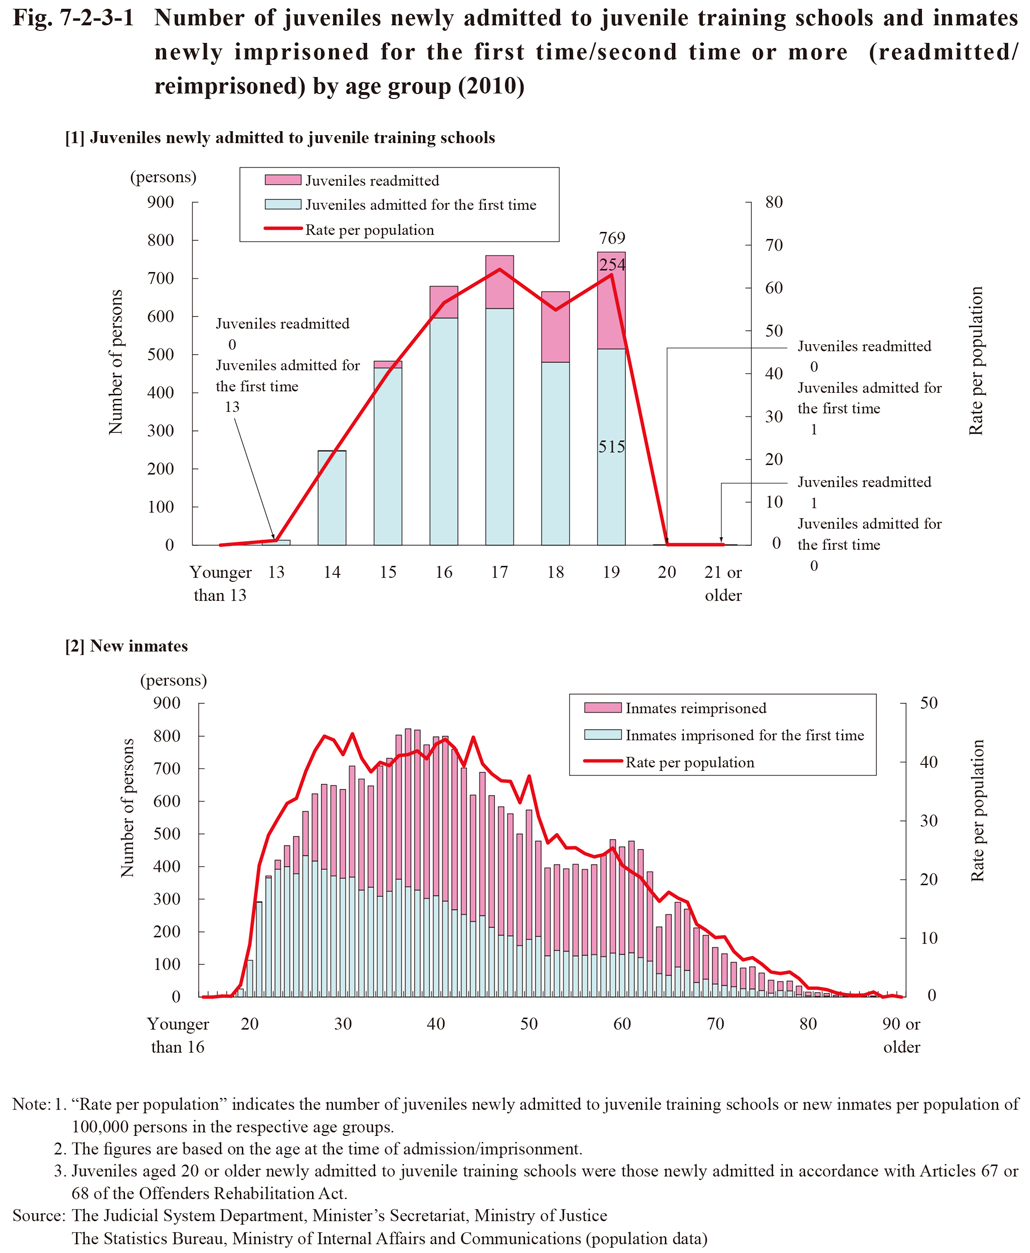
Fig. 7-2-3-2 shows the number of juveniles newly admitted to juvenile training schools and young inmates newly imprisoned for the first/second time or more and the rate of readmitted juveniles/reimprisoned young inmates to all new admitted juveniles/imprisoned inmates respectively since 1996.
The number of juveniles newly admitted to juvenile training schools and young new inmates were both on increasing trends from 1996, but the number of juveniles newly admitted to juvenile training schools then reached a peak of 6,052 in 2000 and that of young new inmates a peak of 7,097 in 2003, before turning to a decreasing trend. In 2010 the number of juveniles newly admitted to juvenile training schools was 3,619 (2,938 admitted for the first time and 681 readmitted) and that of young new inmates 4,673 (3,582 imprisoned for the first time and 1,091 reimprisoned).
The rate of readmitted juveniles of juveniles newly admitted to juvenile training schools was on a rising trend from 1999, but continued to decline after reaching the peak of 19.6% in 2005, and then increased in 2010 to 18.8%. The rate of reimprisoned inmates of young new inmates was on a declining trend until 2003, then remained stable until 2006, but continued rising from 2007 to reach 23.3% in 2010. However, the rate of reimprisoned inmates of young new inmates was remarkably low when compared with that of total new inmates (56.2%) (See Fig. 4-6-3-1 for the total new inmates)
Fig. 7-2-3-2 Number of juveniles newly admitted to juvenile training schools and young inmates newly imprisoned for the first time/second time or more (readmitted/reimprisoned) and rate of readmitted juveniles/reimprisoned inmates (1996-2010)
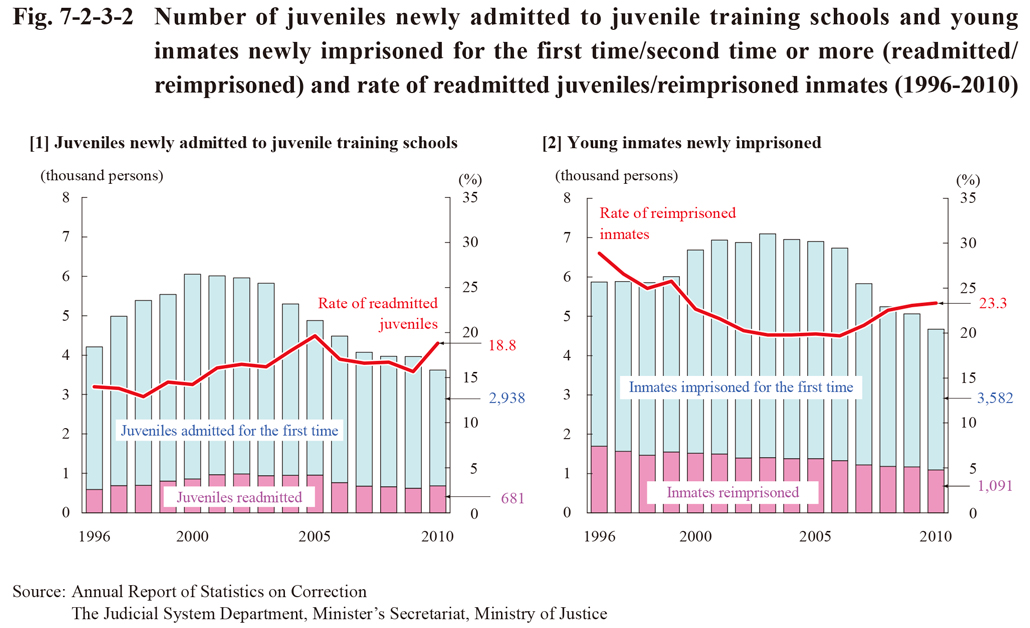
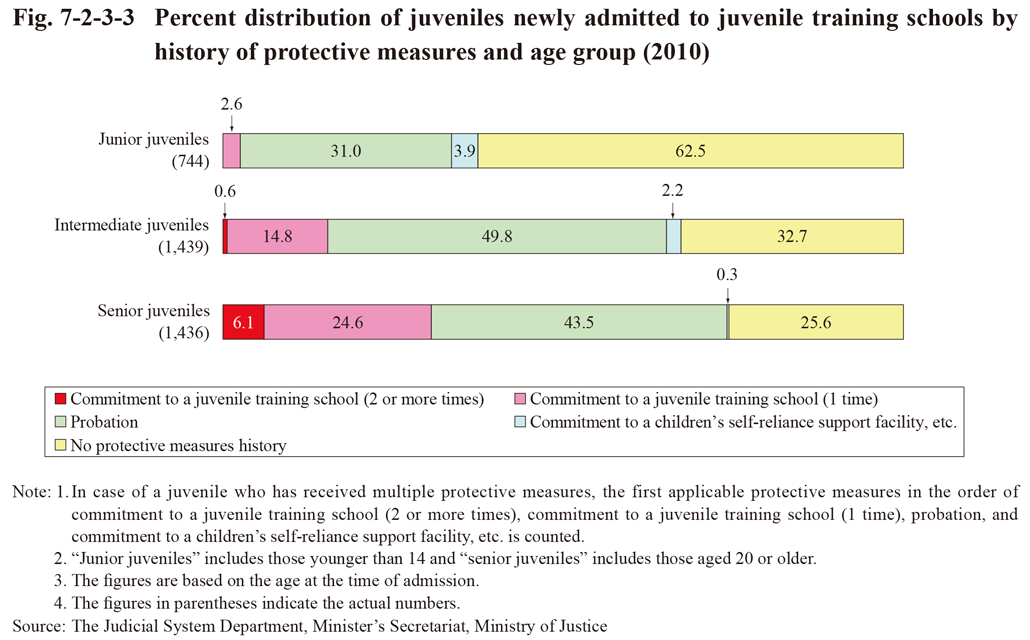
Fig. 7-2-3-3 shows the percent distribution of junior/intermediate/senior juveniles newly admitted to juvenile training schools in 2010 by the history of protective measures. The proportion of those with a history of protective measures, particularly that with a history of commitment to a juvenile training school, was the highest among senior juveniles, followed by intermediate juveniles, and then junior juveniles. Of those with a history of commitment to a juvenile training school, the percentage of those with two or more such histories was high among senior juveniles.
Fig. 7-2-3-3 Percent distribution of juveniles newly admitted to juvenile training schools by history of protective measures and age group (2010)