9 Degree of satisfaction with society
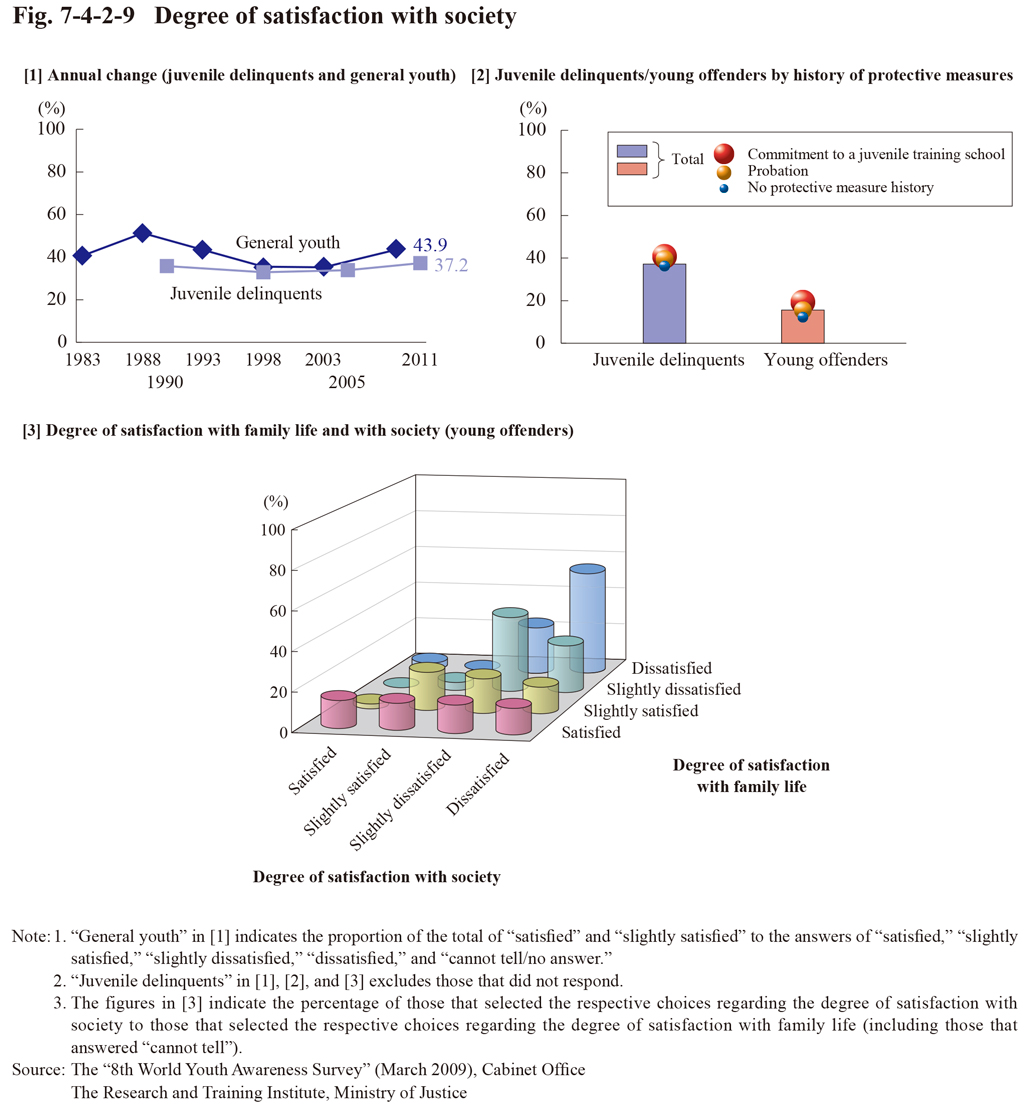
Fig. 7-4-2-9 [1] and [2] show the annual changes in degree of satisfaction with present society (of juvenile delinquents and general youth) of juvenile delinquents/young offenders by history of protective measures.
Examining the annual changes revealed that the percentage of those that gave affirmative answers concerning the degree of satisfaction with society remained slightly lower with juvenile delinquents (37.2% in this survey) than with general juveniles (43.9% in 2009). No significant difference was observed between juvenile delinquents with and without a history of protective measures.
In contrast to this, with young offenders the percentage of those that gave affirmative answers concerning the degree of satisfaction with society was 15.6%, which was lower than half of that with juvenile delinquents, and the percentage of those that answered that they were dissatisfied with present society 38.1% (21.8% with juvenile delinquents).
The major reasons for those that were dissatisfied with present society were “a large disparity between the rich and the poor” (66.2% with juvenile delinquents and 73.2% with young offenders), “what I think is right is not accepted” (50.3% and 48.6% (id.)), and “the way of thinking and behavior of people are not in order” (46.5% and 45.8% (id.)), etc., thus indicating that a relatively large number of them were dissatisfied with the society for income disparities and disorder in social justice/ethics.
Fig. 7-4-2-9 [3] shows the answers concerning the degree of satisfaction with society by the answers concerning the degree of satisfaction with family life of young offenders. The relationships between the two types of degree of satisfaction revealed that those that were dissatisfied with their family life also were dissatisfied with society (similar trends were observed with juvenile delinquents).
Fig. 7-4-2-9 Degree of satisfaction with society