Section 1 Trends in Offenses
Fig. 4-4-1-1 shows the number of persons cleared for non-traffic penal code offenses by age group over the last 20 years. Unlike the other age groups the number of elderly persons cleared was increasing significantly over recent years, with the number in 2010 being approximately 6.8 times that of 1991.
Fig. 4-4-1-1 Number of persons cleared for non-traffic penal code offenses by age group (1991-2010)
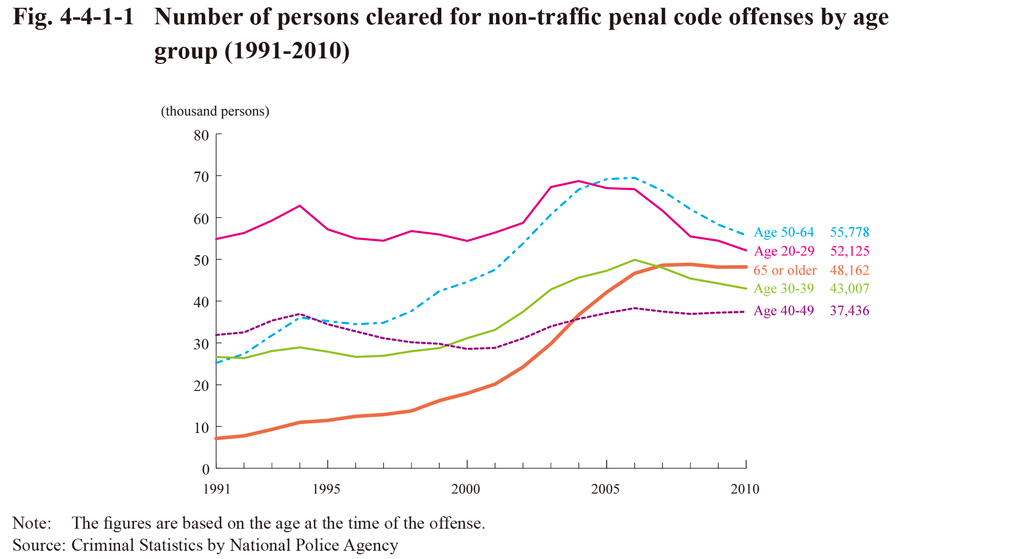
Fig. 4-4-1-2 shows the rate per population of persons cleared for non-traffic penal code offenses by age group over the last 20 years. The rate per population of elderly persons cleared was relatively low when compared to other age groups, but examining the rate of increase in the rate per population by age group revealed that the rate per population rose in 2010 from 1991 by approximately 1.2 times with the 20-29 age group, approximately 1.5 times with the 30-39 age group, approximately 1.4 times with the 40-49 age group, and approximately 2.0 times with the 50-64 age group, whereas it rose by as much as approximately 3.6 times with elderly persons, thereby indicating the remarkable increase in the rate per population of elderly persons. As indicated above the increase of elderly offenders in recent years far exceeded that of the total elderly population.
Fig. 4-4-1-2 Rate per population of persons cleared for non-traffic penal code offenses by age group (1991-2010)
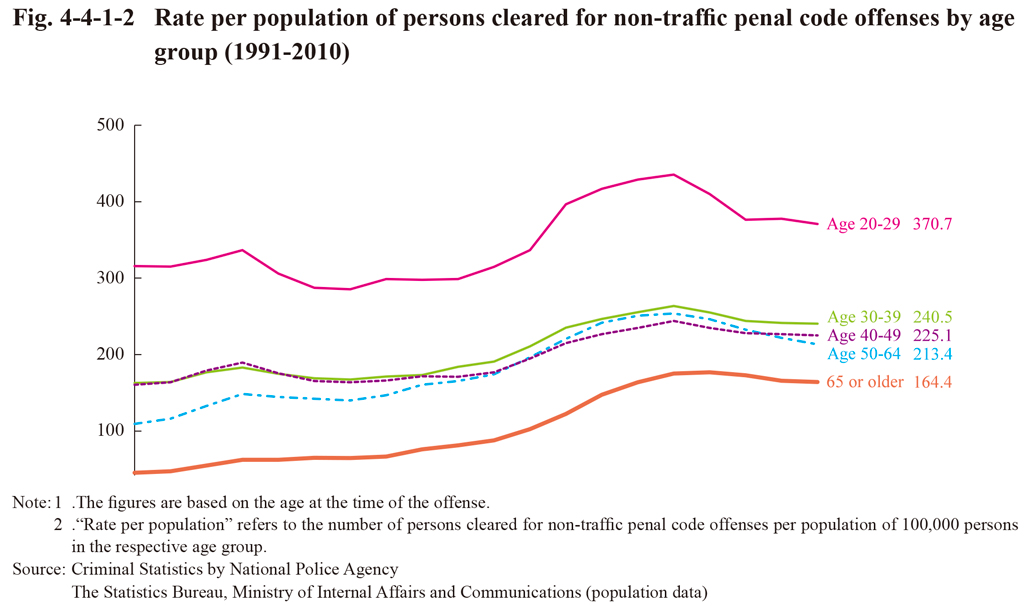
Fig. 4-4-1-3 shows the percent distribution of elderly persons cleared for non-traffic penal code offenses by gender and type of offense in 2010. When compared to all the non-traffic penal code offenses, theft was of the highest proportion with respect to elderly persons, especially among females at 91.4%, and with shoplifting being remarkably high at 81.2%.
Fig. 4-4-1-3 Percent distribution of elderly offenders cleared for non-traffic penal code offenses by gender and type of offense (2010)
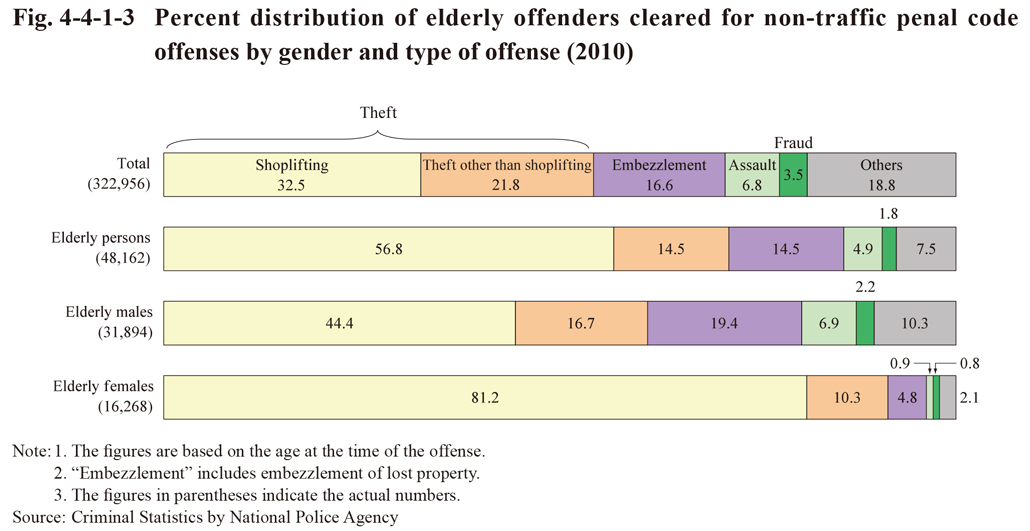
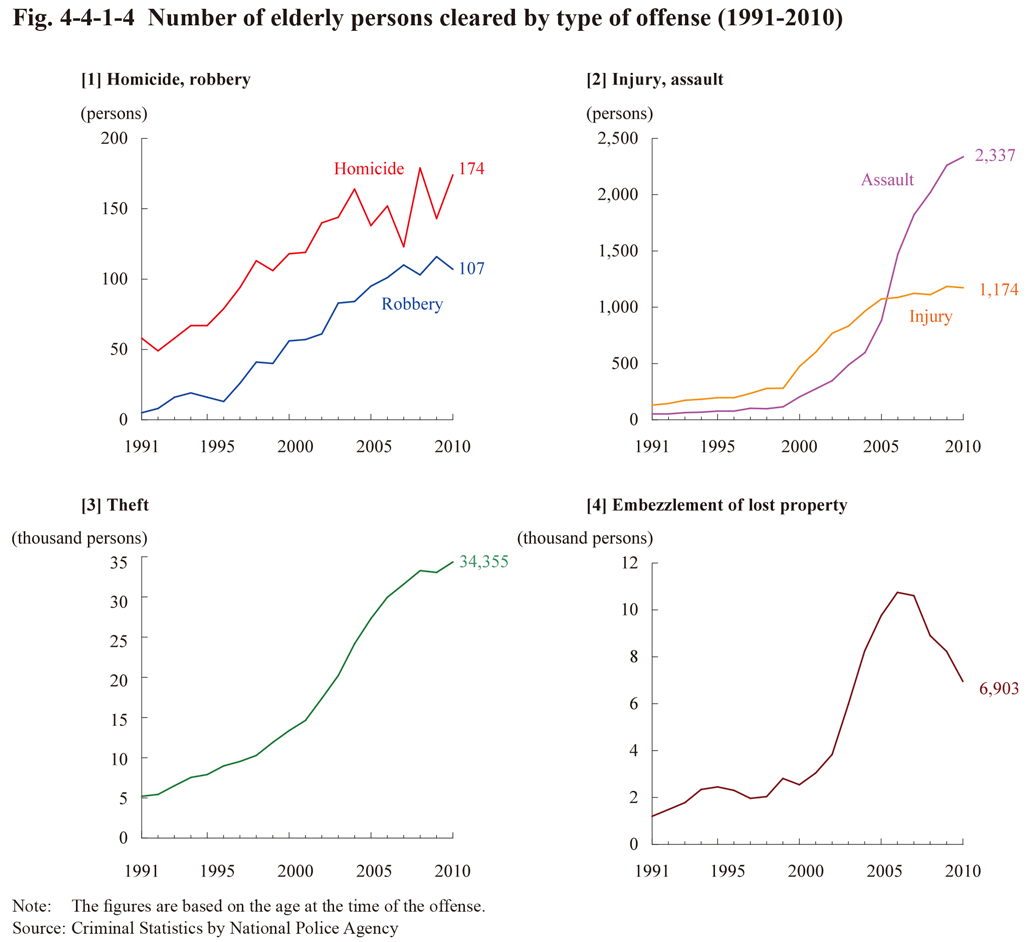
Fig. 4-4-1-4 shows the number of elderly persons cleared for specific penal code offenses over the last 20 years. The number of elderly persons cleared was increasing over the last 20 years for theft and embezzlement of lost property, and accounted for the majority of elderly persons cleared for non-traffic penal code offenses. In addition, the number was also increasing for serious and violent offenses.
Fig. 4-4-1-4 Number of elderly persons cleared by type of offense (1991-2010)