2 Occupancy rate of penal institutions
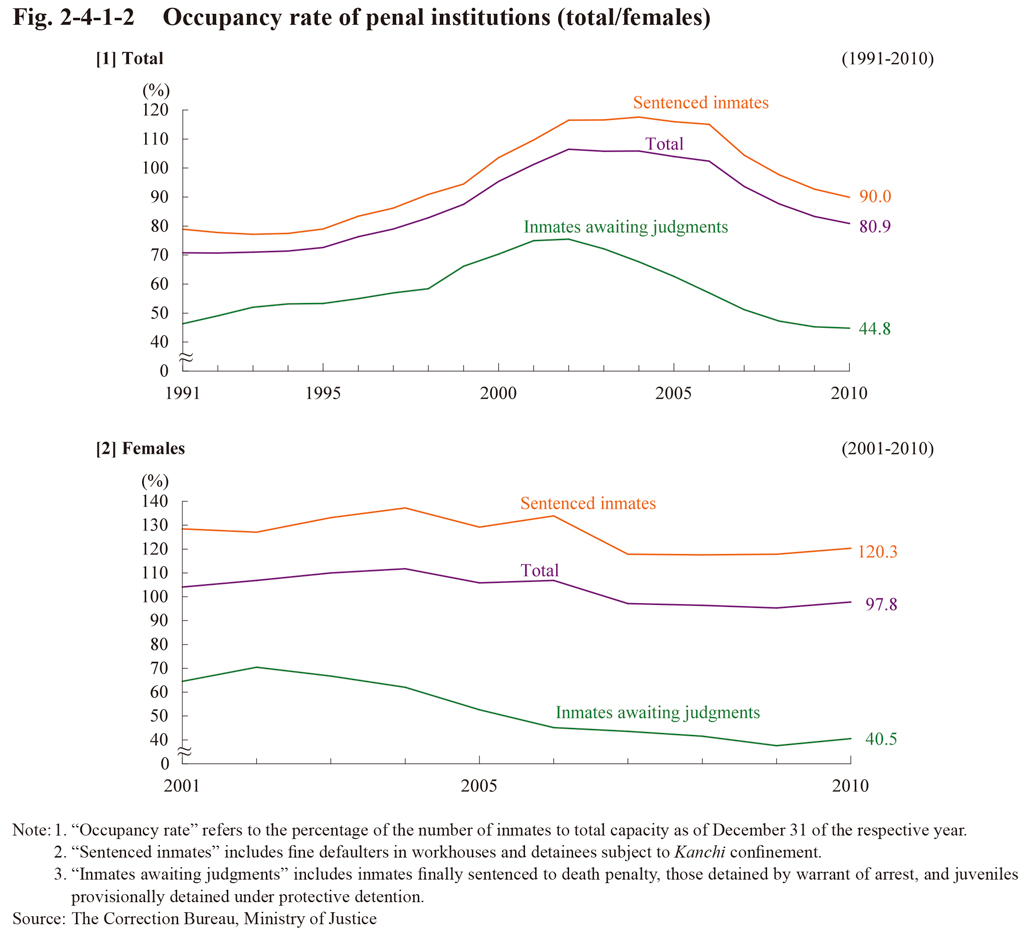
Fig. 2-4-1-2 shows the occupancy rate of penal institutions (percentage of inmates to total capacity as of the end of the year) over the last 20 years. The occupancy rate rose significantly from 1993 through to 2002, but then continued declining every year from 2005. As of the end of 2010 the total capacity was 90,182 persons (of which the capacity for sentenced inmates was 72,129) and the occupancy rate 80.9% (90.0% for sentenced inmates and 44.8% for inmates awaiting judgments), with a total of 13 (16.9%) of 77 main penal institutions accommodating more inmates than their total capacity (Source: The Correction Bureau, Ministry of Justice). With females the occupancy rate generally remained at the same level from 2007. As of the end of 2010 the total capacity for females was 5,464 (of which the capacity for sentenced inmates was 3,921) and the occupancy rate 97.8% (120.3% for sentenced inmates and 40.5% for inmates awaiting judgments). The occupancy rate with sentenced female inmates consistently exceeded the total capacity by approximately 20%.
The inmate burden rate per penal institution official (calculated by dividing the average daily number of inmates at all the penal institutions by the fixed number of officials) significantly rose from being 3.04 in 1998 to 4.48 in 2006, and was still at the high level of 3.88 in 2010. The inmate burden rate at institutions for females (excluding the Mine Rehabilitation Program Center), however, was even higher at 4.86 (Source: The Correction Bureau, Ministry of Justice).
Fig. 2-4-1-2 Occupancy rate of penal institutions (total/females)