1 Reported cases and crime rate
The number of reported cases for penal code offenses reached a new post World War II (WWII) high level every year from 1996, peaking at 3,693,928 in 2002. However, the number then decreased from 2003, and was 2,139,725 in 2011 (down 131,584 or 5.8% from the previous year). The main cause of the recent decrease in the number of reported cases was that the number of reported cases of theft, which typically accounted for more than 50% of all penal code offenses, decreased every year from 2003 (See Subsection 1, Section 2). The number of reported cases for non-traffic penal code offenses excluding theft was increasing until 2004 and then turned to a decreasing trend, but remained at approximately 1.6 times the level of 20 years ago.
The crime rate for penal code offenses basically followed the same trend as the number of reported cases. The crime rate reached a new post WWII high level every year from 1998 (at 2,127.2), peaking at 2,897.5 in 2002. It then started to decline from 2003, and was 1,674.3 in 2011 (down 99.4 points from the previous year) (See Appendix 1-1).
Table 1-1-1-2 shows the number of reported cases for penal code offenses and the crime rate by type of offense in 2011 and Fig. 1-1-1-3 [1] the percent distribution of reported cases by type of offense. Examining the percent distribution of reported cases by type of offense revealed that theft accounted for the highest proportion at 53.0%, followed by negligence in vehicle driving causing death or injury, etc. (30.8%), damage to property (6.9%), embezzlement (including embezzlement of lost property; hereinafter the same in this section) (2.4%), and fraud (1.6%).
Table 1-1-1-2 Number of reported cases, crime rate, number of cleared cases/persons, and clearance rate for penal code offenses by type of offense (2011)
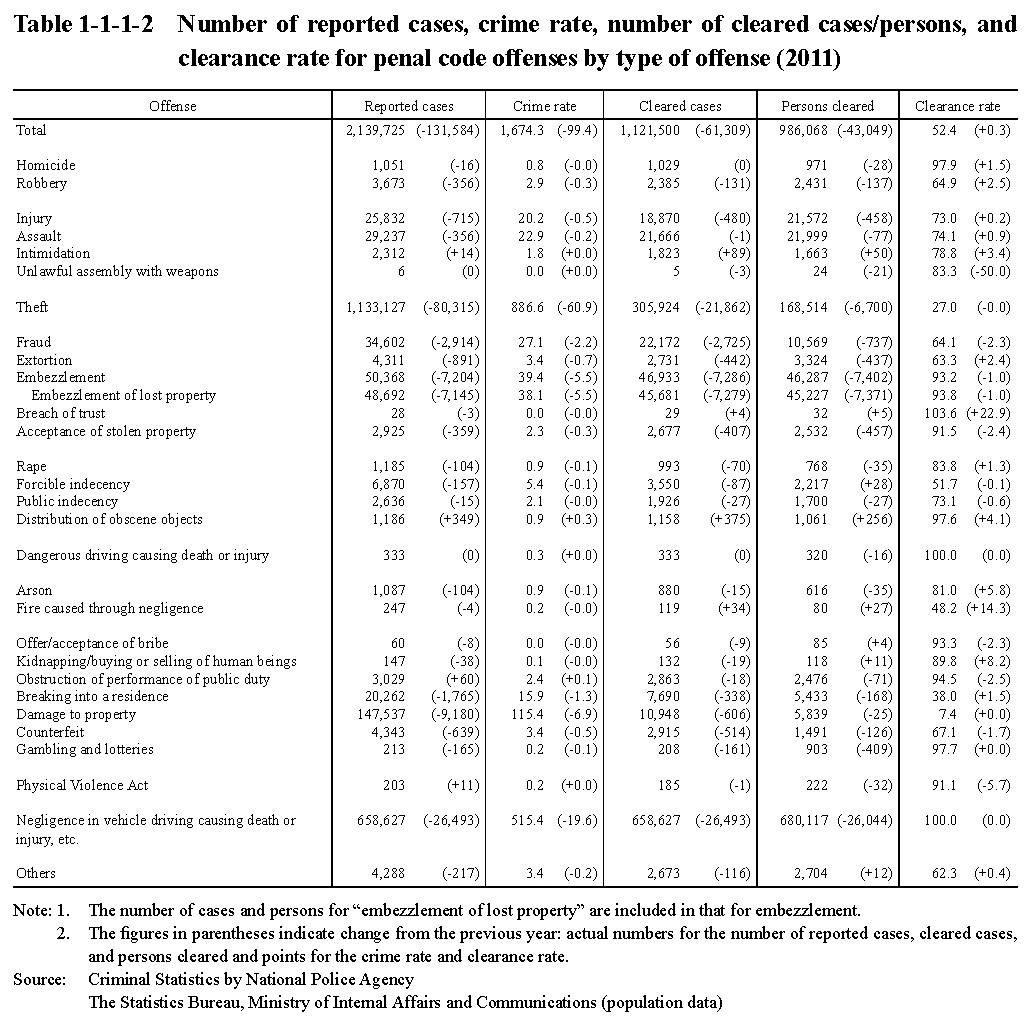
Fig. 1-1-1-3 Percent distribution of reported cases and persons cleared for penal code offenses by type of offense (2011)
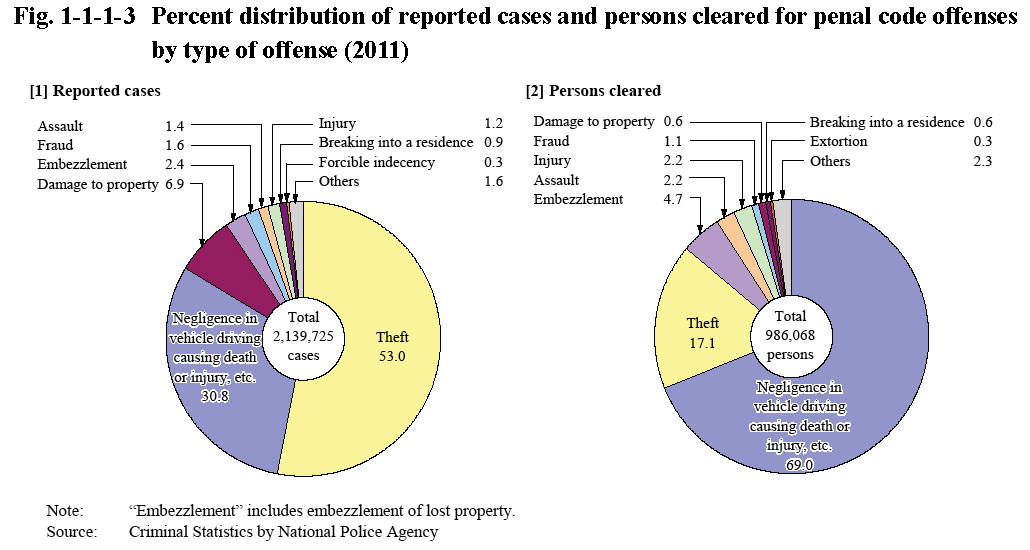
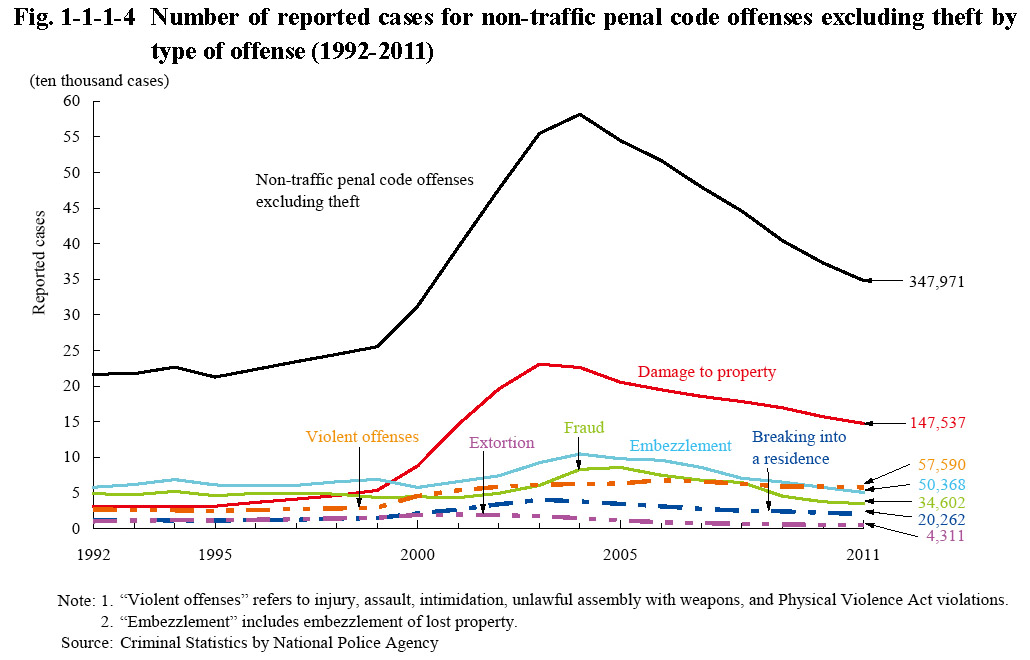
Fig. 1-1-1-4 shows the number of reported cases by type of major offense, etc. for non-traffic penal code offenses excluding theft over the last 20 years. The number of reported cases for non-traffic penal code offenses excluding theft significantly increased from 2000 through to 2004. A significant increase in damage to property is considered to have been the main cause of that increase.
Fig. 1-1-1-4 Number of reported cases for non-traffic penal code offenses excluding theft by type of offense (1992-2011)