Section 2 Non-traffic Penal Code Offenses
1 Theft
Theft accounted for 76.5% of reported cases for non-traffic penal code offenses in 2011. Fig. 1-1-2-1 shows the number of reported cases, number of cleared cases, and clearance rate for theft over the last 30 years. The number of reported cases for theft increased whereas the clearance rate declined from 1995 through to 2001. However, the clearance rate then started to rise again in 2002 while the number of reported cases started to decrease in 2003, thus halting a worsening situation. The number of reported cases turned to a decreasing trend after reaching the post WWII high level of 2,377,488 in 2002 and then subsequently continued to decrease every year from 2003. In 2011 it was 1,133,127, or a decrease of 1,244,361 (52.3%) when compared to 2002. In 2011 the number of cleared cases was 305,924 (down 21,862 or 6.7% from the previous year) and the number of persons cleared 168,514 (down 6,700 or 3.8% (id.)). The clearance rate, however, continued to rise every year from 2002 through to 2009 (27.9%), although it slightly declined to 27.0% in 2011, but which was still 11.3 points higher than the post WWII low level of 2001.
Fig. 1-1-2-1 Number of reported/cleared cases and clearance rate for theft (1982-2011)
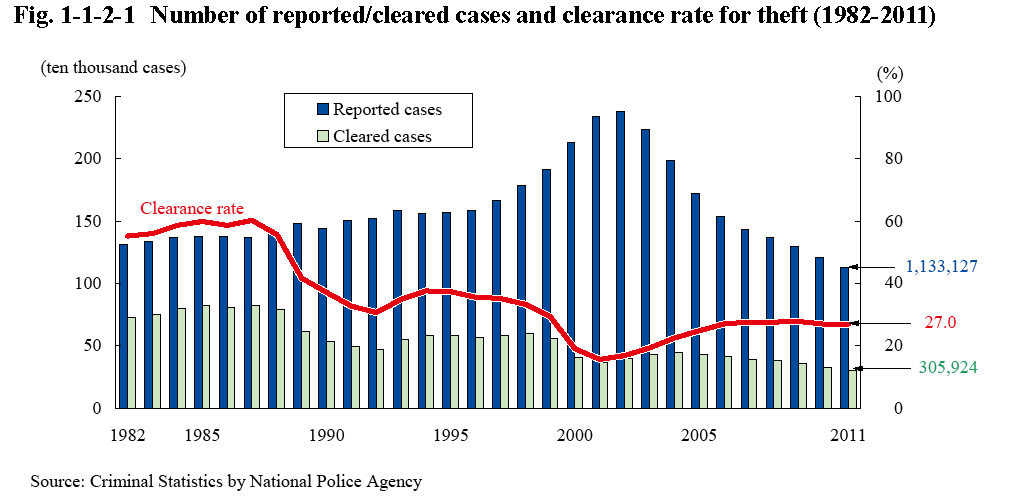
Fig. 1-1-2-2 shows the number of cleared cases per person cleared for theft over the last 30 years. The number exceeded 3.0 basically every year from 1986 through to 1999, but then significantly decreased from 2000, and was below 2.0 from 2010.
Fig. 1-1-2-2 Number of cleared cases per person cleared for theft (1982-2011)
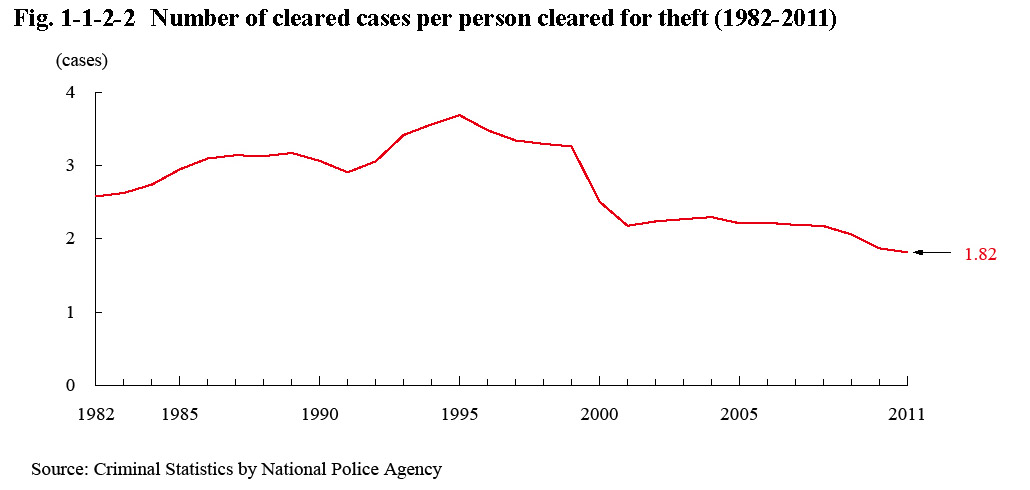
Fig. 1-1-2-3 shows the percent distribution of reported cases for theft by modus operandi in 2011. By type of theft, non-burglary theft accounted for over 50%. By modus operandi, bicycle theft, shoplifting, and vehicle load theft accounted for the highest proportions in that order (See the Appendix for the number of reported cases by modus operandi).
Fig. 1-1-2-3 Percent distribution of reported cases for theft by modus operandi (2011)
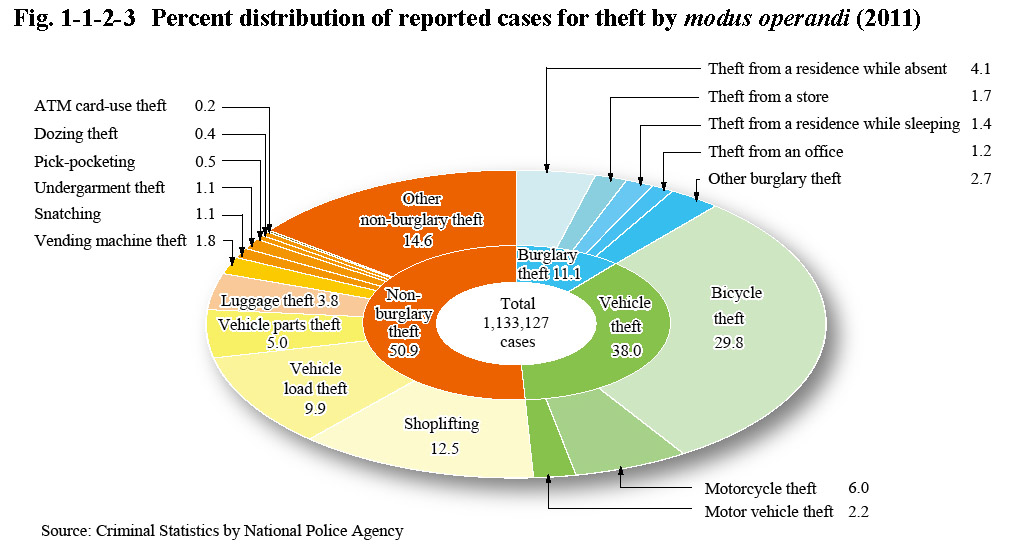
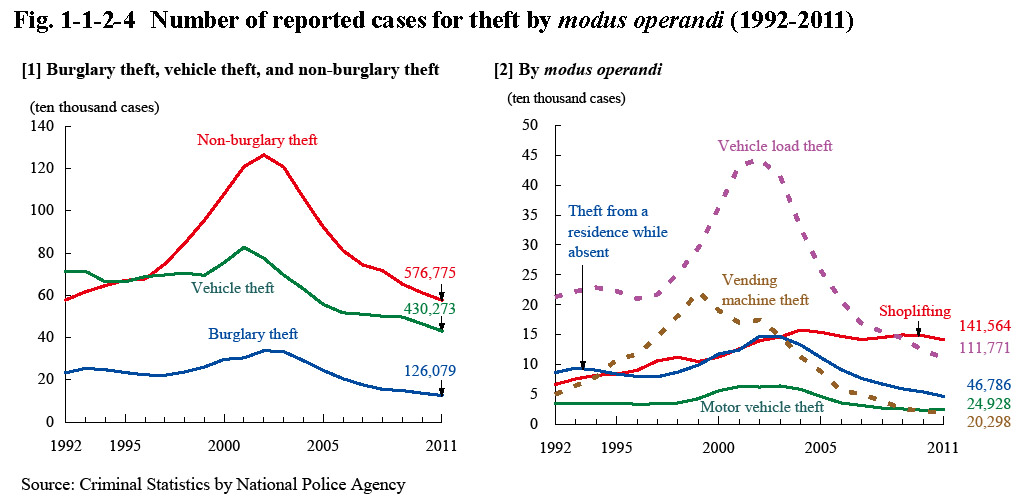
Fig. 1-1-2-4 [1] shows the number of reported cases for burglary theft, vehicle theft, and non-burglary theft over the last 20 years. With all types of theft, the number of reported cases was decreasing after reaching a peak in around 2001-2002. Fig. 1-1-2-4 [2] shows the number of reported cases for some of the modus operandi over the last 20 years. The number of reported cases for vending machine theft and vehicle load theft significantly decreased after reaching peaks in 1999 (approximately 220 thousand cases, accounting for 11.6% of all theft cases) and 2002 (approximately 440 thousand cases, accounting for 18.6% of all theft cases), respectively. That for shoplifting continued to increase until 2004 but then generally remained stable.
Fig. 1-1-2-4 Number of reported cases for theft by modus operandi (1992-2011)