2 Persons cleared
The number of persons cleared for penal code offenses exceeded one million in 1998, subsequently reached a new post WWII high level every year from 1999, and reached 1,289,416 in 2004. It then, however, started to decrease in 2005, and fell below one million at 986,068 in 2011 (down 43,049 or 4.2% from the previous year) (See Fig. 1-1-1-1).
Table 1-1-1-2 shows the number of persons cleared for penal code offenses by type of offense in 2011 and Fig. 1-1-1-3 [2] the percent distribution by type of offense. Negligence in vehicle driving causing death or injury, etc. accounted for 69.0% of the total number of persons cleared.
Fig. 1-1-1-5 shows the percent distribution of persons cleared for non-traffic penal code offenses by age group over the last 30 years (See the Appendix for females). In recent years the age of persons cleared has been getting higher. The proportion of those aged 60 or older was 3.5% (15,363 persons) in 1982, but rose to 22.9% (70,083 persons) in 2011. Elderly persons aged 65 or older accounted for 15.9% (48,637 persons) of persons cleared (See Section 1, Chapter 4, Part 4).
Fig. 1-1-1-5 Percent distribution of persons cleared for non-traffic penal code offenses by age group (1982-2011)
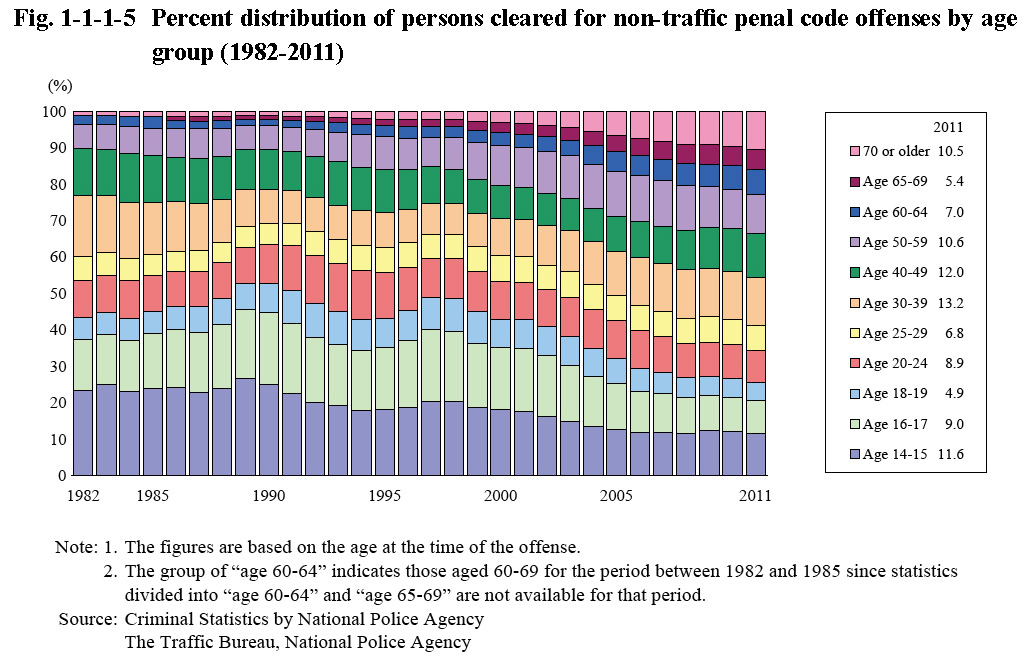
Fig. 1-1-1-6 shows the number of females cleared for non-traffic penal code offenses and rate per population since 1946. The number of females cleared reached peaks in 1950 (within the range of 54 to 55 thousand), 1964 (within the range of 51 to 52 thousand), and 1983 (within the range of 83 to 84 thousand). It then reached another high level after 1983 in 1988, being within the range of 82 to 83 thousand, but then significantly decreased for a while after 1989. However, after decreasing to a minimum in 1992, being within the range of 52 to 53 thousand, it then started to increase again from 1993, reaching the new post WWII high level of 84,175 in 2005. It started to decrease again from 2006, however, and was 65,631 in 2011 (down 3,861 or 5.6% from the previous year).
Fig. 1-1-1-6 Number of females cleared for non-traffic penal code offenses and rate per population (1946-2011)
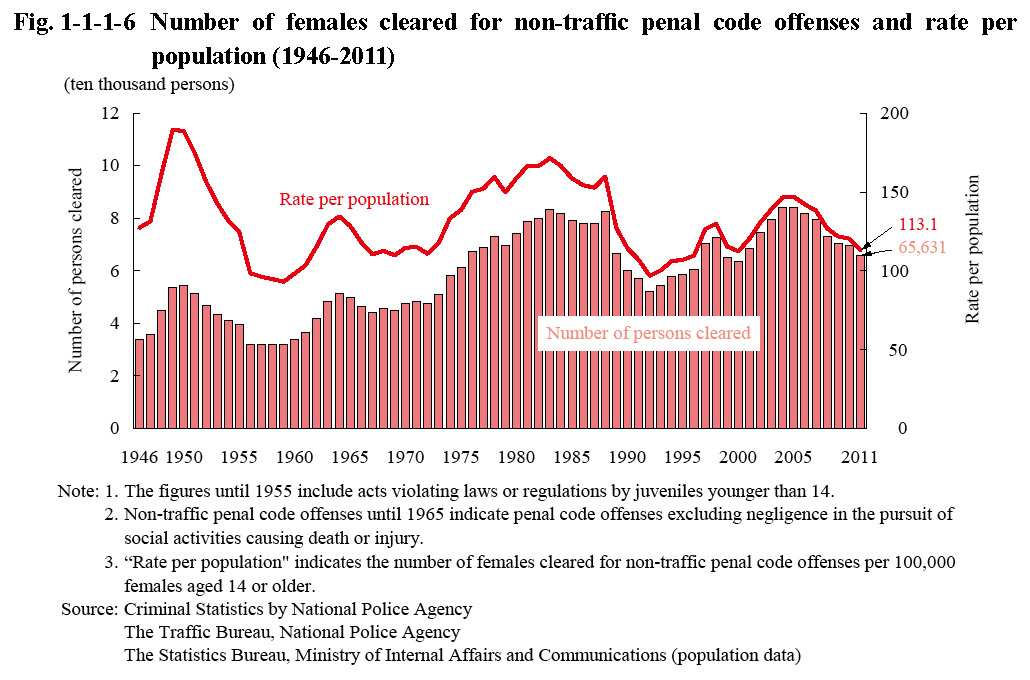
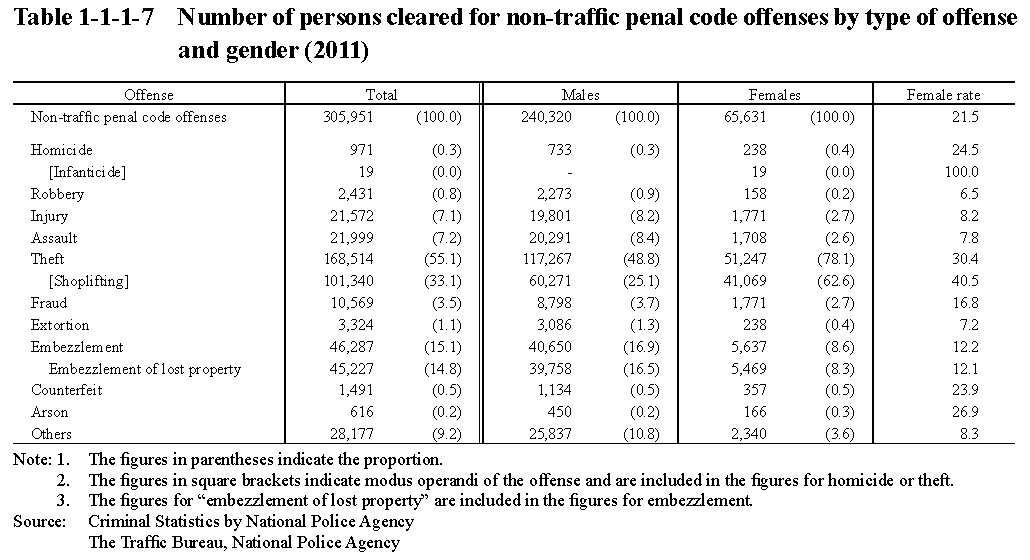
Table 1-1-1-7 shows the number of persons cleared for non-traffic penal code offenses by type of offense and gender in 2011. With both males and females, theft accounted for the highest proportions (48.8% and 78.1%, respectively), followed by embezzlement (16.9% and 8.6% (id.)). The female rate was overwhelmingly high for infanticide at 100.0% and also remarkably high for shoplifting at 40.5%.
Table 1-1-1-7 Number of persons cleared for non-traffic penal code offenses by type of offense and gender (2011)