2 Analysis of juvenile delinquencies
(1) General status
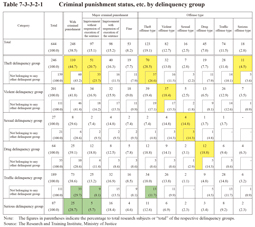
Table 7-3-3-2-1 shows the number of research subjects by delinquency group, criminal punishment status, major criminal punishment, and offense type, etc. (See page 311 for delinquency groups and offense types). This is used to analyze the characteristics of their criminal punishment status with respect to the respective problems they had while juveniles.
Table 7-3-3-2-1 Criminal punishment status, etc. by delinquency group
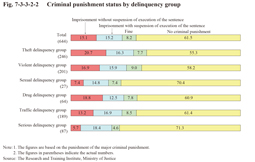
Fig. 7-3-3-2-2 shows the criminal punishment status by delinquency group.
Fig. 7-3-3-2-2 Criminal punishment status by delinquency group
With the theft delinquency group and the violent delinquency group both the proportion of those that received criminal punishment and the proportion of those sentenced to imprisonment without suspension of execution of the sentence were high (this trend is particularly remarkable with the theft delinquency group) when compared to all the research subjects, thus indicating that those of these delinquency groups are more likely to commit offenses after being discharged from juvenile training schools than the others. In contrast to this, with the sexual delinquency group and the serious delinquency group, the proportion of those that received criminal punishment was low and the proportion of those sentenced to imprisonment without suspension of execution of the sentence remarkably low when compared to all the research subjects. With the drug delinquency group and the traffic delinquency group the proportion of those that received criminal punishment was at the same level as the total research subjects, but when limited to those that belonged to the drug delinquency group only and those that belonged to the traffic delinquency group only (excluding those that also belonged to other delinquency groups) (figures in lower rows of the respective delinquency groups of Table 7-3-3-2-1) the percentages with them were both low (28.6% and 29.7%, respectively).
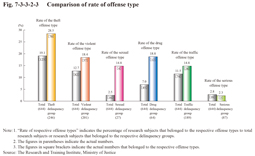
Fig. 7-3-3-2-3 shows the rate of offense type (percentage of research subjects that belonged to the respective offense types to total research subjects or research subjects that belonged to the respective delinquency groups).
Fig. 7-3-3-2-3 Comparison of rate of offense type
The rate of offense of the same type was high with every delinquency group, although excluding the serious delinquency group, when compared with the rate of respective offense among all the research subjects. The rate of offense of the same type was remarkably high in particular with the theft, violent, sexual, and drug delinquency groups. A specific continuity between juvenile delinquencies and the offenses they committed after their relevant discharge exists to a certain extent with those who received criminal punishment after being discharged.
Next, the characteristics of each delinquency group are examined (See Table 7-3-3-2-1). With the theft delinquency group the rate of the theft offense type was higher than with the total research subjects and the rate of the serious offense type also high at 4.5%. Although the rate of the theft offense type was the highest, the rate of offense of the other types was almost at the same level as with the total research subjects, thus indicating their criminal tendencies not being limited to theft. The same trends were observed with those that did not belong to any other delinquency groups.
With the violent delinquency group the rate of the violent offense type was higher than with all the research subjects, and the rate even higher with those that also belonged to other delinquency groups at 22.2% (20 of 90). The rate of the serious offense type was also higher at 3.5% (one committed injury causing death and six robbery) than with all the research subjects. In contrast to this, examining the rate of each offense type with the violent delinquency group revealed that the rate of the theft offense type was the highest, although almost at the same level as the rate of the violent offense type. Those of the violent delinquency group were strongly connected with violent offenses of the same type and theft, thus indicating that they might commit serious offenses (robbery, etc.) combining these offenses.
With the drug delinquency group the percentage of those that received criminal punishment was at the same level as with all the research subjects, but when limited to those that also belonged to other delinquency groups (29 persons) the percentage of those that received criminal punishment and the percentage of those sentenced to imprisonment without suspension of execution of the sentence were both remarkably higher at 51.7% and 27.6%, respectively, than with all the research subjects (See (2) of this subsection).
With the traffic delinquency group the percentage of those that received criminal punishment was at the same level as with all the research subjects, but the percentage of those sentenced to imprisonment without suspension of execution of the sentence was slightly lower at 13.2% than with all the research subjects, with this percentage being remarkably lower at 8.1% in particular with those that did not belong to any other delinquency group. In contrast to this, with those that also belonged to other delinquency groups, the percentage of those that received criminal punishment (51.3%) and the percentage of those sentenced to imprisonment without suspension of execution of the sentence (20.5%) were both higher than with all the research subjects. As indicated above the criminal tendencies of those of the traffic delinquency group also significantly differ depending on whether they belonged to any other delinquency group or not.
In addition, examining the rate of each offense type of all total research subjects reveals the rate of the theft offense type to be the highest at 19.1%, and when limited to those that received criminal punishment (248 persons) the rate rose to around 50%. In addition, examining the actual number of research subjects of the respective offense types by delinquency group revealed that those who committed theft accounted for the largest in number with every delinquency group (including the cases where the number was the same as that of those of other offense types), although excluding the sexual delinquency group, thus indicating the importance of prevention of theft after being discharged, regardless of the type of juvenile delinquency.
(2) Drug delinquencies
The drug delinquency group was composed of 41 males and 23 females, with the female rate being higher than that of all the research subjects (606 males and 38 females). Furthermore, of those that did not belong to any other delinquency groups the female rate was remarkably high, being 14 males but 21 females.
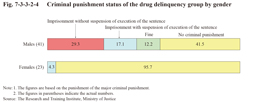
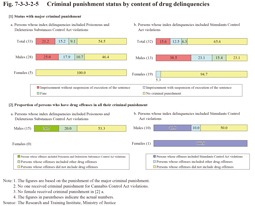
Fig. 7-3-3-2-4 shows the criminal punishment status of the drug delinquency group by gender. The percentage of those that received criminal punishment and the percentage of those sentenced to imprisonment without suspension of execution of the sentence were both remarkably higher with males at 58.5% and 29.3%, respectively, than with females and were also significantly higher than with the research subjects. In addition, the rates of the theft, violent, drug, and serious offense types of males that belonged to the drug delinquency group were all remarkably higher at 29.3%, 22.0%, 26.8%, and 9.8%, respectively, than that of all the research subjects.
The difference observed in the percentage of those that received criminal punishment depending on whether they belonged to other delinquency groups or not is considered to be due to the fact that only two females also belonged to other delinquency groups, whereas the majority of females (21) did not belong to any other delinquency group (when limited to males the percentage of those that received criminal punishment was higher with those that did not belong to any other delinquency group than with those that also belonged to other delinquency groups).
Fig. 7-3-3-2-4 Criminal punishment status of the drug delinquency group by gender
Fig. 7-3-3-2-5 shows the status with criminal punishment and drug offenses after their relevant discharge of those whose index delinquencies included either of Poisonous and Deleterious Substances Control Act violations or Stimulants Control Act violations (33 and 32 persons, respectively, including three whose index delinquencies included both) by gender. With males the percentage of those that received criminal punishment and the percentage of those sentenced to imprisonment without suspension of execution of the sentence were remarkably higher with those whose index delinquencies were either of the two above than with all the research subjects (644 persons) (38.5% and 15.1%, respectively; See Fig. 7-3-3-2-2). The criminal deposition of males whose index delinquency was Stimulants Control Act violations was extremely severe in particular as 10 (76.9%) of them received criminal punishment and of which half (five) were sentenced to imprisonment without suspension of execution of the sentence. In addition, the proportion of those who had any drug offenses in all their criminal punishment among those whose delinquencies included Poisonous and Deleterious Substances Control Act violations or Stimulants Control Act violations and who received criminal punishment was high at 46.7% (seven) and 50.0% (five), respectively. Furthermore, the number of offenses included in all criminal punishment (calculated by dividing the total number of types of offenses included in judgments of all criminal punishment by the number of persons) was 2.2 with all the research subjects that received criminal punishment (248 persons) but remarkably higher at 3.0 with males whose index delinquencies included Stimulants Control Act violations and 2.7 with males whose index delinquencies included Poisonous and Deleterious Substances Control Act violations, thus indicating males whose index delinquencies included Stimulants Control Act violations or Poisonous and Deleterious Substances Control Act violations committed more varied types of offenses.
The percentage of those that committed offenses after being discharged being high, having strong tendencies to repeat drug offenses, their criminal tendencies expanding the scope of direction and therefore more likely to commit other offenses in combination with drug offenses are of particular note with males with a history of drug delinquencies.
Fig. 7-3-3-2-5 Criminal punishment status by content of drug delinquencies
(3) History of protective measures
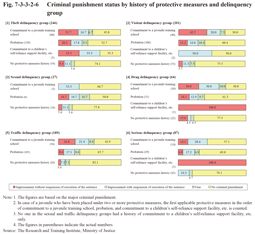
Fig. 7-3-3-2-6 shows the criminal punishment status by delinquency group and history of protective measures.
The relationship between the juvenile protective measures history of all the research subjects and their subsequent criminal punishment was pointed out in the previous subsection (See Fig. 7-3-3-1-1). Further examining this characteristic in more detail by classifying the research subjects into the respective delinquency groups revealed that with each delinquency group the percentage of those that received criminal punishment was higher with those with a history of protective measures than with those without the said history, and with each delinquency group, although excluding the sexual delinquency group, the percentage of those that received criminal punishment and the percentage of those sentenced to imprisonment without suspension of execution of the sentence were both higher with those with a history of commitment to a juvenile treatment schools than with those with a history of probation, thus indicating similar trends with all the research subjects. However, with the sexual delinquency group, although the number of research subjects of concern in that group was not large, the percentage of those that received criminal punishment and the percentage of those sentenced to imprisonment without suspension of execution of the sentence were both lower with those with a history of commitment to a juvenile training school than with those with a history of probation thus indicating a reversed trends of all the research subjects. In addition, of 16 research subjects that received criminal punishment for offenses of the sexual offense type, two had a history of commitment to a juvenile training school, seven had a history of probation, one had a history of commitment to a children’s self-reliance support facility, etc., and six had no history of protective measures. The number of those without a history of protective measures was therefore larger than the number of those with a history of commitment to a juvenile training school. Although the relationship between history of protective measures and criminal punishment is a common problem across all delinquency groups, the existence of a problem other than juvenile delinquent tendencies can be indicated with sexual offenses.
Furthermore, when limited to those with a history of commitment to a juvenile training school, 70.0% (28) of those of the violent delinquency group received criminal punishment and 42.5% (17) were sentenced to imprisonment without suspension of execution of the sentence. The percentages were both higher than those belonging to other delinquency groups. In addition, the offenses for which they received criminal punishment included robbery (three persons) and injury causing death (one), and the percentage of those of the violent delinquency group who committed offenses of serious offense type and had a history of commitment to a juvenile training school (10.0%) was remarkably higher than the percentage of the serious offense type of all the research subjects (2.8%). The criminal punishment status of those of the violent delinquency group with a history of commitment to a juvenile training school was therefore serious both at the level of the percentage of those that committed offenses after their relevant discharge and the quality of the offenses they committed.
Fig. 7-3-3-2-6 Criminal punishment status by history of protective measures and delinquency group
(4) Employment
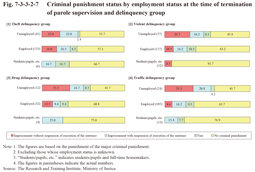
The percentage of those that received criminal punishment being higher with those unemployed at the time of termination of their parole supervision than with those employed, etc. was observed in the previous subsection (See Fig. 7-3-3-1-7). Fig. 7-3-3-2-7 shows the criminal punishment status by employment status at the time of termination of parole supervision and delinquency group (theft, violent, drug, and traffic delinquency groups).
With every abovementioned delinquency group the percentage of those that received criminal punishment was higher with those unemployed than with those employed, etc. The percentage of those unemployed and received criminal punishment was 54.1% with the violent delinquency group, 58.3% with the drug delinquency group, and 58.3% with the traffic delinquency group, which were all particularly higher than that of those employed.
Fig. 7-3-3-2-7 Criminal punishment status by employment status at the time of termination of parole supervision and delinquency group
