5 Redisposition of juvenile/young probationers/parolees
Table 7-2-5-6 shows the percentage of juvenile probationers and juvenile training school parolees whose probation/parole supervision terminated during the period of 2001 through to 2010 that were then placed under protective measures or received criminal punishment due to repeat delinquencies/offenses during their probation/parole supervision period (redisposition rate; hereinafter the same in this subsection) over the last 10 years. The redisposition rate was 17.1 to 19.2% with juvenile probationers and 20.7 to 25.3% with juvenile training school parolees.
Table 7-2-5-7 shows the redisposition rate of young probationers/parolees whose probation/parole supervision terminated during the period of 2001 through to 2010 over the last 10 years. The redisposition rate of young probationers was 35.4 to 43.5%, and remained higher than that of the total probationers every year (See Table 4-6-4-2). That of young parolees was 0.7 to 1.5%, with no significant difference being observed with that of total parolees.
The redisposition rate of young probationers has been on a declining trend in recent years. However, although no exact comparison can be made due to the difference in the average period of probation, etc., it was more than twice that of juvenile probationers, thus indicating that the high percentage of those granted suspension of execution of the sentence with probation at a young age repeated offenses.
Table 7-2-5-6 Redisposition rate of juvenile probationers/juvenile training school parolees (2001-2010)
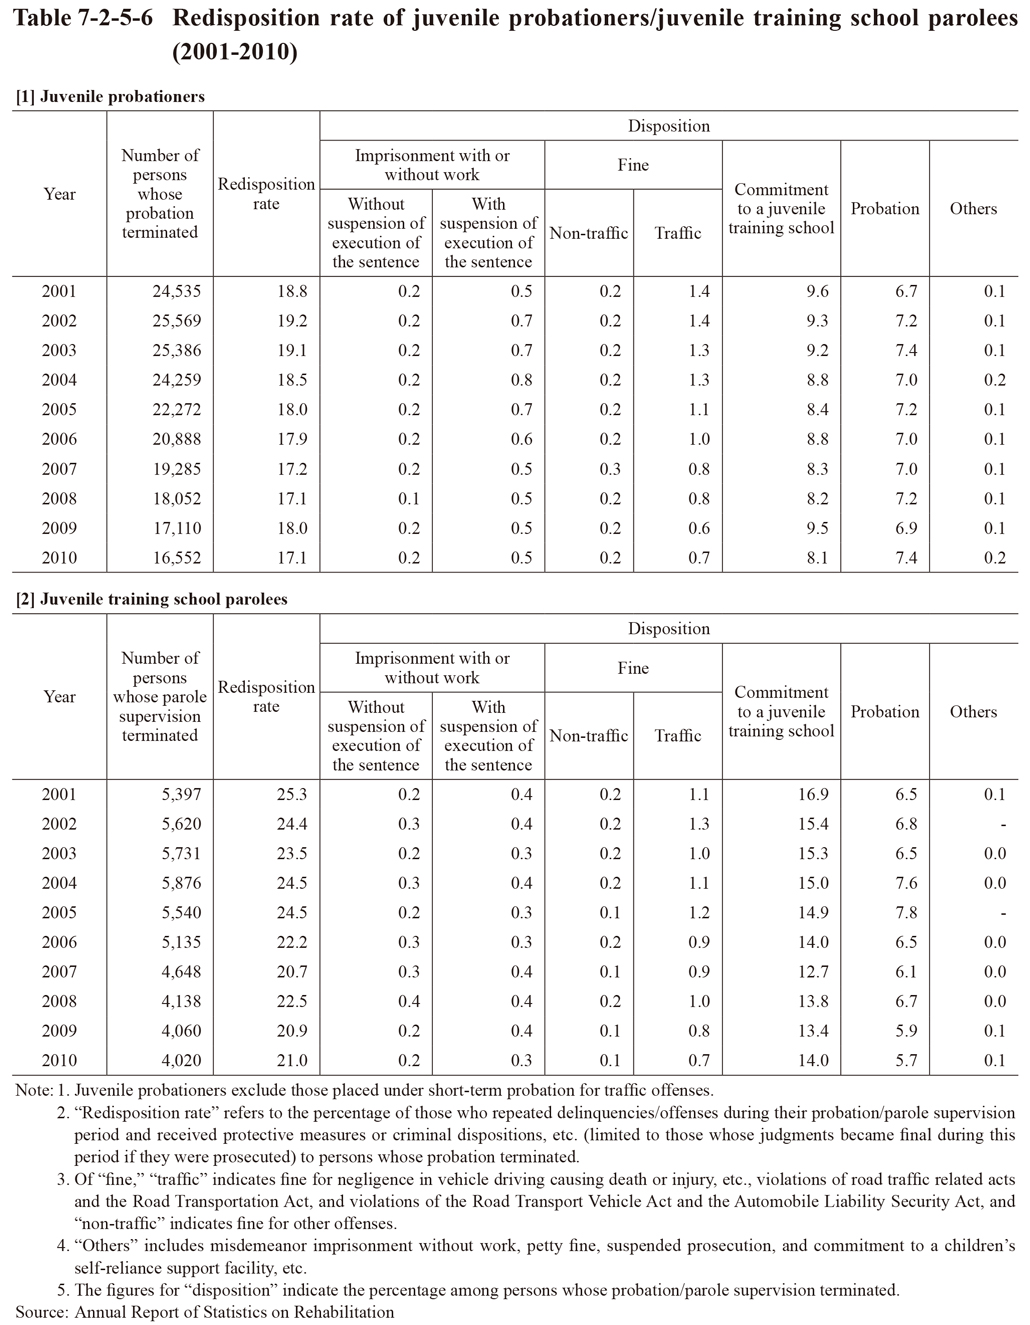
Table 7-2-5-7 Redisposition rate of young probationers/parolees (2001-2010)
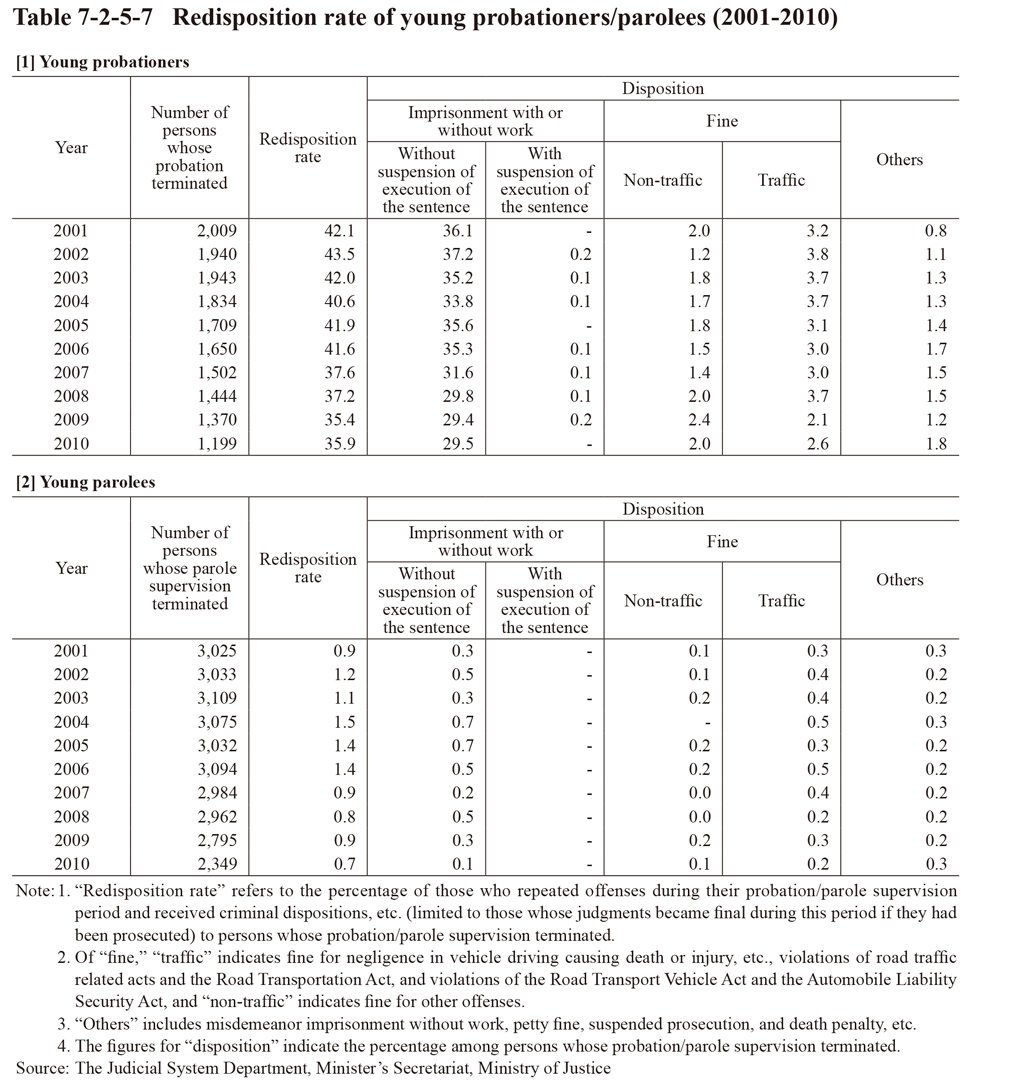
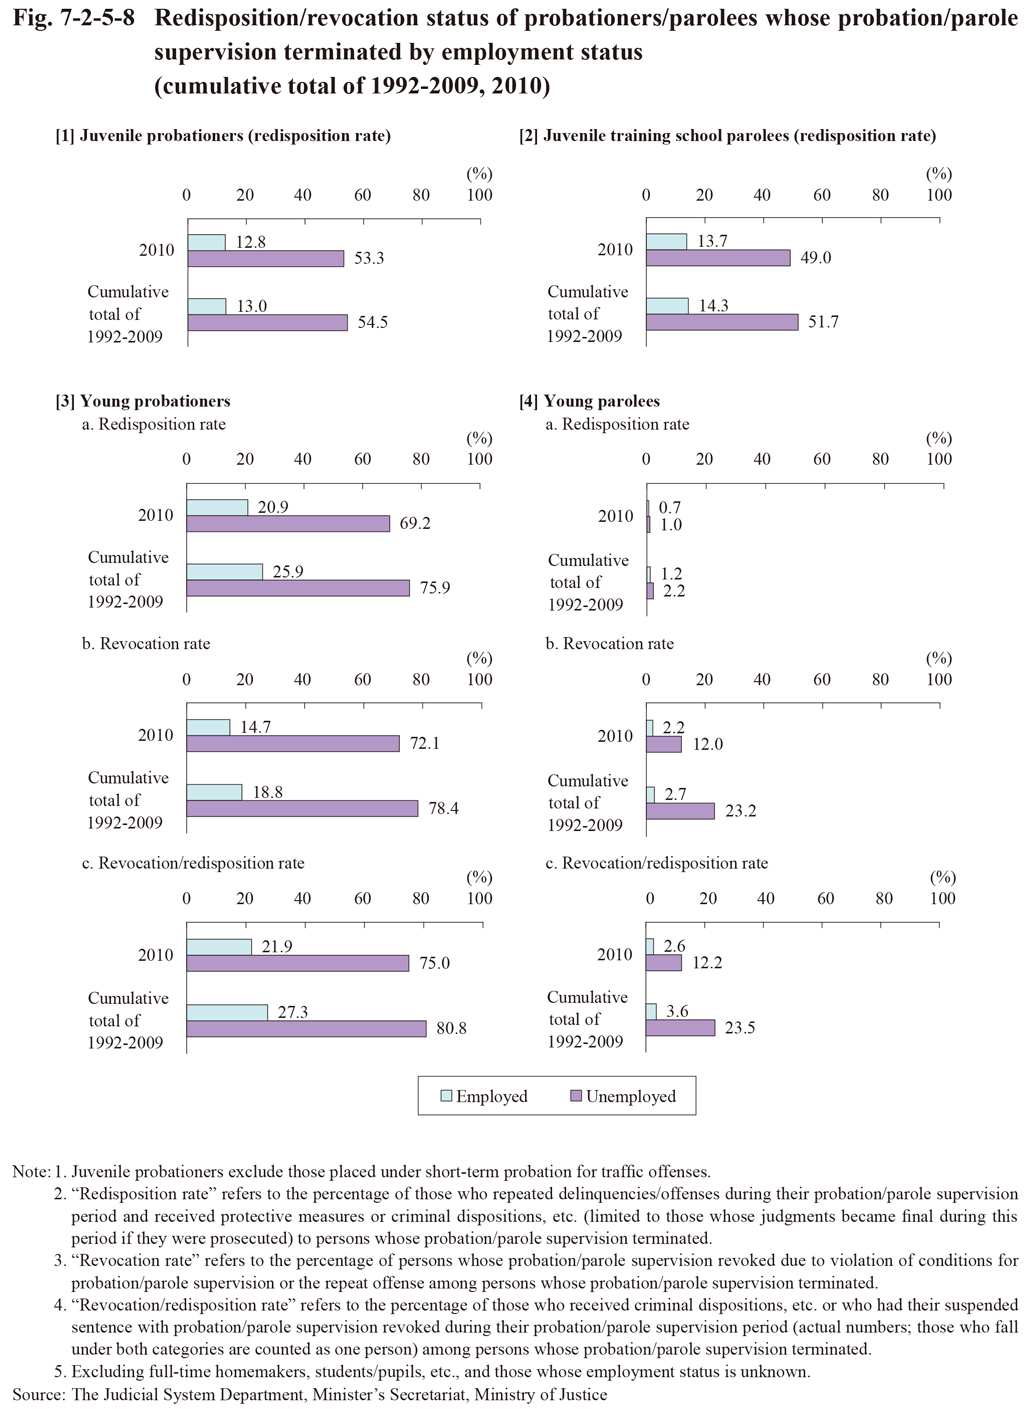
Fig. 7-2-5-8 shows the redisposition rate, revocation rate (percentage of those whose probation/parole supervision was revoked due to violation of their conditions for supervision or repeat offenses), and revocation/redisposition rate (percentage of those (actual number of persons) falling under either one of these cases) of juvenile/young probationers/parolees whose probation/parole supervision terminated in 2010 and during the period of 1992 through to 2009 (cumulative total) by employment status. The redisposition rates of juvenile probationers/juvenile training school parolees and the redisposition rate, revocation rate, and revocation/redisposition rate of young probationers and young parolees were all higher with those who were unemployed at the time of termination of their probation/parole supervision than with those who were employed (this trend is particularly remarkable with young probationers), and hence employment is considered to play a significant role in repeat delinquency/offense prevention.
Fig. 7-2-5-8 Redisposition/revocation status of probationers/parolees whose probation/parole supervision terminated by employment status (cumulative total of 1992-2009, 2010)