6 Protective measure histories of young new inmates
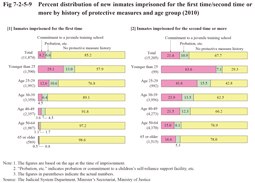
Fig. 7-2-5-9 shows the percent distribution of young new inmates imprisoned for the first time/reimprisoned in 2010 by their history of protective measures and in comparison with other age groups. The proportion of those with a history of protective measures declined as the age of the group rose with both those imprisoned for the first time and those reimprisoned. With every age group the proportion of those with a history of protective measures was higher with those reimprisoned than that with those imprisoned for the first time. The proportion was particularly high with those reimprisoned younger than 25 at over 70%. By type of protective measures, the proportion of those with a history of commitment to a juvenile training school was high across all age groups, and this trend was particularly remarkable with those reimprisoned.
Fig 7-2-5-9 Percent distribution of new inmates imprisoned for the first time/second time or more by history of protective measures and age group (2010)
