Chapter 7 Offenses by the Elderly
Section 1 Trends in Offenses
Fig. 4-7-1-1 shows the number of persons cleared for non-traffic Penal Code offenses by age groups.
Fig. 4-7-1-1 Penal Code offenses: persons cleared, by age groups
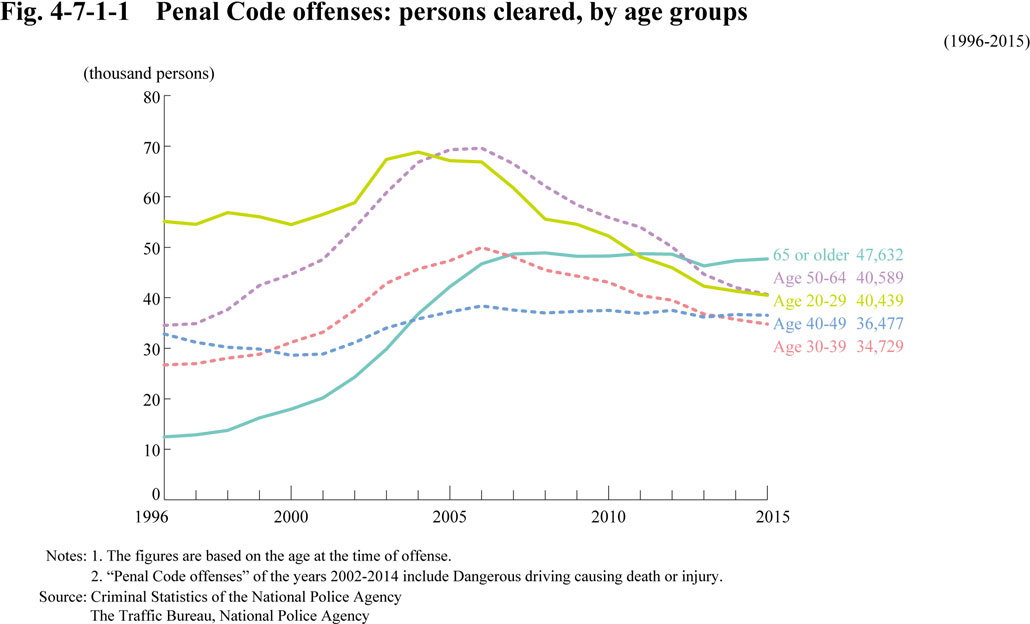
Fig. 4-7-1-2 shows the rate per population of persons cleared for non-traffic Penal Code offenses by age groups.
Fig. 4-7-1-2 Penal Code offenses: rate per population of persons cleared, by age groups
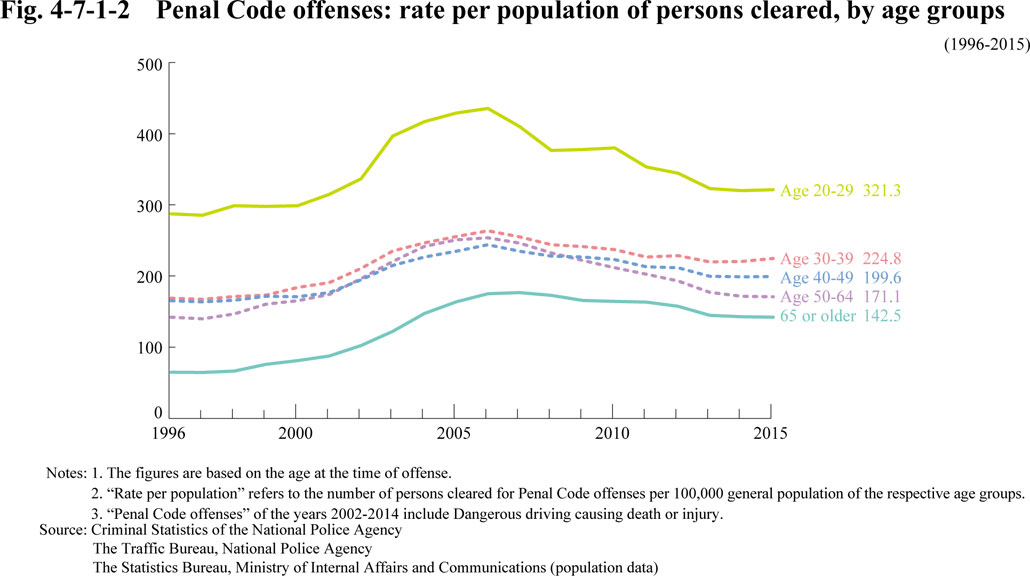
Fig. 4-7-1-3 shows the percent distribution of elderly persons cleared for non-traffic Penal Code offenses by gender and type of offense in 2015.
Fig. 4-7-1-3 Penal Code offenses: elderly persons cleared, percentages by types of offense and male/female
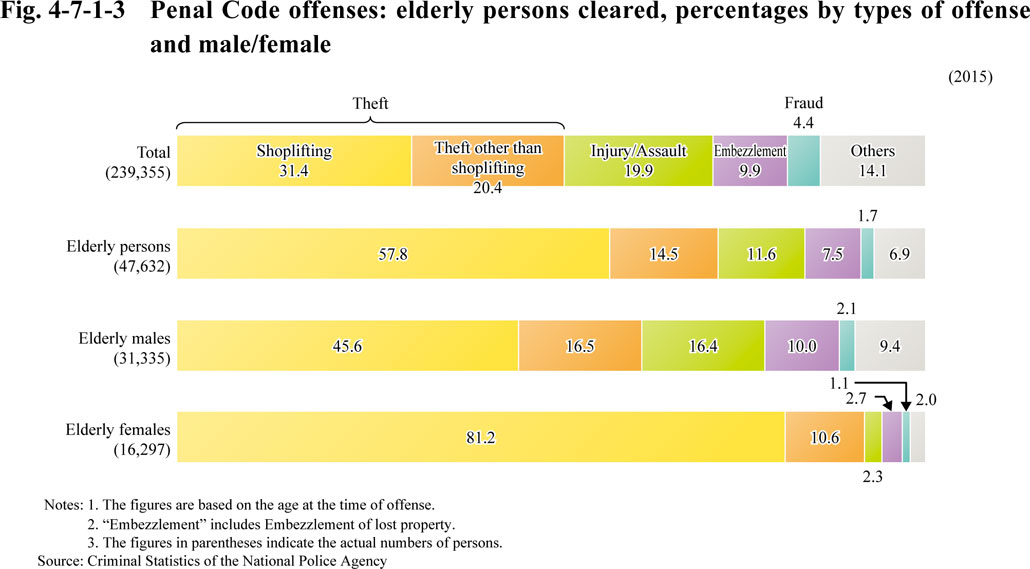
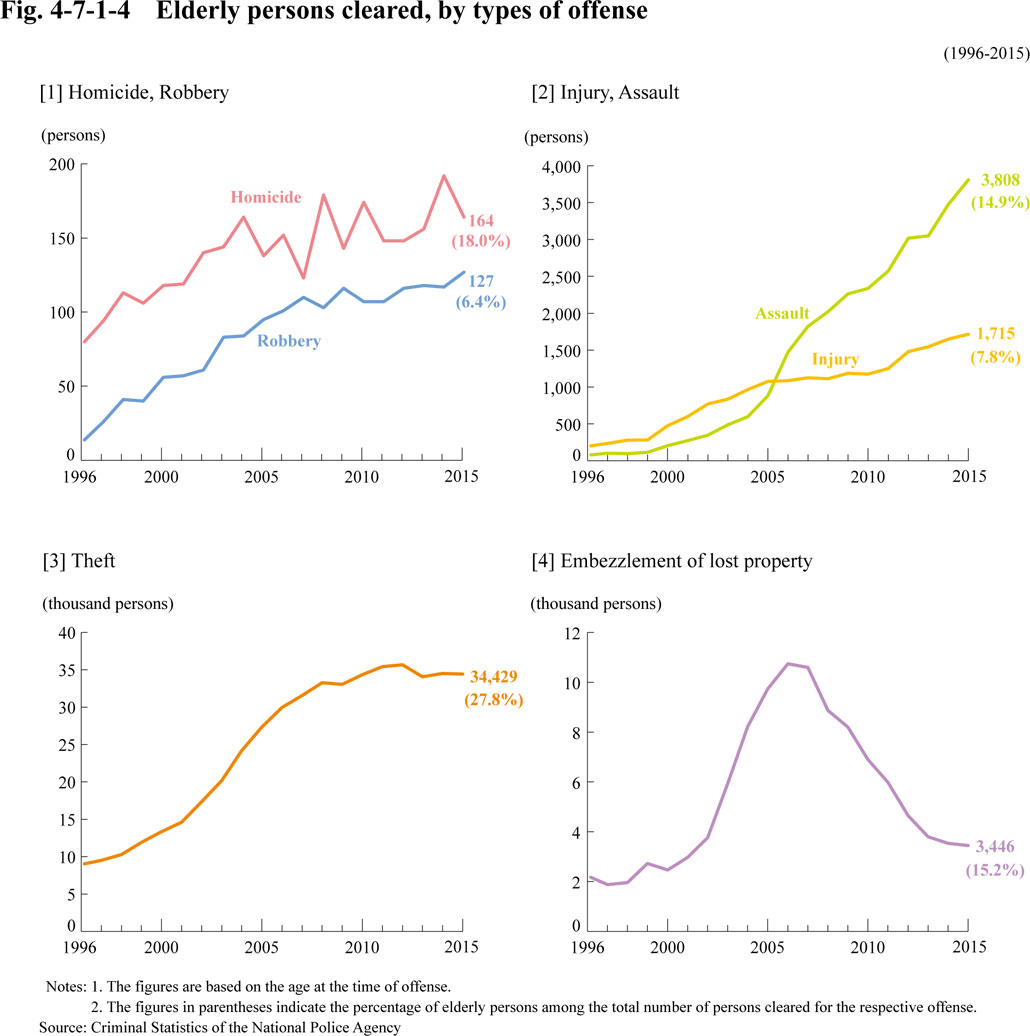
Fig. 4-7-1-4 shows the number of elderly persons cleared for several Penal Code offenses.
Fig. 4-7-1-4 Elderly persons cleared, by types of offense