3 Probation/parole supervision
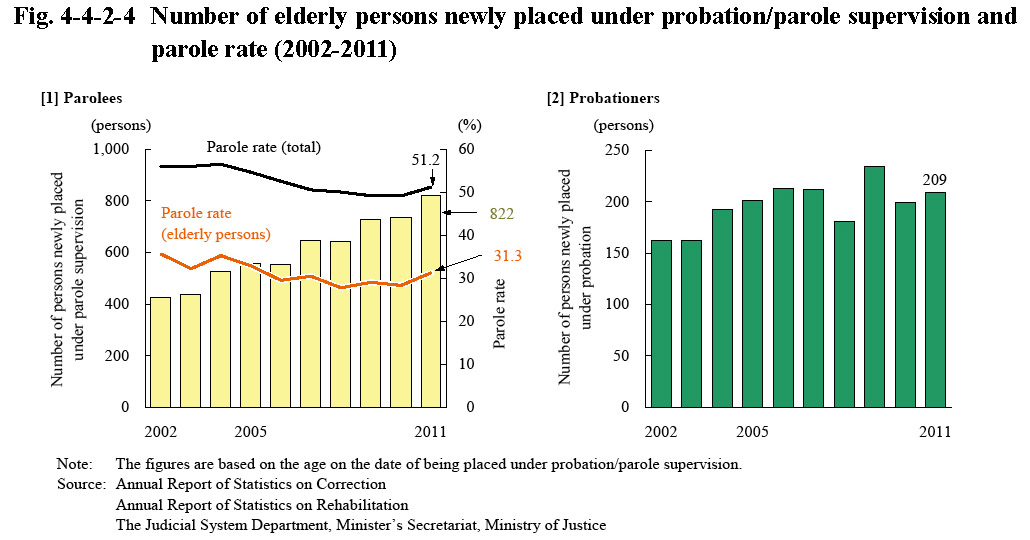
Fig. 4-4-2-4 shows the number of elderly probationers/parolees newly placed under probation/parole supervision and parole rate over the last 10 years. The number of probationers was on a slightly increasing trend whereas the number of parolees was on a clearly increasing trend. The parole rate for elderly persons was lower than that with total released inmates (approximately 49-57%), which is considered to be due to the fact that many elderly persons could not secure places to return to after being released because they had no guarantor, etc.
Fig. 4-4-2-4 Number of elderly persons newly placed under probation/parole supervision and parole rate (2002-2011)