2 Correction
Fig. 4-4-2-2 shows the number of new elderly inmates by history of imprisonment over the last 20 years. The number was basically on a consistently increasing trend over the last 20 years while the percentage of elderly persons to total new inmates (elderly rate) was also basically consistently rising. The percentage of reimprisoned inmates was higher with elderly new inmates than all new inmates (See Fig. 4-6-3-1), but the number of first time elderly inmates was significantly increasing too when compared to 20 years ago.
Fig. 4-4-2-2 Number of new elderly inmates by history of imprisonment (1992-2011)
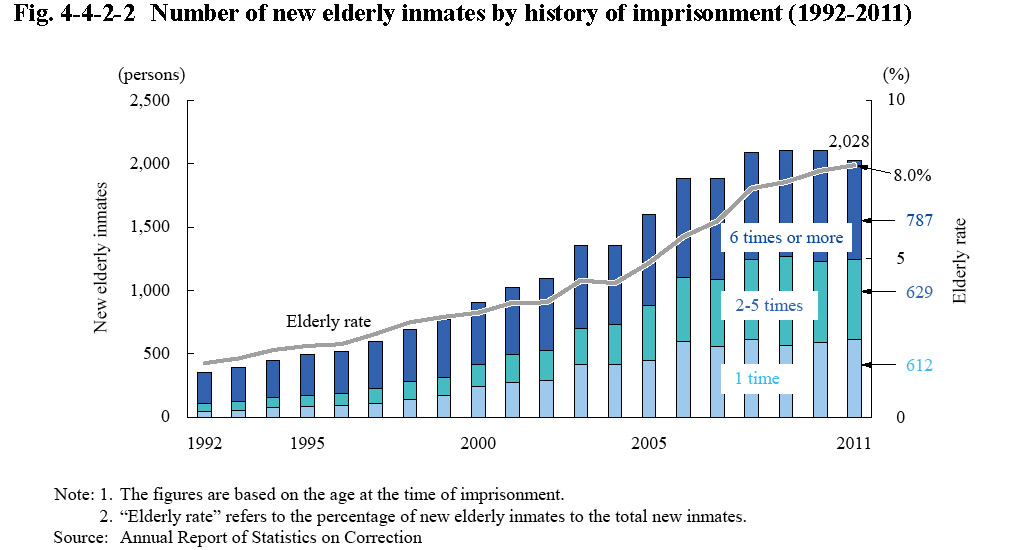
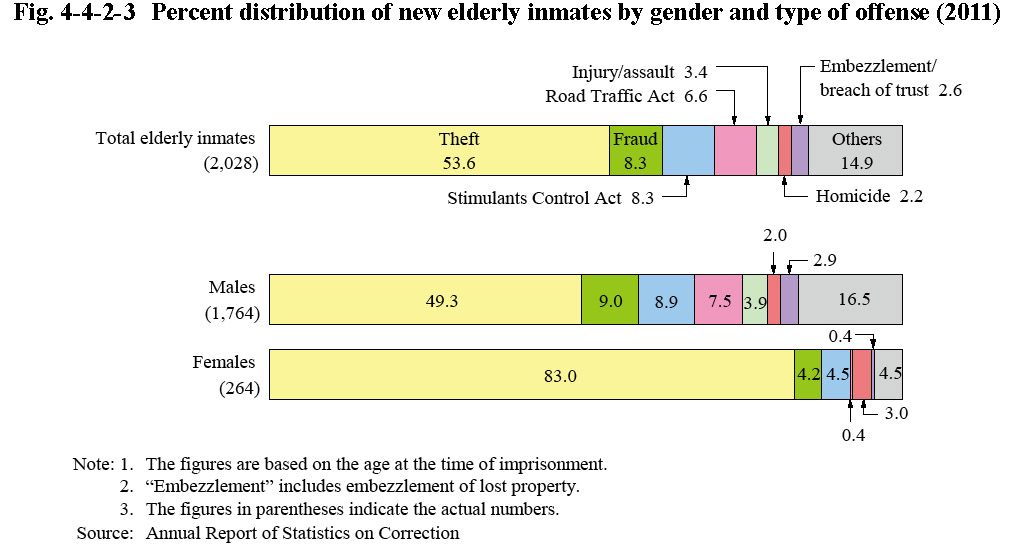
Fig. 4-4-2-3 shows the percent distribution of new elderly inmates in 2011 by gender and type of offense. With all elderly inmates, the proportion for theft was the highest at 53.6%, followed by fraud at 8.3%, Stimulants Control Act violations at 8.3%, Road Traffic Act violations at 6.6%, and injury/assault at 3.4%. With females, the proportion for theft was especially high at 83.0%.
Fig. 4-4-2-3 Percent distribution of new elderly inmates by gender and type of offense (2011)