Section 3 Correction
1 Inmates reimprisoned
Fig. 4-6-3-1 shows the number of inmates newly imprisoned for the first time/reimprisoned and the rate of reimprisoned inmates (refers to the percentage of inmates reimprisoned to all new inmates) over the last 20 years. The number of inmates reimprisoned continued increasing every year from 1999, but then remained stable from 2007. In 2011 it decreased to 14,634 (down 3.8% from the previous year). The rate of reimprisoned inmates continued to rise every year from 2004, and was 57.4% in 2011.
With females, the number of inmates reimprisoned was on an increasing trend from 2000 and was 914 in 2011. The rate of reimprisoned inmates was low at 41.1% when compared with males, but continued to rise every year from 2005.
Fig. 4-6-3-1 Number of inmates newly imprisoned for the first time/reimprisoned and rate of reimprisoned inmates (total/females) (1992-2011)
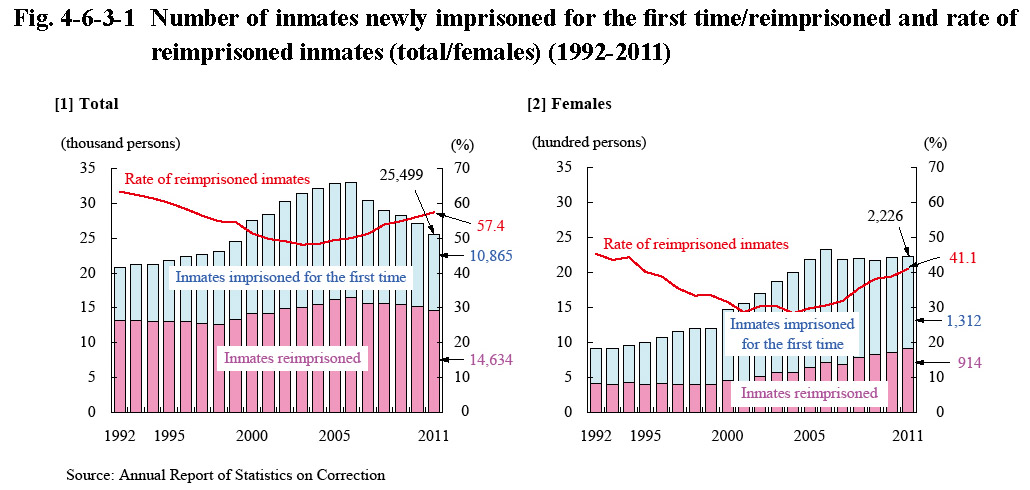
Fig. 4-6-3-2 shows the percent distribution of new inmates by history of imprisonment in 2011. Those reimprisoned accounted for nearly 60% while those imprisoned five times or more 20%. With females, those imprisoned for the first time accounted for approximately 60%, whereas those imprisoned five times or more accounted for the lower percentage of 7.2% when compared to all new inmates (See Appendix 2-8 for the number of new inmates by type of offense and history of imprisonment in 2011).
Fig. 4-6-3-2 Percent distribution of new inmates by history of imprisonment (total/females) (2011)
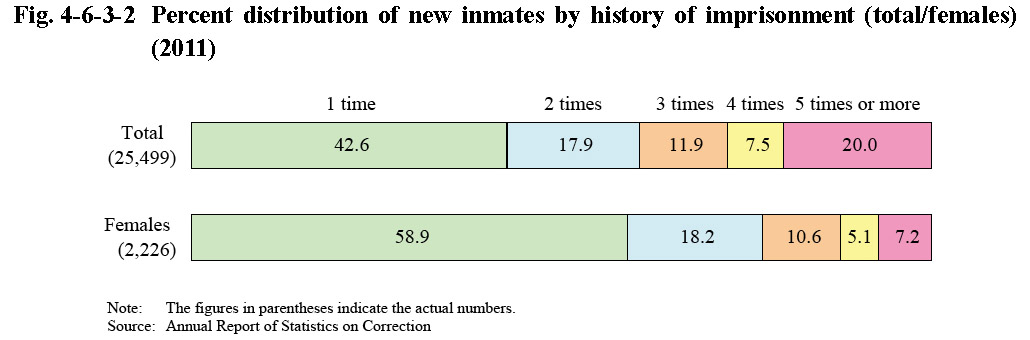
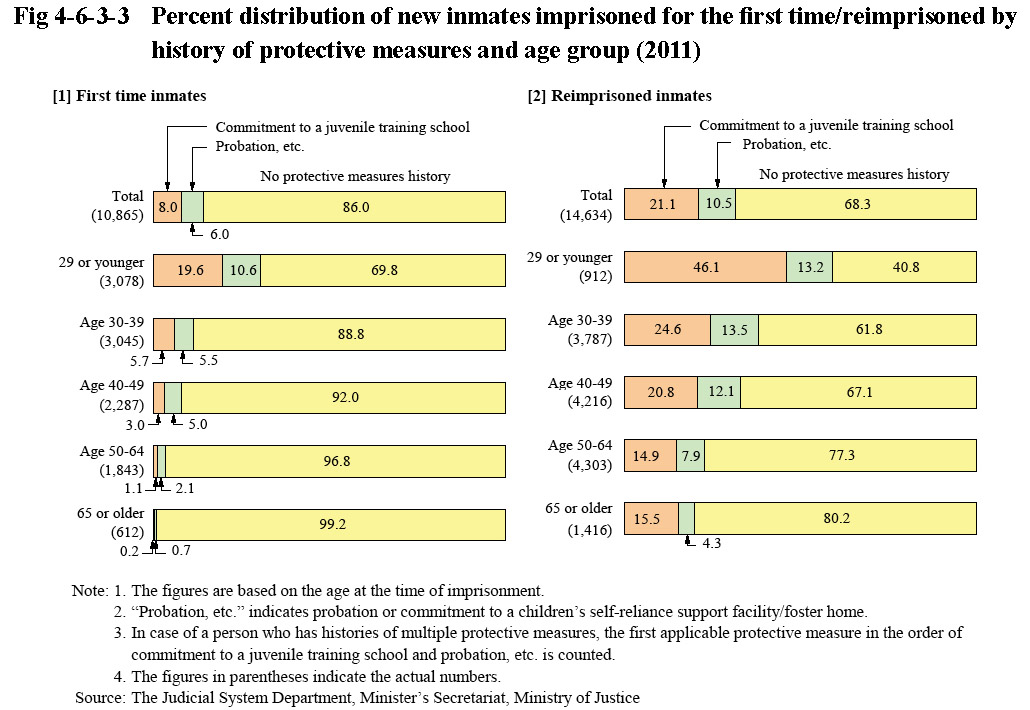
Fig. 4-6-3-3 shows the percent distribution of new inmates imprisoned for the first time/reimprisoned by history of protective measures and age group in 2011. The proportion of those with histories of protective measures rose as the age of the group goes down with both those imprisoned for the first time and those reimprisoned. With every age group, the proportion of those with histories of protective measures was higher with those reimprisoned than that with those imprisoned for the first time. The proportion was particularly high with those reimprisoned and who are younger than 30 at approximately 60%. By type of protective measures, the proportion of those with histories of commitment to a juvenile training school was high across almost all age groups, and this trend was particularly remarkable with those reimprisoned.
Fig. 4-6-3-3 Percent distribution of new inmates imprisoned for the first time/reimprisoned by history of protective measures and age group (2011)