2 Characteristics of juvenile/young probationers/parolees
(1) Type of offense/delinquency
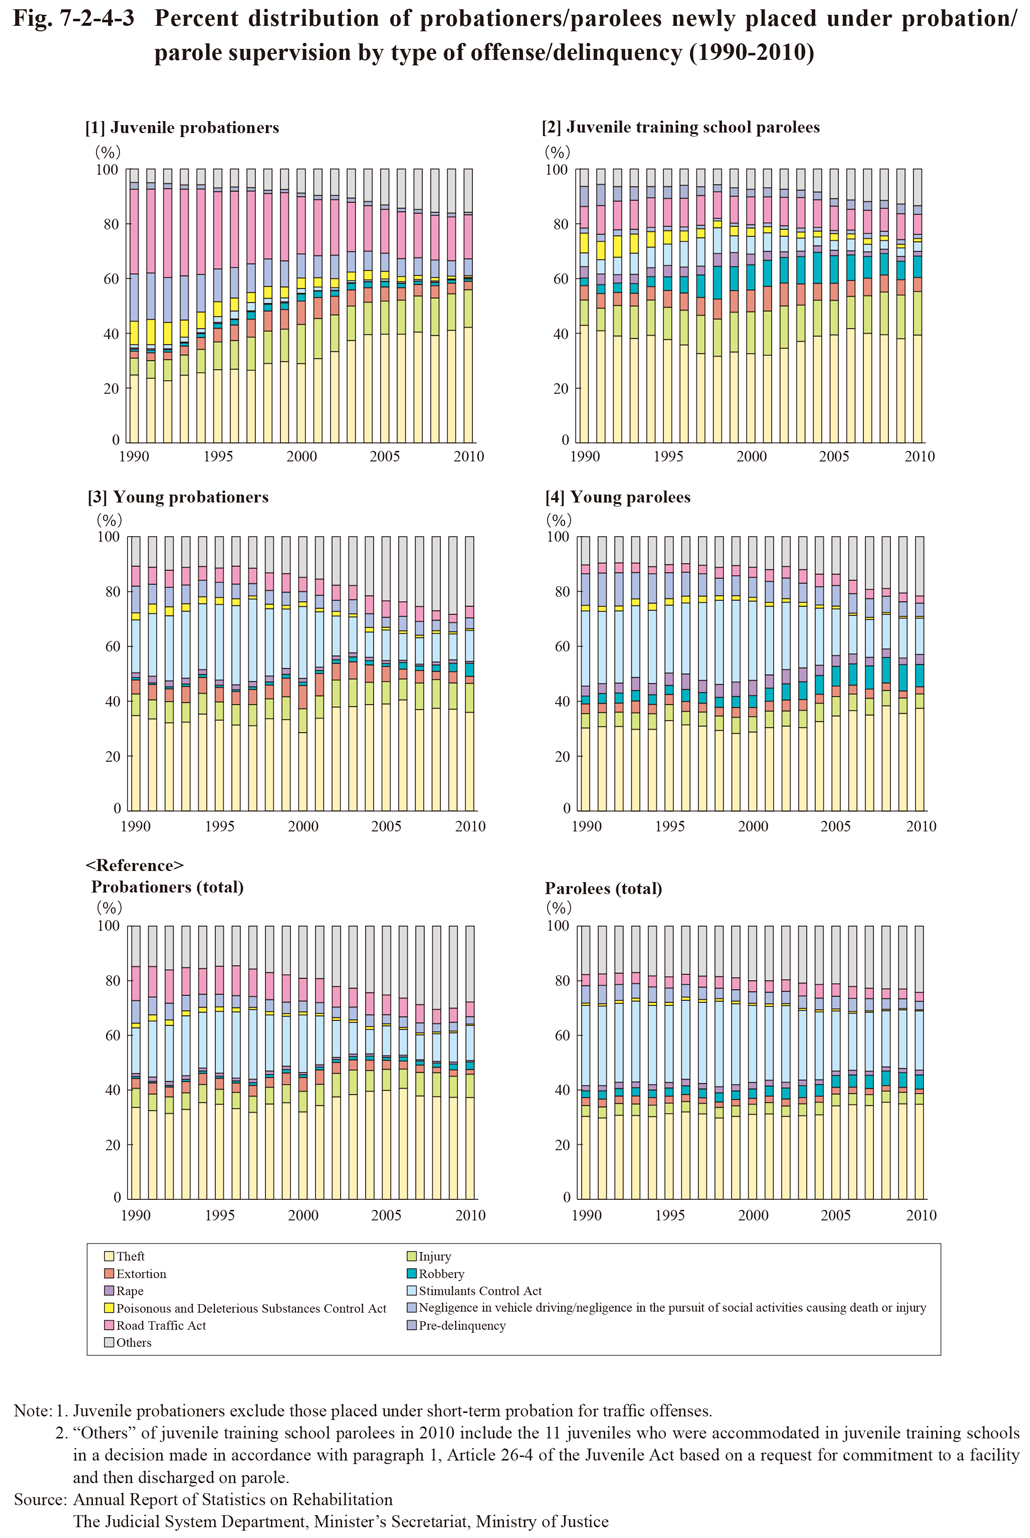
Fig. 7-2-4-3 shows the percent distribution of probationers/parolees newly placed under probation/parole supervision by type of offense/delinquency since 1990.
Theft accounted for the highest proportion with all juvenile probationers, juvenile training school parolees, young probationers, and young parolees every year. By type of offense, excluding theft, in 2010, Road Traffic Act violations accounted for the highest proportion with juvenile probations, followed by injury, whereas with juvenile training school parolees injury accounted for the highest proportion, followed by robbery, and then Road Traffic Act violations, and the proportion of non-traffic penal code offenses and special act offenses, excluding violations of road traffic related acts, was high when compared to juvenile probationers (note that juvenile probationers do not include those placed under short-term probation for traffic offenses). With young probationers Stimulants Control Act violations accounted for the highest proportion, followed by injury and robbery, whereas with young parolees Stimulants Control Act violations accounted for the highest proportion, and then followed by robbery and injury. The proportion of Stimulants Control Act violations was high with young people when compared to juveniles.
Examining changes in the percent distribution revealed that with juvenile probationers the proportion of theft rose by 19.5 points from 22.6% in 1992 to 42.2% in 2010, while the proportion of Road Traffic Act violations and negligence in vehicle driving/negligence in the pursuit of social activities causing death or injury declined. In addition, with both juvenile probationers and juvenile training school parolees the proportion of injury rose and the proportion of pre-delinquency and Poisonous and Deleterious Substances Control Act violations declined. With young probationers and young parolees the proportion of robbery rose while the proportion of Stimulants Control Act violations declined.
Fig. 7-2-4-3 Percent distribution of probationers/parolees newly placed under probation/parole supervision by type of offense/delinquency (1990-2010)
(2) Residential status
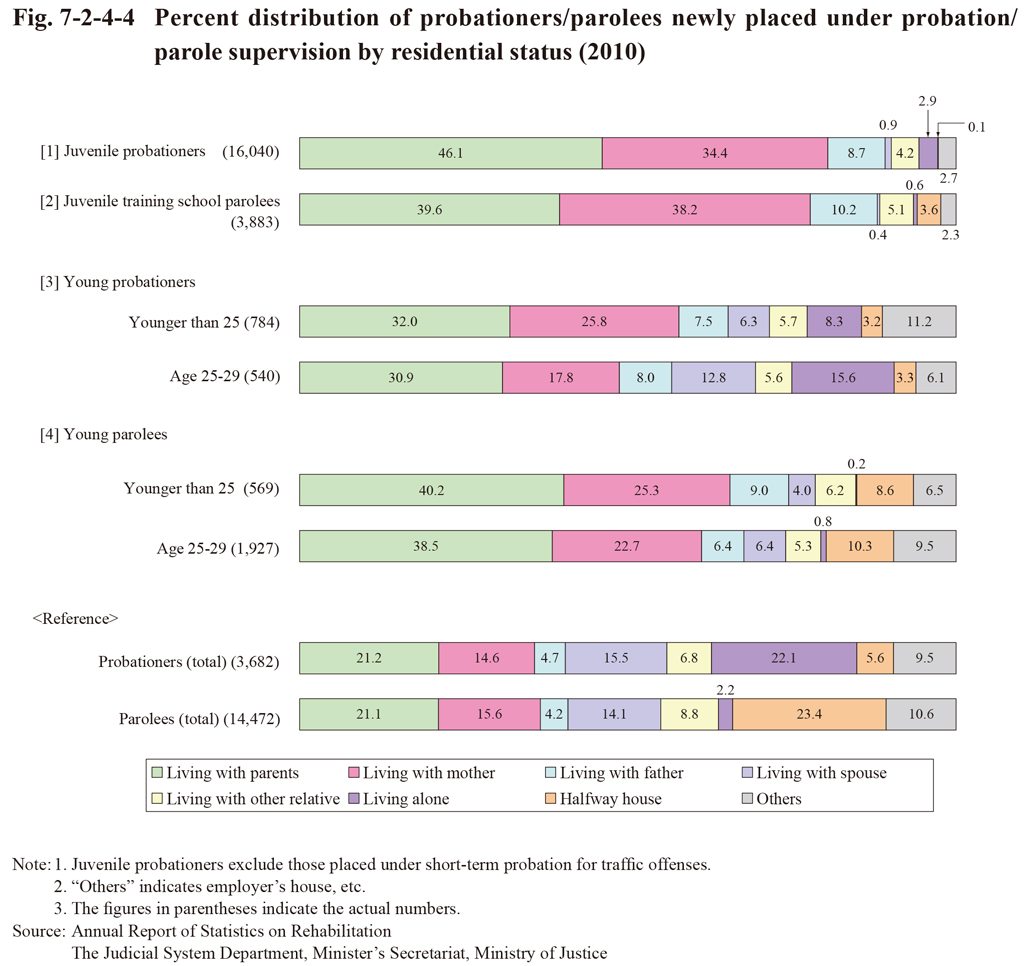
Fig. 7-2-4-4 shows the percent distribution of probationers/parolees newly placed under probation/parole supervision in 2010 by their residential status at the time of commencement of their probation/parole supervision.
The proportion of those “living with parents” accounted for the highest with all juvenile probationers, juvenile training school paroles, young probationers, and young parolees. The total proportion of those “living with parents,” “living with mother,” or “living with father” accounted for 56.7% and 67.7% with young probationers and young parolees aged 25-29, respectively, 65.3% and 74.5% with those younger than 25, and 89.2% and 88.0% with juvenile probationers and juvenile training school paroles, respectively, which were all higher than that with total probationers (40.5%) and that with total parolees (40.9%) (See Fig. 2-5-2-4). In addition, the proportion of those living with parents rose as the age of the group got lower. In recent years, however, the proportion of those “living with parents” declined with both juvenile probationers and juvenile training school parolees and the proportion of those “living with mother” rose remarkably (See Fig. 3-1-5-4).
Fig. 7-2-4-4 Percent distribution of probationers/parolees newly placed under probation/parole supervision by residential status (2010)
(3) Employment status
Fig. 7-2-4-5 shows the percent distribution of probationers/parolees whose probation/parole supervision terminated in 2010 by reason for the termination and their educational/employment status.
The proportion of juvenile probationers and juvenile training school parolees whose probation/parole supervision terminated because of revocation of protective measures (refers to revocation of former measures and subsequent placement under new measures due to repeat delinquencies/offenses) was high at 49.9% and 41.6%, respectively, with those who were unemployed, and was remarkably higher than that with those who were employed or were students/pupils. In addition, the proportion of young probationers whose probation terminated because of revocation of suspension of execution of the sentence and the proportion of young parolees whose parole supervision terminated because of revocation of parole were 72.4% and 12.0%, respectively, with those who were unemployed, and were both higher than that with those who were employed, with the difference being particularly remarkable with young probationers.
Fig. 7-2-4-5 Percent distribution of probationers/parolees whose probation/parole supervision terminated by reason for termination and educational/employment status (2010)
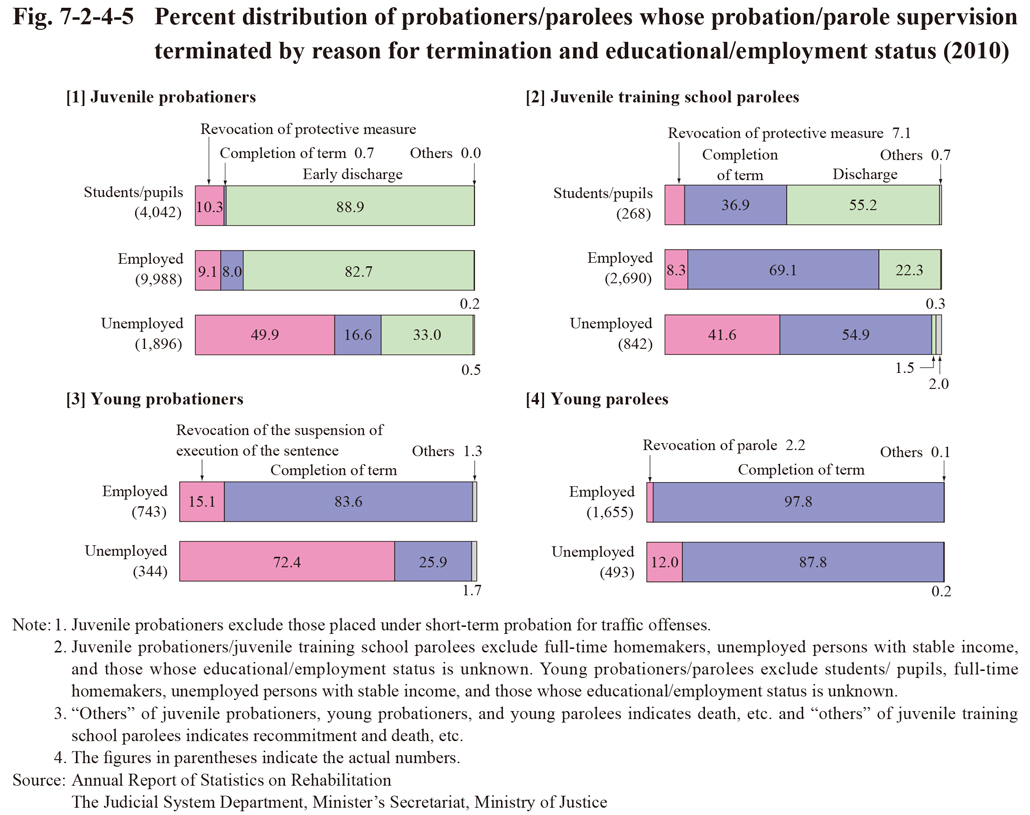
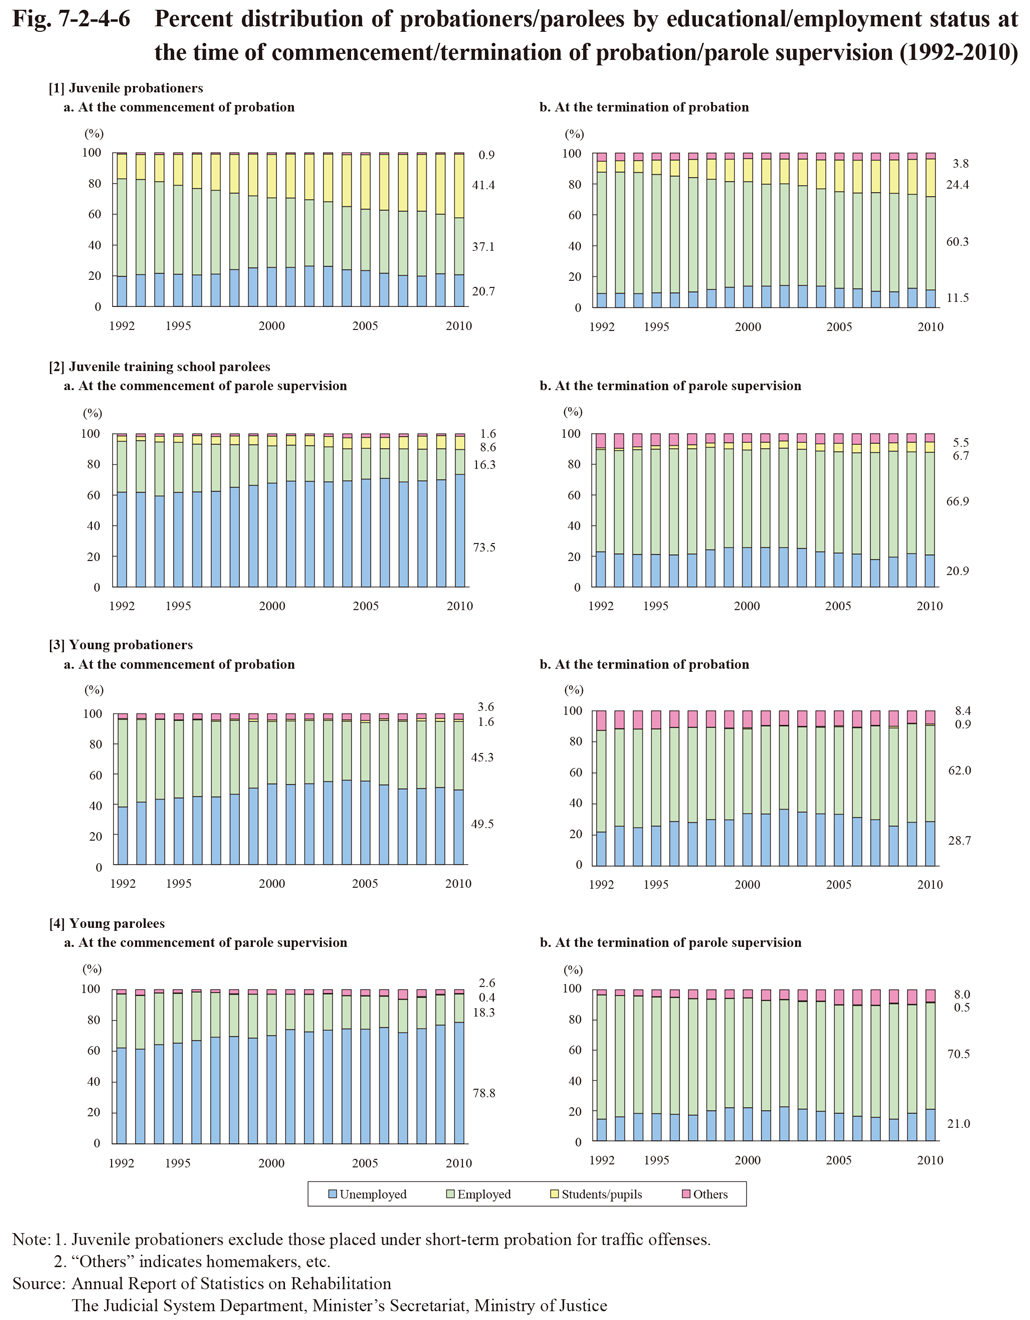
Fig. 7-2-4-6 shows the percent distribution of probationers/parolees by their educational/employment status at the time of the commencement/termination of their probation/parole supervision since 1992.
Although not purely speaking an exact comparison, as those whose probation/parole supervision commenced and those whose probation/parole supervision terminated the same year were not necessarily the same person, the proportion of those who were employed was higher at the time of termination of their probation/parole supervision than at the time of commencement with all juvenile probationers, juvenile training school parolees, young probationers, and young parolees. With young probationers, however, the difference in the proportion between those who were employed at the commencement of their probation and those who were employed at the termination of their probation was small when compared with the others.
Fig. 7-2-4-6 Percent distribution of probationers/parolees by educational/employment status at the time of commencement/termination of probation/parole supervision (1992-2010)