Section 4 Probation/Parole Supervision
1 Trends with juvenile/young probationers/parolees
(1) Juveniles and young offenders newly placed under probation/parole supervision
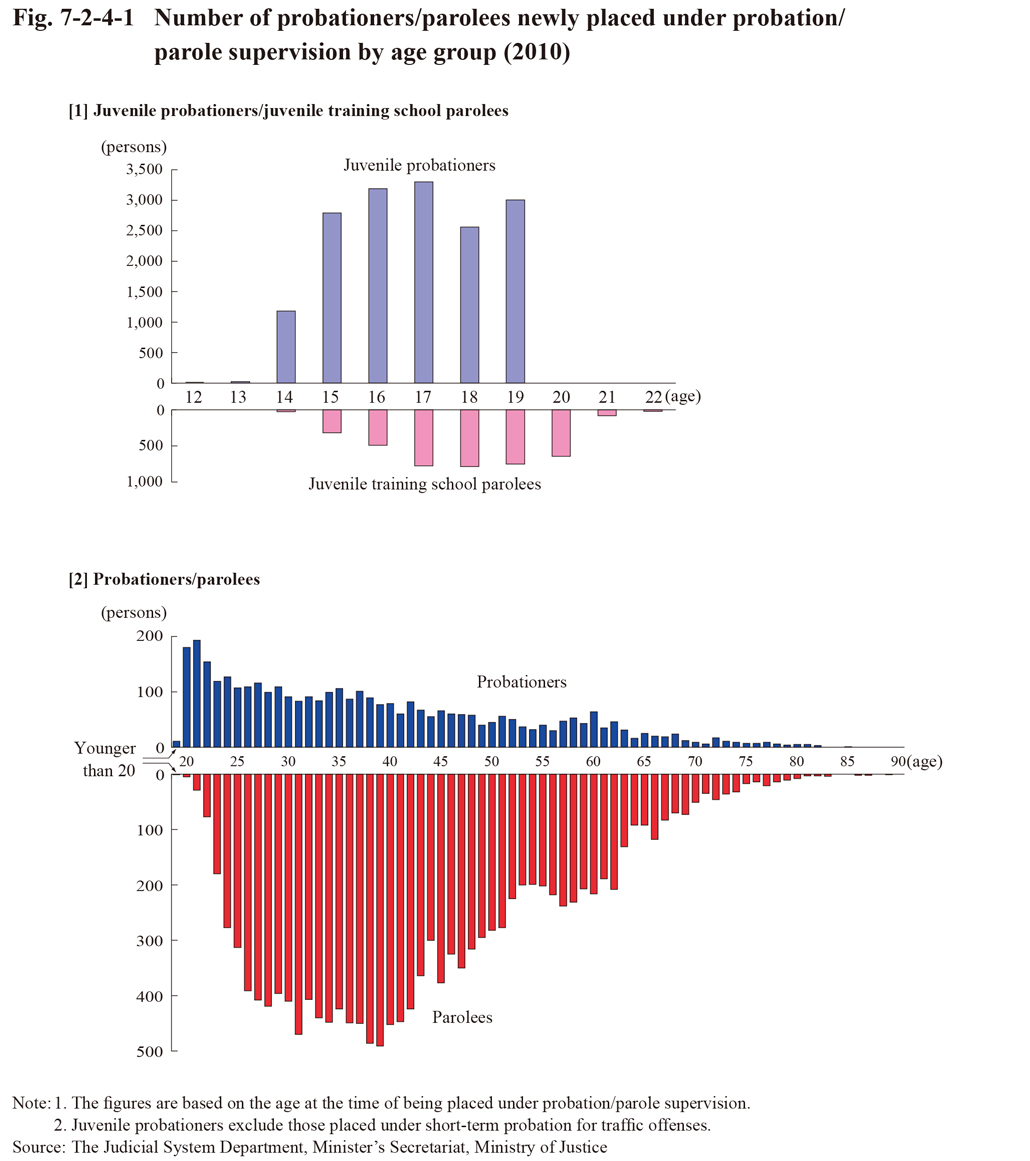
Fig. 7-2-4-1 shows the number of juvenile probationers (refers to juveniles placed under probation in a decision made by a family court; hereinafter the same), juvenile training school parolees (refers to juveniles discharged from juvenile training schools on parole; hereinafter the same), young probationers (refers to probationers who are younger than 30 years old; hereinafter the same), and young parolees (refers to parolees who are younger than 30 years old; hereinafter the same) newly placed under probation/parole supervision in 2010 by their age at the time of commencement of their probation/parole supervision. Those placed under probation at age 17 accounted for the highest proportion with juvenile probationers (excluding those placed under short-term probation for traffic offenses; hereinafter the same in this and the next section) at 3,301 (20.6%) and those placed under parole supervision at age 18 accounted for the highest proportion with juvenile training school parolees at 787 (20.3%).
With probationers the proportion of those aged 20-24 was high at 21.0% of the total for all age groups. In contrast to the fact that the proportion peaked at age around 40 and was low at age around 20, as observed in the percent distribution by age of new inmates (See Fig. 7-2-3-1 [2]), the proportion peaked at age around 21 and got lower as the age rose in the percent distribution by age of probationers newly placed under probation. The suspended execution rate was higher with young people than that with those across all the age groups (See Table 7-2-2-8) and the rate of those granted suspension of execution of the sentence with probation was higher than that of those sentenced to imprisonment without suspension of execution of the sentence particularly among young offenders who have just come of the age of 20, compared to those in other age groups.
In addition, the number of parolees increased as the age rose from around age 25 and then gradually decreased from around age 45. The parole rate of young released inmates (of whom the proportion of those imprisoned for the first time was higher than that of those reimprisoned) was higher at 64.7% than that of total released inmates (49.1%).
Fig. 7-2-4-1 Number of probationers/parolees newly placed under probation/ parole supervision by age group (2010)
(2) Age group
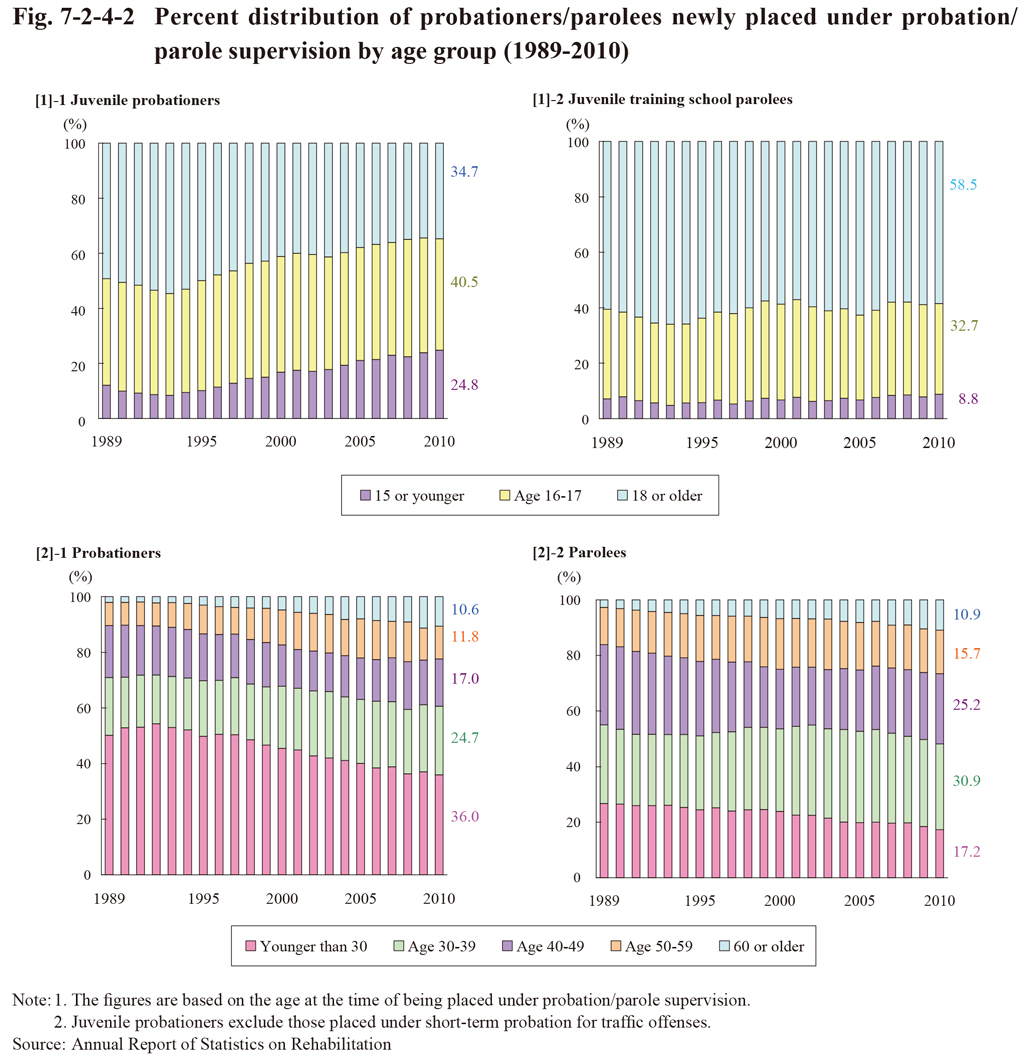
Fig. 7-2-4-2 shows the percent distribution of probationers/parolees newly placed under probation/parole supervision by age group since 1989. The percentage of juvenile probationers aged “15 or younger” doubled from 12.1% in 1989 to 24.8% in 2010, whereas the percentage of those aged “18 or older” declined, thus indicating the lowering of the age of juvenile probationers. With juvenile training school parolees (most of juveniles admitted to juvenile training schools are discharged on parole; (1) of Subsection 3, Section 4, Chapter 1, Part 3), the percentage of those aged “18 or older” remained at the high level of 57% to 66%.
Due to the aging of society the percentage of those younger than 30 was on a declining trend with both probationers and parolees. Still with probationers the percentage of those younger than 30 accounted for the highest percentage even in 2010.
Fig. 7-2-4-2 Percent distribution of probationers/parolees newly placed under probation/parole supervision by age group (1989-2010)