Section 2 Bodily Damage
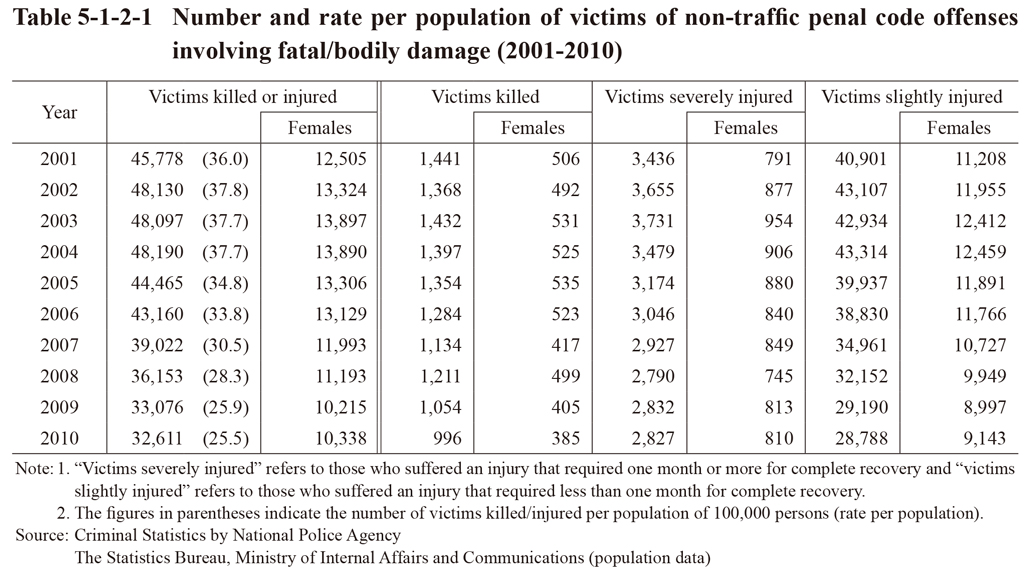
Table 5-1-2-1 shows the number and rate per population of victims of non-traffic penal code offenses involving fatal/bodily damage over the last 10 years. The number of victims killed/injured was on an increasing trend up to 2004 but then decreased over the next six consecutive years from 2005. The percentage of females of victims killed/injured rose from 27.3% in 2001 to 31.7% in 2010.
Table 5-1-2-1 Number and rate per population of victims of non-traffic penal code offenses involving fatal/bodily damage (2001-2010)