Section 1 Number of Cases Involving Human Victims
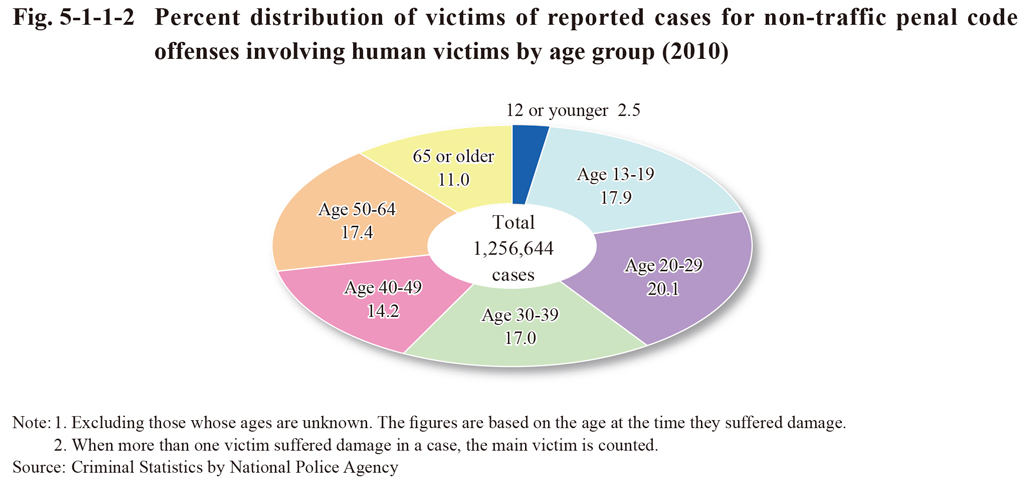
Fig. 5-1-1-1 shows the number of reported cases for non-traffic penal code offenses involving human victims and victim rate (number of reported cases involving human victims per 100,000 persons; hereinafter the same in this section) over the last 10 years. The number of reported cases and victim rate both continued to decrease/decline from 2003. The victim rate of males was approximately two times or more that of females.
Fig. 5-1-1-1 Number of reported cases for non-traffic penal code offenses involving human victims and victim rate by gender (2001-2010)
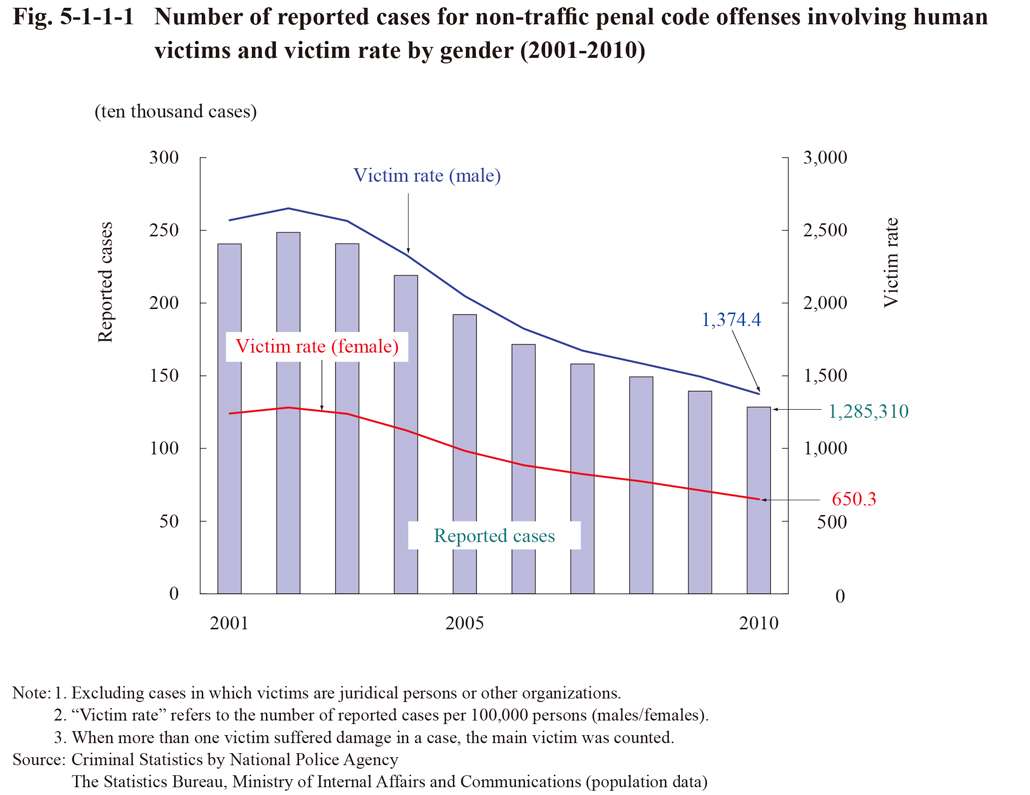
Fig. 5-1-1-2 shows the percent distribution of victims of reported cases for non-traffic penal code offenses involving human victims by age group in 2010.
Fig. 5-1-1-2 Percent distribution of victims of reported cases for non-traffic penal code offenses involving human victims by age group (2010)