2 Correction
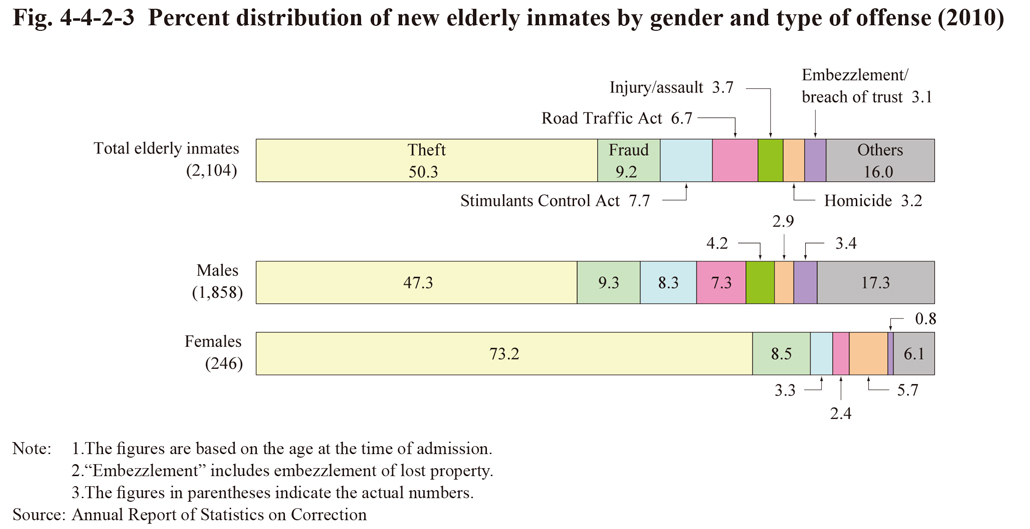
Fig. 4-4-2-2 shows the number of new elderly inmates by history of imprisonment over the last 20 years. The number was on a basically consistently increasing trend over the last 20 years with both inmates imprisoned for the first time and inmates reimprisoned, with that increasing trend being quite remarkable and the percentage of inmates reimprisoned high when compared with all new inmates (See Fig. 4-6-3-1).
Fig. 4-4-2-2 Number of new elderly inmates by history of imprisonment (1991-2010)
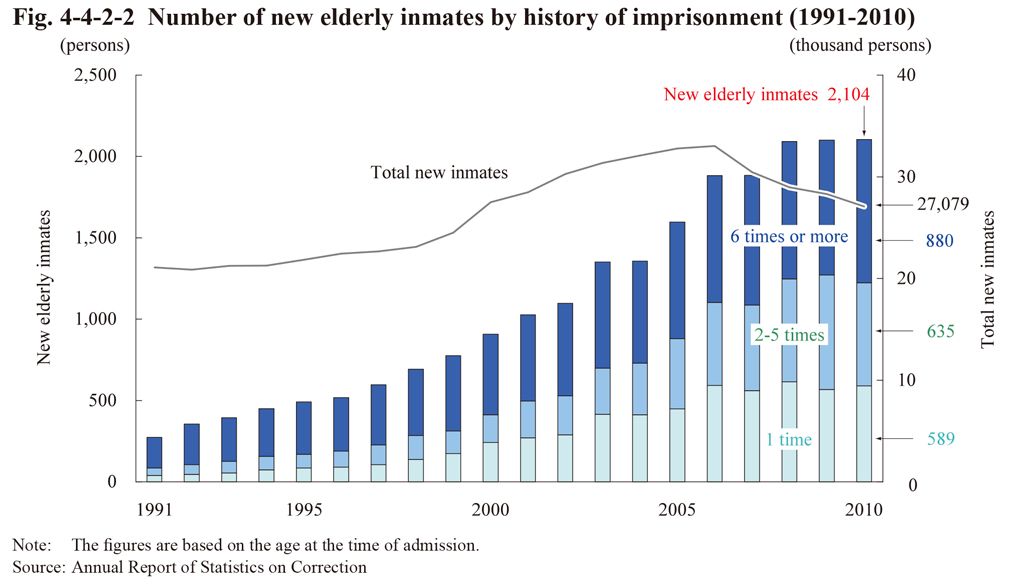
Fig. 4-4-2-3 shows the percent distribution of new elderly inmates by gender and type of offense in 2010. Overall the proportion for theft was the highest at 50.3%, followed by fraud at 9.2%, Stimulants Control Act violations at 7.7%, Road Traffic Act violations at 6.7%, and injury/assault at 3.7%. With females the proportion for theft was especially high at 73.2%.
Fig. 4-4-2-3 Percent distribution of new elderly inmates by gender and type of offense (2010)