3 Probation/parole supervision
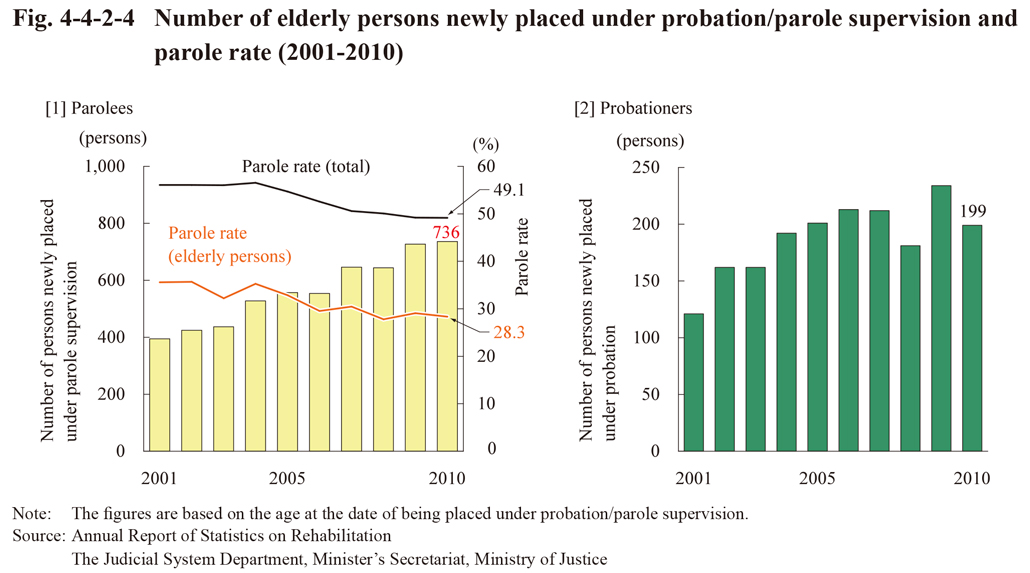
Fig. 4-4-2-4 shows the number of elderly probationers/parolees newly placed under probation/parole supervision and parole rate over the last 10 years. The number was on an increasing trend with both parolees and probationers in recent years, although the number of elderly probationers decreased in 2010 by 35 (15.0%) from the previous year. The parole rate for elderly persons was lower than that of total released inmates (approximately 49-57%), which is considered to be due to the fact that many elderly persons could not secure places to return to after being released because they had no guarantor, etc.
Fig. 4-4-2-4 Number of elderly persons newly placed under probation/parole supervision and parole rate (2001-2010)