Section 3 Correction
1 Inmates reimprisoned
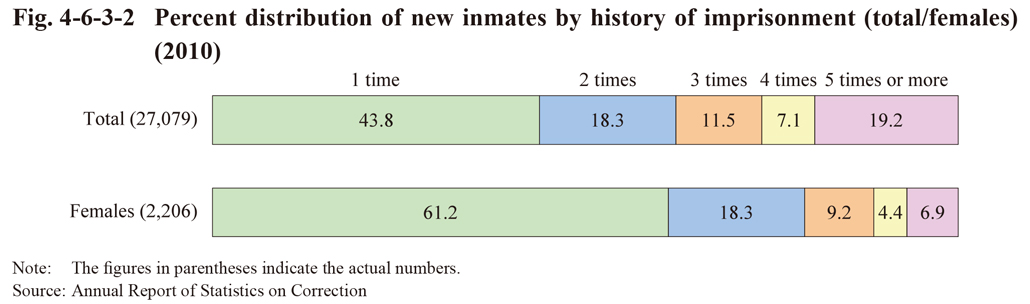
Fig. 4-6-3-1 shows the number of inmates imprisoned for the first time (refers to those imprisoned in a penal institution for the first time)/inmates reimprisoned (refers to those imprisoned in a penal institution for the second time or more) and the rate of reimprisoned inmates (refers to the percentage of inmates reimprisoned to all inmates) over the last 20 years. The number of inmates reimprisoned continued increasing every year from 1999, but then remained stable from 2007, and was 15,205 in 2010. The rate of reimprisoned inmates continued to rise every year from 2004, and was 56.2% in 2010.
With females the number of inmates reimprisoned was on an increasing trend from 2000, and was 857 in 2010. The rate of reimprisoned inmates was low when compared with males, but continued to rise every year from 2005.
Fig. 4-6-3-1 Number of inmates imprisoned for the first time/reimprisoned and rate of reimprisoned inmates (total/females) (1991-2010)
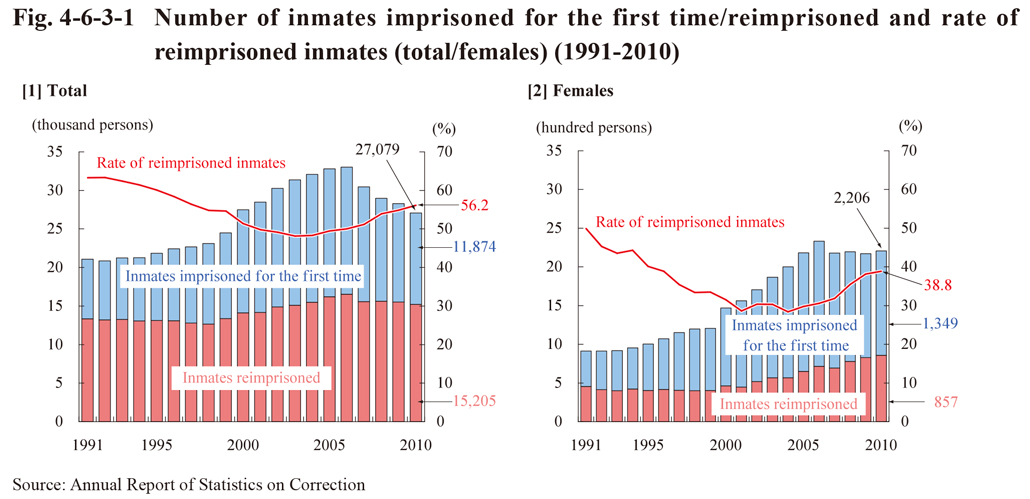
Fig. 4-6-3-2 shows the percent distribution of new inmates by history of imprisonment in 2010. Overall, those imprisoned multiple times accounted for more than 50%, while those imprisoned five times or more accounted for nearly 20%. With females those imprisoned for the first time accounted for over 60%, whereas those imprisoned five times or more accounted for the low percentage of 6.9% when compared to all new inmates (See Appendix 2-8 for the number of new inmates by type of offense and history of imprisonment in 2010).
Fig. 4-6-3-2 Percent distribution of new inmates by history of imprisonment (total/females) (2010)