| Previous Next Index Image Index Year Selection | |
|
|
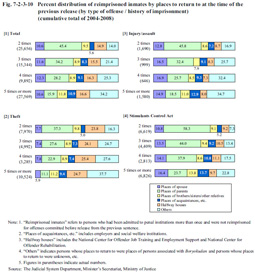
4 Places to return to on previous release Fig. 7-2-3-10 shows the percent distribution of reimprisoned inmates (cumulative total for 2004 to 2008) by the places they returned to at the time of the previous release, and by type of offense and history of imprisonment.As the history of imprisonment increases, the proportion of those with stable places to return to, such as “places of parents,” decreases along with the proportion of those with unstable places to return to, which is denoted as “others.” In addition, the proportion of those with unstable places to return to was high for theft, with “others” accounting for 37.7% of those who had been imprisoned five times or more. Regardless of their history of imprisonment, a certain proportion of inmates used halfway houses as places to return to after being released, thus indicating that halfway houses actually do function well in taking care of inmates who have no appropriate place to return to. Fig. 7-2-3-10 Percent distribution of reimprisoned inmates by places to return to at the time of the previous release (by type of offense / history of imprisonment) (cumulative total of 2004–2008)
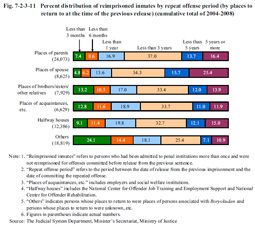
This reveals a strong tendency for reimprisoned inmates whose places to return to were “others” to have repeated offenses in a relatively short time. 24.1% of this group repeated offenses in less than three months, 38.5% in less than six months, and 56.6% in less than one year. However, although a relatively large number of those returned to halfway houses can be considered to have lacked close associates and therefore have had poor reformation/rehabilitation conditions, the repeat offense period among this group was relatively long when compared to those whose places to return to had been “others.” Fig. 7-2-3-11 Percent distribution of reimprisoned inmates by repeat offense period (by places to return to at the time of the previous release) (cumulative total of 2004–2008)
|