| Previous Next Index Image Index Year Selection | |
|
|
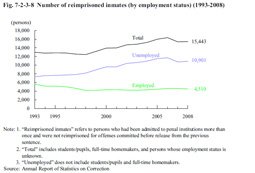
3 Employment status Fig. 7-2-3-8 shows the number of reimprisoned inmates by employment status at their time of reimprisonment over the last 16 years. The number of employed persons has been decreasing whereas the number of those unemployed has been on an increasing trend, with the rate of unemployed persons among reimprisoned inmates having had the significant increase from 56.4% in 1993 to 70.6% in 2008.Fig. 7-2-3-8 Number of reimprisoned inmates (by employment status) (1993–2008)
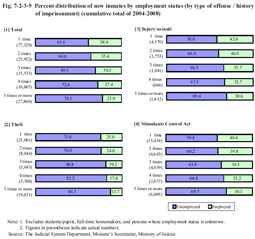
The proportion of unemployed persons increases as their history of imprisonment does. In addition, the proportion of unemployed persons is relatively high for theft and especially high at 86.3% for those who had been imprisoned five times or more. Fig. 7-2-3-9 Percent distribution of new inmates by employment status (by type of offense / history of imprisonment) (cumulative total of 2004–2008)
|