| Previous Next Index Image Index Year Selection | |
|
|
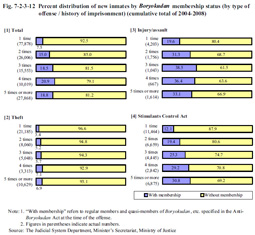
5 Status of Boryokudan membership Fig. 7-2-3-12 shows the percent distribution of new inmates (cumulative total for 2004 to 2008) by Boryokudan membership and by type of offense and history of imprisonment.In general, the percentage of persons associated with Boryokudan (refers to both the regular members and quasi-members of Boryokudan, etc. specified in the Anti-Boryokudan Act; hereinafter the same in this subsection) rose as the number of imprisonments increased. The percentage of persons associated with Boryokudan was 7.5% among those imprisoned for the first time, but considerably higher among those imprisoned two times or more, at 15.0 to 20.9%. By type of offense, the percentage of persons associated with Boryokudan was high for injury/assault at 19.6 to 38.5% but relatively low for theft at 3.4 to 7.1%. Although the percentage was relatively low for Stimulants Control Act violations at 12.1 to 30.8% when compared to injury/assault, it increased markedly as their number of imprisonments increased, thus indicating that the relationship with Boryokudan significantly affects the likelihood of repeat offenses. Fig. 7-2-3-12 Percent distribution of new inmates by Boryokudan membership status (by type of offense / history of imprisonment) (cumulative total of 2004–2008) |
