| Previous Next Index Image Index Year Selection | |
|
|
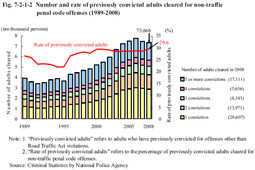
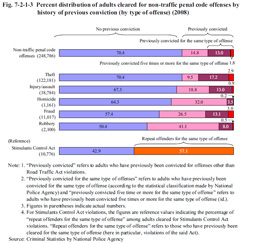
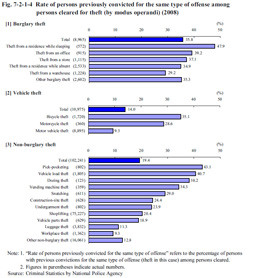
2 Previously convicted adults cleared for non-traffic penal code offenses Fig. 7-2-1-2 shows the number of previously convicted adults cleared for non-traffic penal code offenses (refers to those with previous convictions for offenses other than Road Traffic Act violations; hereinafter the same in this subsection) and the rate of previously convicted adults (refers to the percentage of previously convicted adults cleared for non-traffic penal code offenses; hereinafter the same in this subsection) over the last 20 years.The number of previously convicted adults cleared for non-traffic penal code offenses continued to increase from 1996 but then decreased slightly for two consecutive years from 2007, and was 73,668 in 2008. However, the rate of previously convicted persons has remained in the range of 22 to 30% since 1989. The percent distribution by number of previous convictions in 2008 reveals the proportion of those with one previous conviction to have been the highest at 38.8%, with the proportion of those with five or more previous convictions also being high at 23.2%. Fig. 7-2-1-2 Number and rate of previously convicted adults cleared for non-traffic penal code offenses (1989–2008) Fig. 7-2-1-3 shows the percent distribution of adults cleared for non-traffic penal code offenses by history of previous conviction in 2008.The rate of previously convicted persons was 29.6% among adults cleared for non-traffic penal code offenses. By type of offense (limited to homicide, robbery, and those for which more than 10,000 adults were cleared), however, the rate of previously convicted persons was remarkably high for robbery (49.6%) and fraud (42.6%). The percentage of persons with previous convictions for the same type of offense (according to statistical classifications made by the National Police Agency; hereinafter the same in this subsection) was 14.8% for non-traffic penal code offenses but as high as 20.1% for theft. The percentage of persons with five or more previous convictions for the same type of offense was 1.8% for non-traffic penal code offenses. Those for theft and fraud were also high at 2.9% and 3.0%, respectively. The percentage of persons with previous convictions for Stimulants Control Act violations to those cleared for violations of the said Act (57.1%) was listed as a reference value. The percentage of those with previous convictions for the same type of offense must be remarkably high for violations of the said Act when compared to that for non-traffic penal code offenses, considering that the prosecution rate for violations of that said Act is extremely high (81.7% in 2008). Fig. 7-2-1-3 Percent distribution of adults cleared for non-traffic penal code offenses by history of previous conviction (by type of offense) (2008) Fig. 7-2-1-4 shows the rate of persons previously convicted for the same type of offense (refers to the percentage of persons with previous convictions for the same type of offense (theft in this case) among persons cleared; hereinafter the same in this subsection) among persons cleared for theft in 2008 by modus operandi for the most recent theft.The modus operandi for theft was classified into three categories, namely burglary theft, vehicle theft, and non-burglary theft, and the rate of persons previously convicted for the same type of offense then compared. It was the highest for burglary theft at 35.8%, followed by non-burglary theft (19.4%), and then vehicle theft (14.0%). However, the rate of persons previously convicted for the same type of offense among those cleared for pick-pocketing, vehicle load theft, dozing theft, and vending machine theft (among non-burglary theft) and for motor vehicle theft (among vehicle theft) exceeded 30% in all persons clealed. Fig. 7-2-1-4 Rate of persons previously convicted for the same type of offense among persons cleared for theft (by modus operandi) (2008) |


