| Previous Next Index Image Index Year Selection | |
|
|
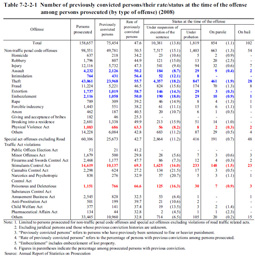
1 Previously convicted persons among those prosecuted Table 7-2-2-1 shows data concerning previously convicted persons (refers to persons who had previously been sentenced to fine or heavier punishment in a final judgment; hereinafter the same in this subsection), revealing the number and rate of such persons (refers to the percentage of persons with previous convictions among those prosecuted excluding juridical persons and those whose previous conviction histories are unknown; hereinafter the same in this subsection) who were then prosecuted (limited to non-traffic penal code offenses and special act offenses excluding Road Traffic Act violations; hereinafter the same in this subsection) in 2008, and the number of such persons by their status at the time of the offense (under suspension of execution of the sentence, on parole, or on bail) by type of offense prosecuted.Table 7-2-2-1 Number of previously convicted persons/their rate/status at the time of the offense among persons prosecuted (by type of offense) (2008)
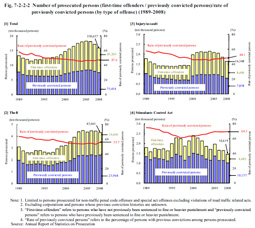
The rate of previously convicted persons for Stimulants Control Act violations, Poisonous and Deleterious Substances Control Act violations, and Physical Violent Act violations exceeded 60% while that for extortion, intimidation, and theft exceeded 55%. In addition, the percentage of persons who were under suspension of execution of the sentence at the time of the offense among previously convicted persons was high for drug-related offenses (16.0 to 21.5%), theft (18.2%) and embezzlement (18.0%). Fig. 7-2-2-2 shows the number of prosecuted first-time offenders (refers to persons who had not previously been sentenced to fine or heavier punishment) or previously convicted persons and the rate of previously convicted persons by type of offense over the last 20 years. The rate of previously convicted persons to all prosecuted persons has been in the range of about 45 to 58% since 1989 and was 47.6% in 2008. By type of offense, this rate has been in the range of about 53 to 64% for theft (55.7% in 2008), about 45 to 58% for injury/assault (48.1% (id.)), and about 61 to 75% for Stimulants Control Act violations (69.3% (id.)) since 1989. Fig. 7-2-2-2 Number of prosecuted persons (first-time offenders / previously convicted persons)/rate of previously convicted persons (by type of offense) (1989–2008)
|